Working Safely with Data and AI
Pingfan Hu
&
Dr. John Helveston
George Washington University
Agentic Workflows with Claude Code
Roadmap
Use GitHub
Code-Based Pipelines
Protect Sensitive Data
Use GitHub
Use
GitHub
Manual cloud storage
Nothing uploads until you commit and push
Traces every change
Review or discard file edits
A place to share
Share your works to the community by public repos
Download GitHub Desktop
to get started.
Audit what the
agent changed
make_figure.py
changed by the agent
df = pd.read_csv("data/life-expectancy.csv")
- df = df.dropna()
+ df = df.fillna(0)
fig = px.choropleth(df, locations="iso_code")
GitHub shows you
every line an agent touched
, so you can keep the change or throw it away.
That one edit quietly turned missing values into zeros. You would want to catch that before it reaches a figure.
GitHub
Extensive Features
Branches
Merges
Forks
Pull Requests
Issues
Tags
Actions
GitHub Pages
Code-Based Pipelines
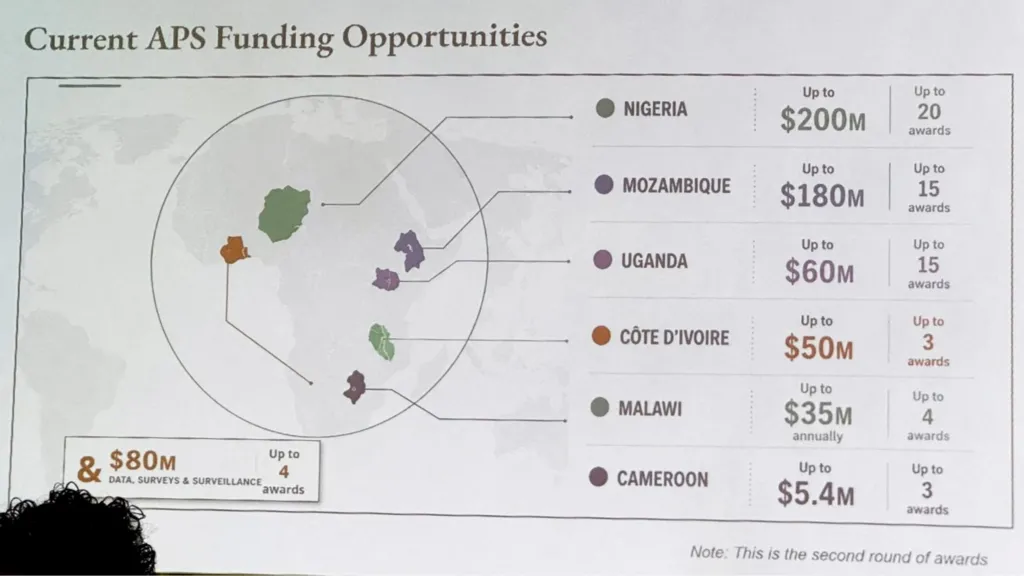
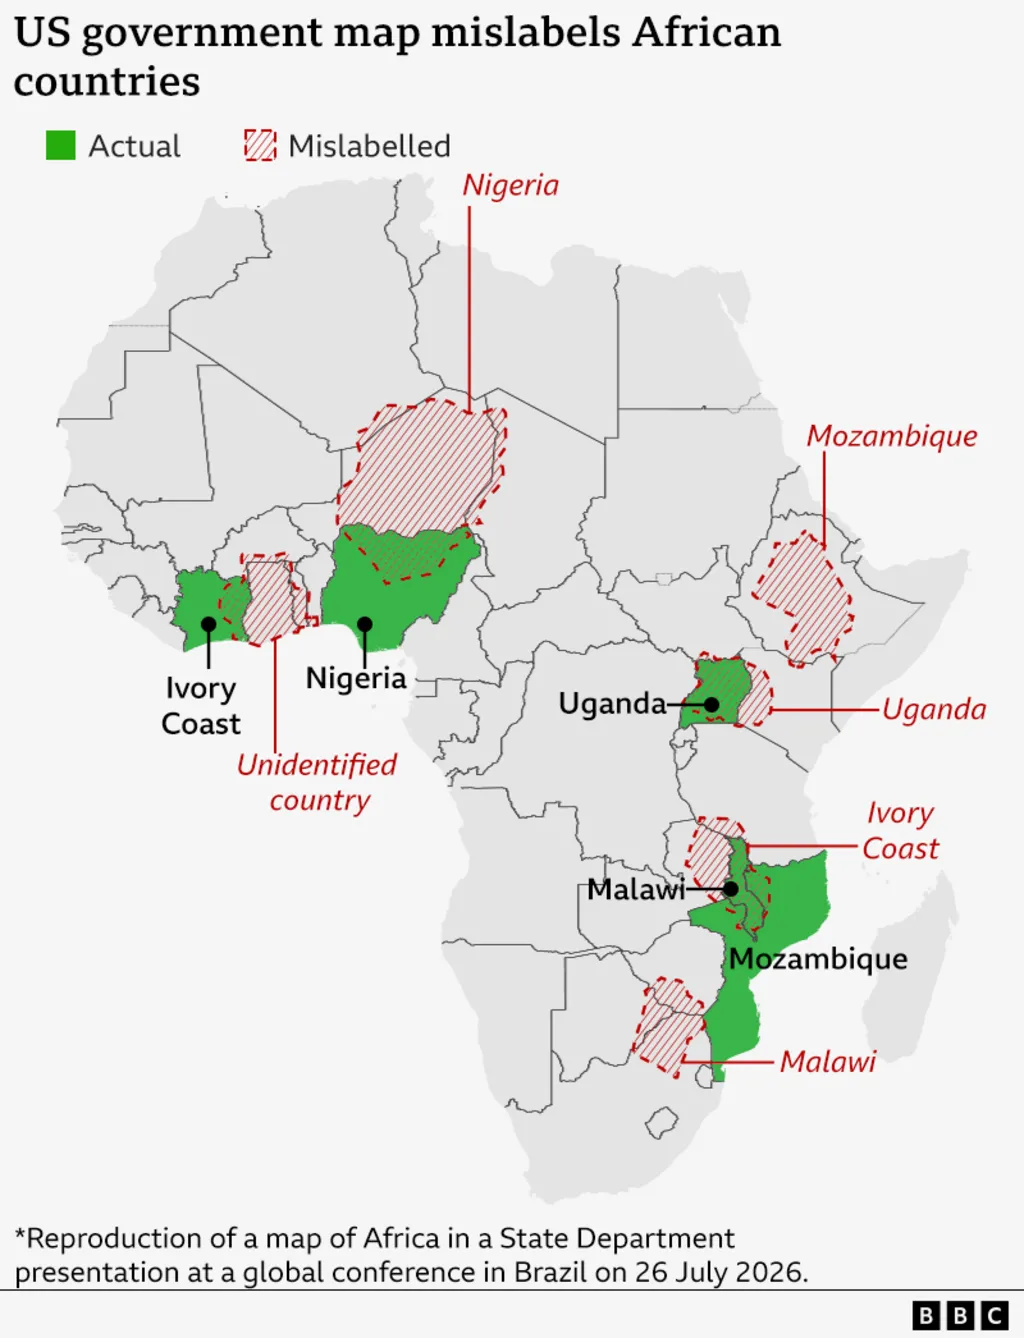
Sometimes AI gets it
wrong
Source:
BBC News
Every country was in the
wrong place
🤦
Source:
BBC News
Build the map with
code
Build the
code
, not the
artifact
The structure
project/
input/
data.csv
script.R
output/
figure.png
The script
script.R
library(tidyverse) data <-
"input/data.csv"
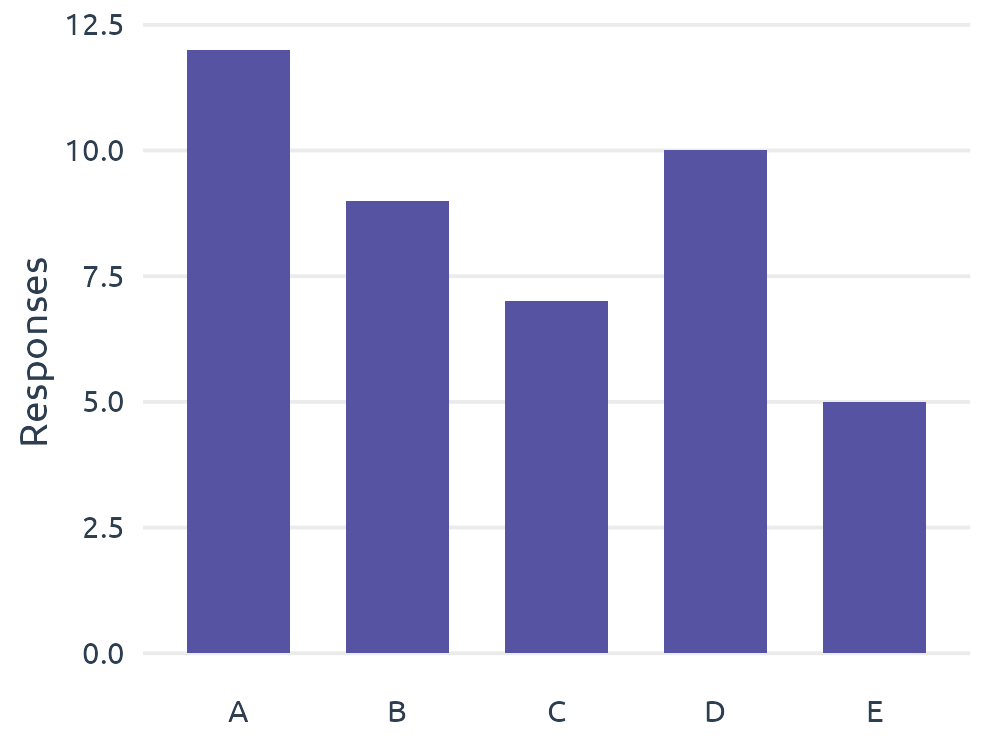
%>% read_csv() %>% count(group, choice) data %>% ggplot(aes(group, n)) + geom_col(aes(fill = choice)) ggsave(
"output/figure.png"
)
Build the
code
, not the
artifact
data.csv
figure.png
group
choice
A
yes
A
maybe
B
no
B
maybe
C
yes
C
no
⋮
script.R
Same workflow,
with
or
without
AI
data.csv
script.R
figure.png
Then
handcrafting
Set up the work tree
by hand
Build the scripts
by hand
Run it
by hand
Verify the output
by hand
Now
agentic crafting
Set up the work tree
with AI
Build the scripts
with AI
Run it
with AI
Verify the output
still you
Another Example:
Map of USA
Download the source files
Enhanced by agents:
writing code
Agents rarely make a syntax mistake.
no typos
no missing brackets
instant setup scripts
but...
You are the gatekeeper for the coding results.
Enhanced by agents:
organizing files
input/
acs-2019.csv
acs-2021.csv
nhts-2022.csv
evse-2023.csv
45 more
scripts/
01-clean.R
02-merge.R
03-visualize.R
04-model.R
README.md
output/
summary.csv
figure.png
model.rds
report.html
table.tex
Enhanced by agents:
sanity checks
sanity-checks.R
row count survived the merge
1,200 → 1,200
every ID appears once
0 duplicates
a percentage above 100%
check the units
Protect Sensitive Data
Protect your
sensitive data
Government records
Personal health data
Proprietary data
Human subjects research
Real
vs
Fake
faker
fake =
Faker()
; fake.name(); fake.job()
charlatan
charlatan::
ch_generate("name", "job", n = 1200)
Real
benefits.csv
real
id
name
job
income
10382
R. Alvarez
Nurse
82,437
10383
M. Chen
Teacher
39,751
...
...
...
...
Stays with you. Run the scripts on your own.
Fake
fake_benefits.csv
synthetic
id
name
job
income
90001
Luke Skywalker
Pilot
50,000
90002
Leia Organa
Senator
60,000
...
...
...
...
Share with the agent to prove the workflow.
— demo —
Watch us rebuild this chart, with code.
Life expectancy in Africa
, from
ourworldindata.org/grapher/life-expectancy
Get the data
Claude downloads the CSV. We look at what it actually saved.
Ask for the code
Not "make me a map" but "write an
R script
that makes the map."
Prove it
Change the year, rerun the
same script
. The map rebuilds itself.
Nothing to type.
Every step is written up on the workshop website.
Final
takeaways
Codify your workflow
Coded steps make your work stable and reproducible.
Think on your own
Agents naturally don't have points and don't converge into concrete results.
Understand what you build
You still judge the data, the scripts, and the output.
One More Thing…
"
Your success is determined by your
ability to speak
, your
ability to write
, and the
quality of your ideas
— in that order.
— Patrick Winston, MIT, 2018
Thank you for joining us
Pingfan Hu
PhD Candidate, EMSE
Systems Engineering
pingfan.org
Dr. John Helveston
Associate Professor, EMSE
Director, Data Analytics
jhelvy.com
The George Washington University