Pingfan Hu

Education
PhD Candidate in Systems Engineering, advised by Dr. John Helveston, George Washington University, USA
M.P.E in Mechanical Engineering, University of Sydney, Australia
B.S. in Industrial Engineering, Pennsylvania State University, USA
Work Experience
Assistant Process Engineer, Kurtz Ersa, Germany
Project Engineer, Daimler Beijing, China
Project Engineer, Hasco Rail, USA
Research Interests
Data Science in transportation systems and human behavior
Open-Source Software in tools for survey research
Agentic AI Engineering around Claude Code
EV sales in US reaching ~10% of sales
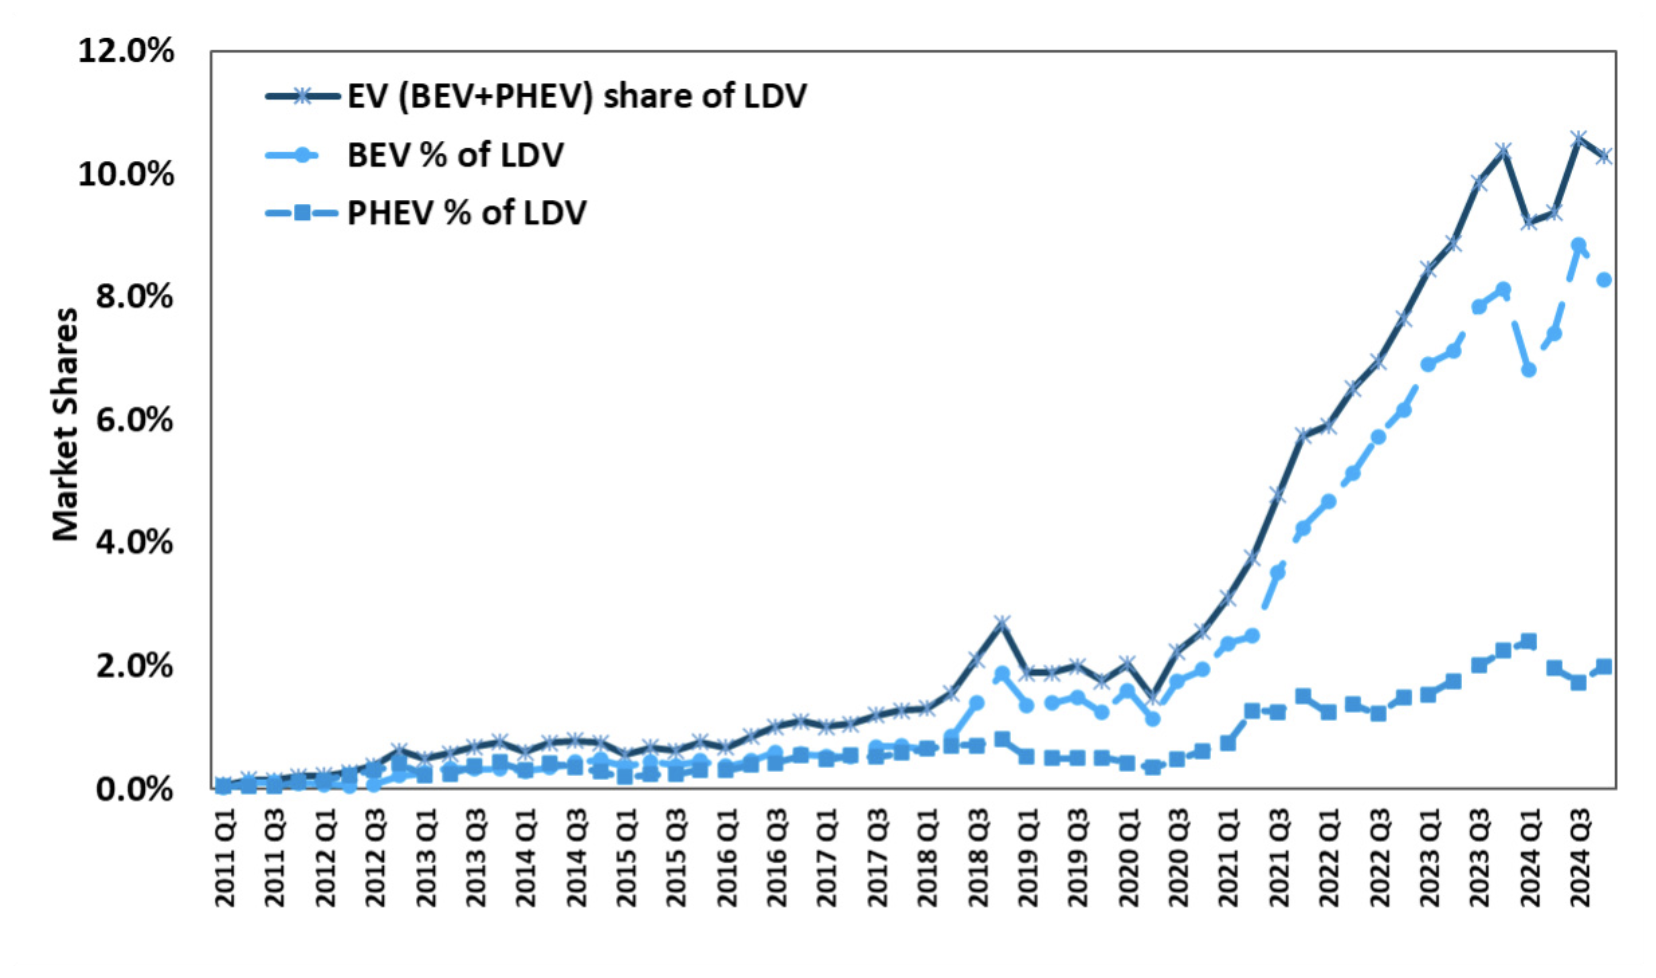
Source: Argonne National Lab, www.anl.gov/ev-facts/model-sales
Introduction
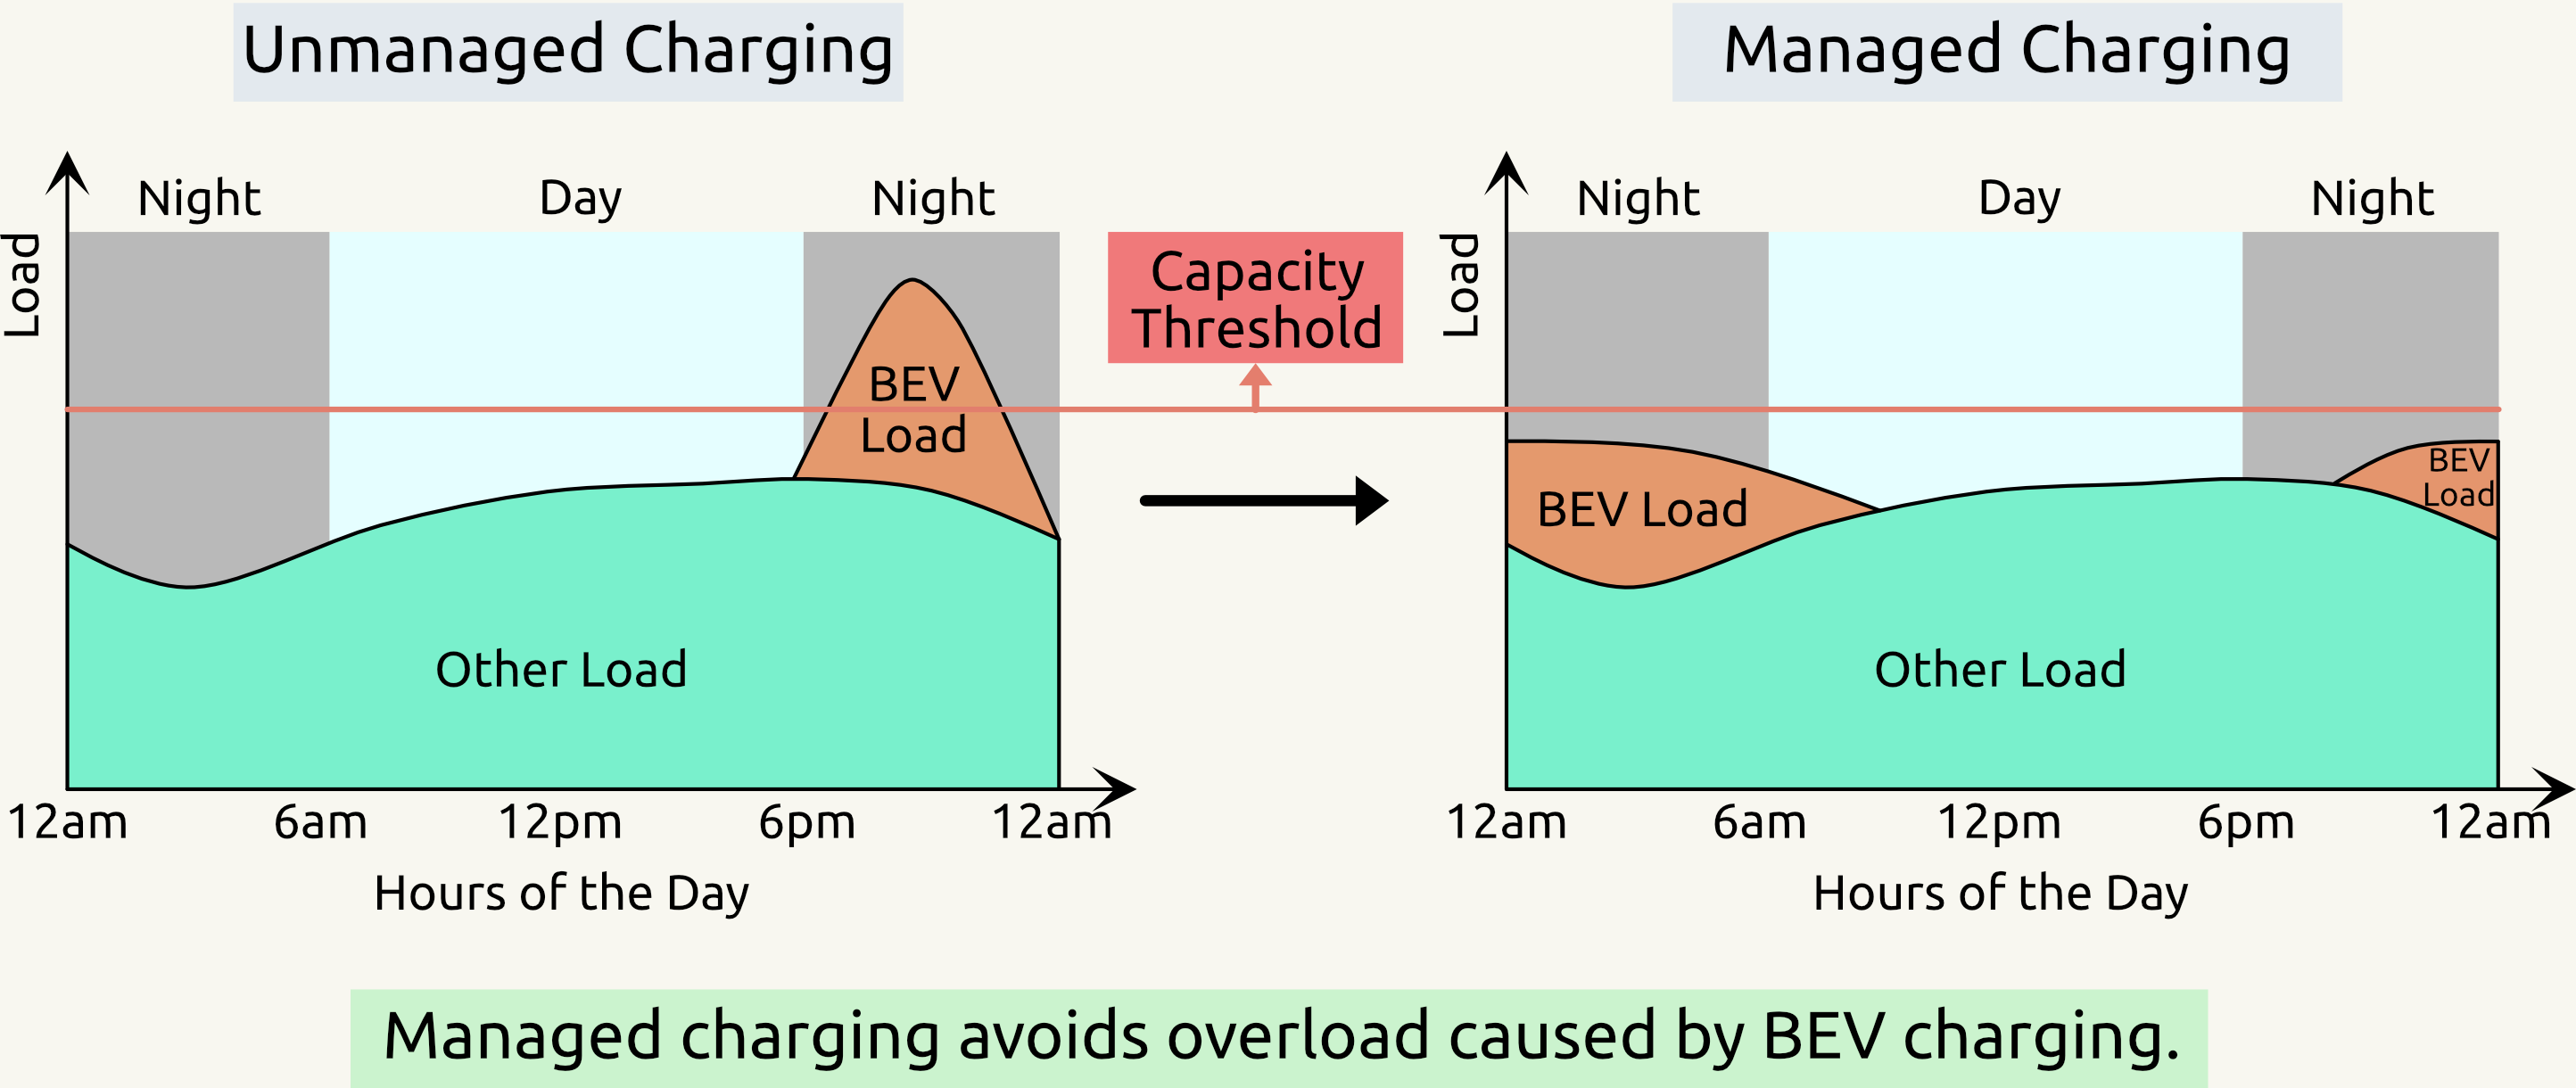
- Unmanaged BEV charging is becoming a problem to the grid.
- Managed charging is cheaper and smooths out the grid load.
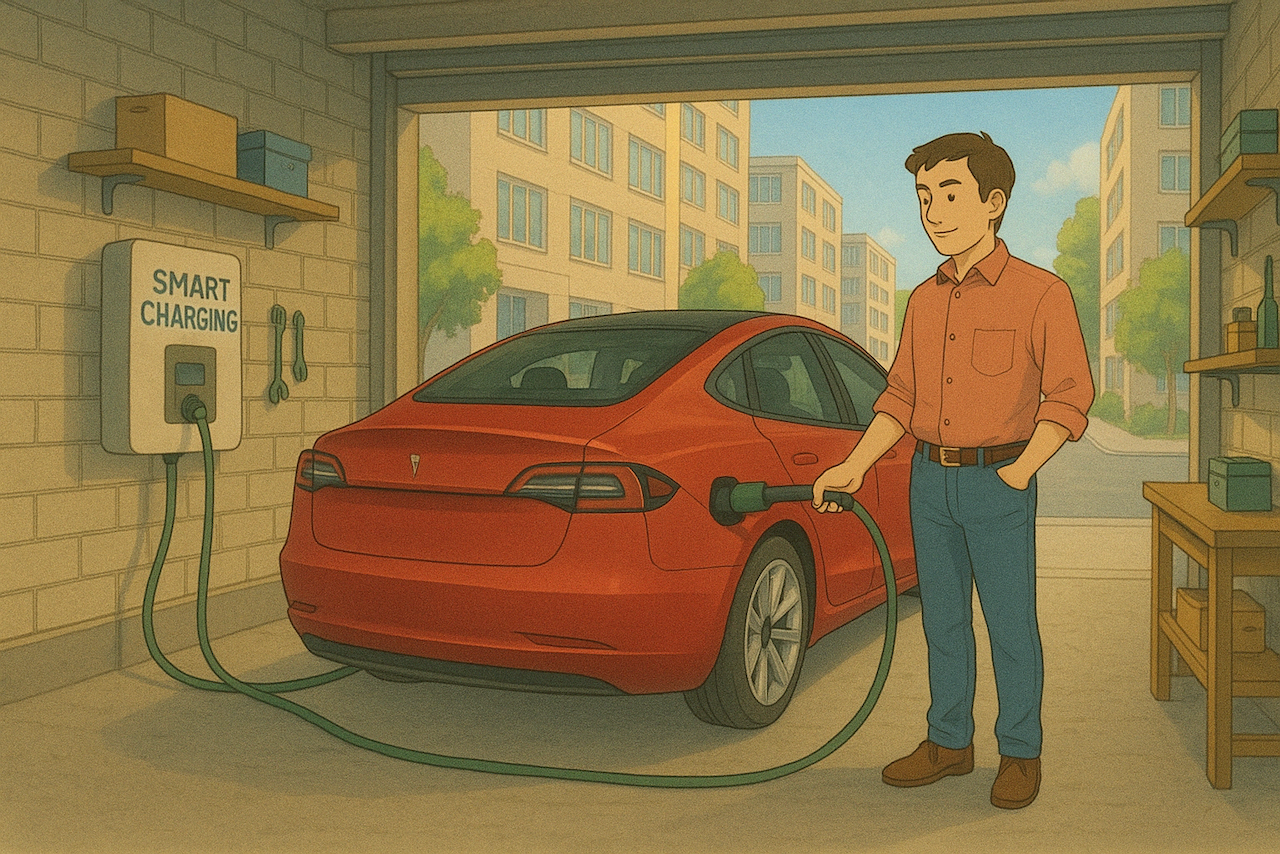
SMC - Supplier Managed Charging
- SMC smooths out the BEV charging spike (called “Peak-shaving”).
- Electricity demand is controlled below the capacity threshold.
- It saves money and reduces pollution.
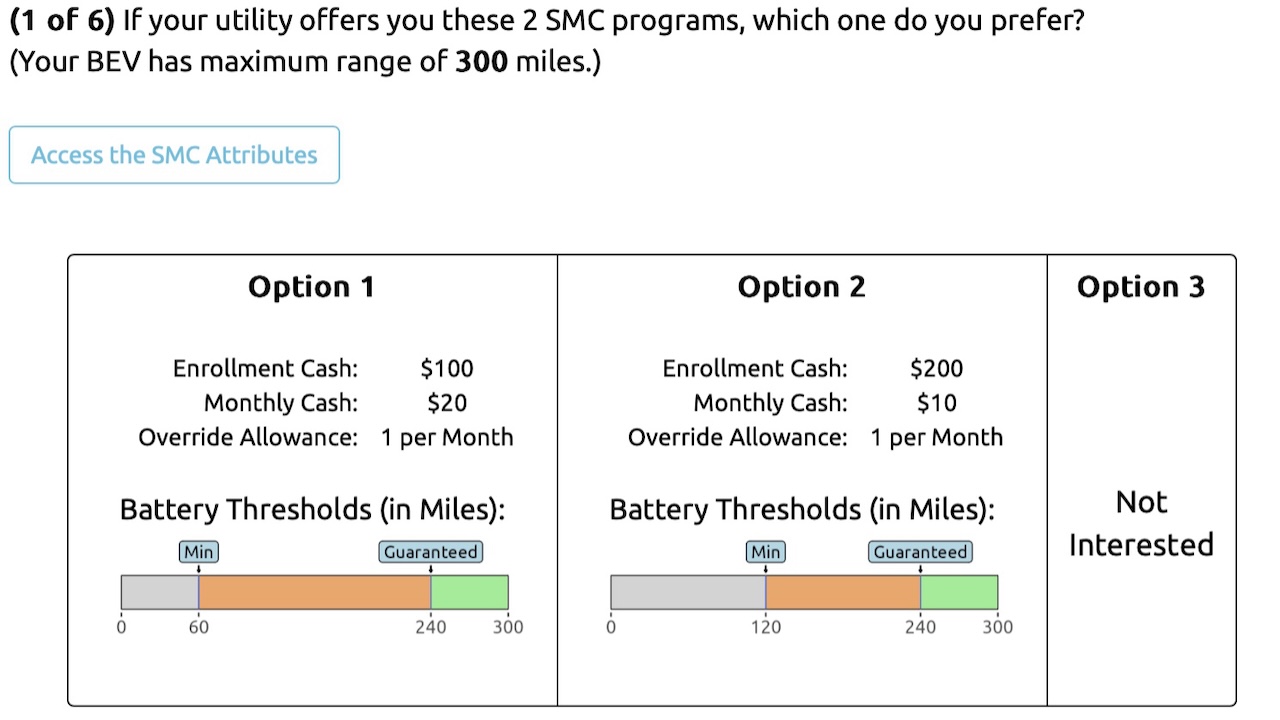
Prior stage: willingness to enroll in SMC
Conjoint survey of BEV owners (Hu et al., 2025)
1,356
BEV owner responses
803 + 553
Meta Ads + Dynata, 2024
5 attributes
cash, overrides, battery thresholds
Two contrasting regions: CAISO and NYISO
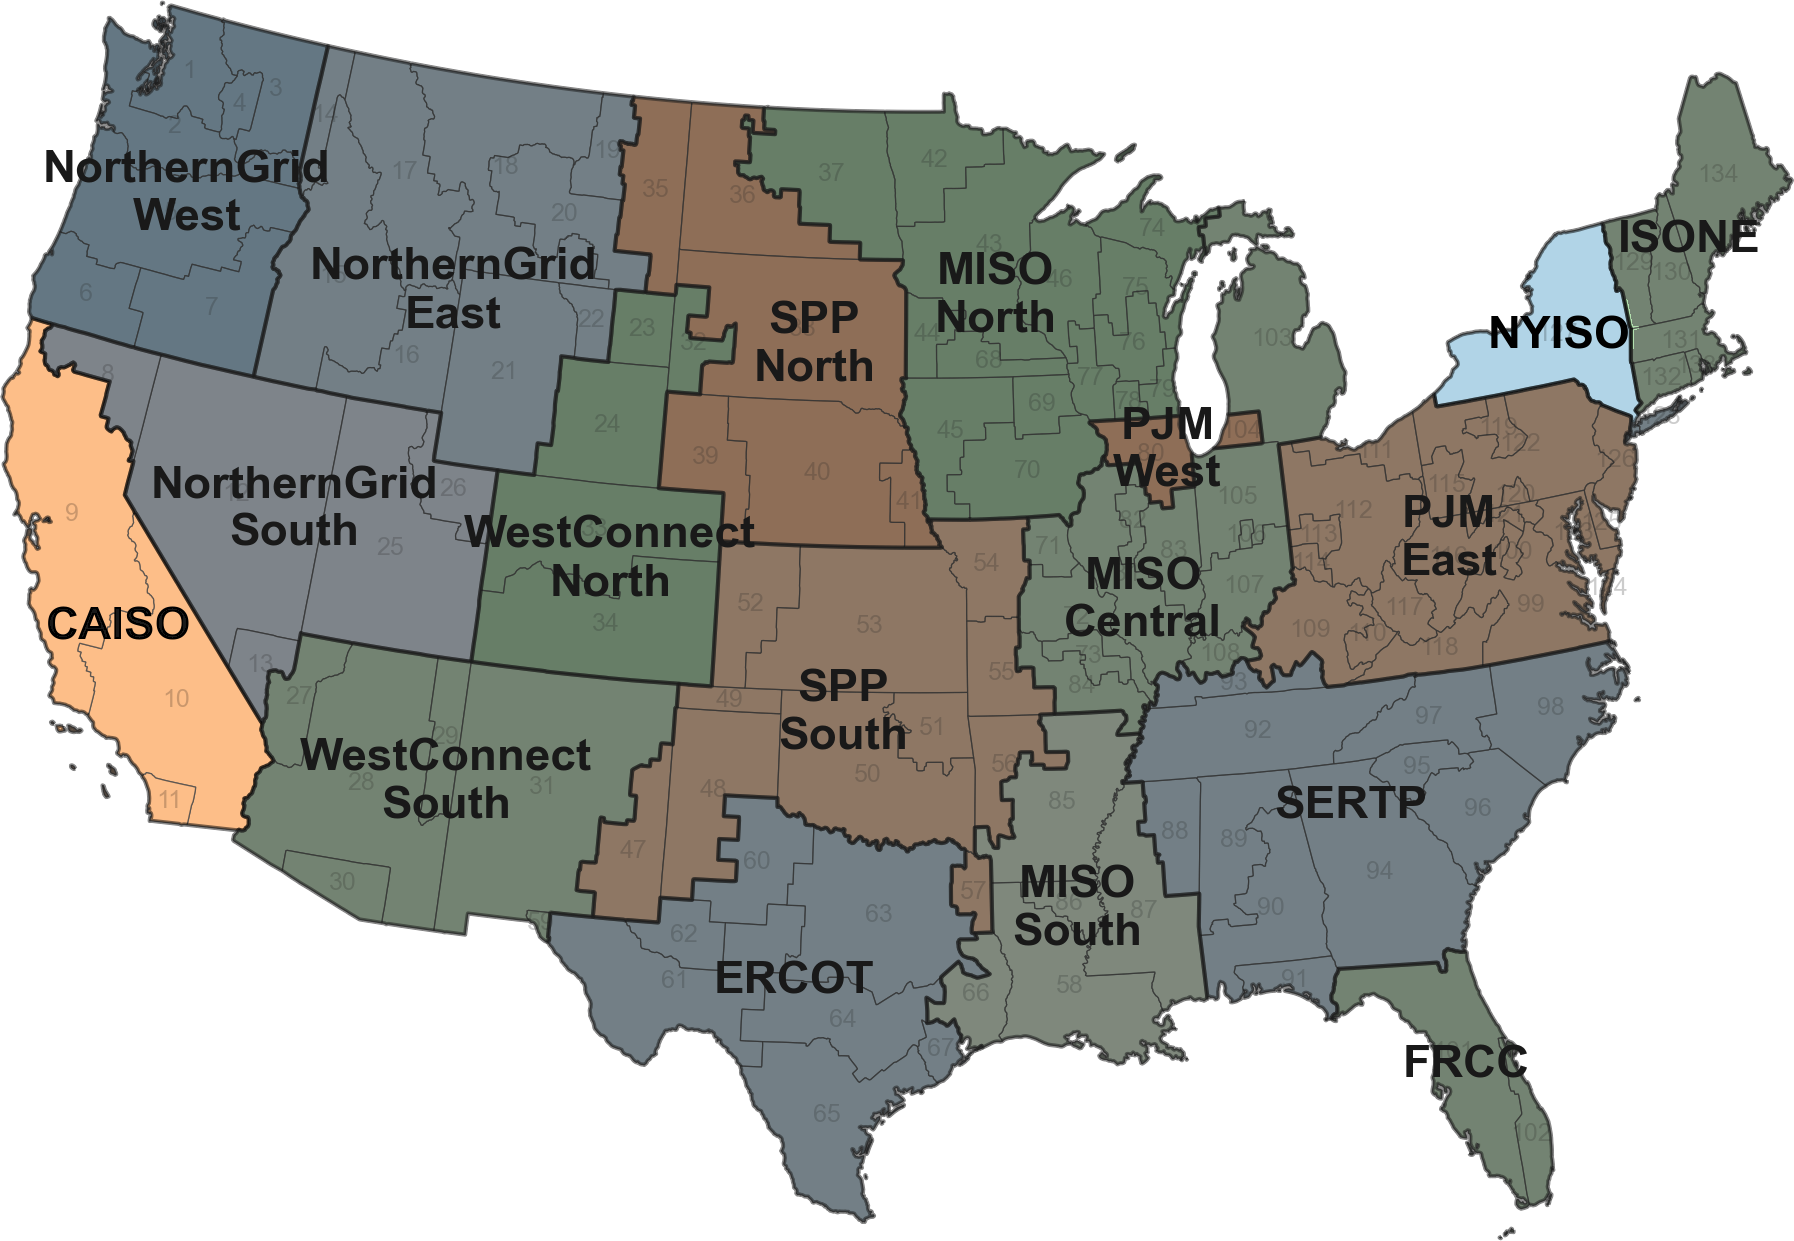
Both lead in BEV adoption, with contrasting grid structures.
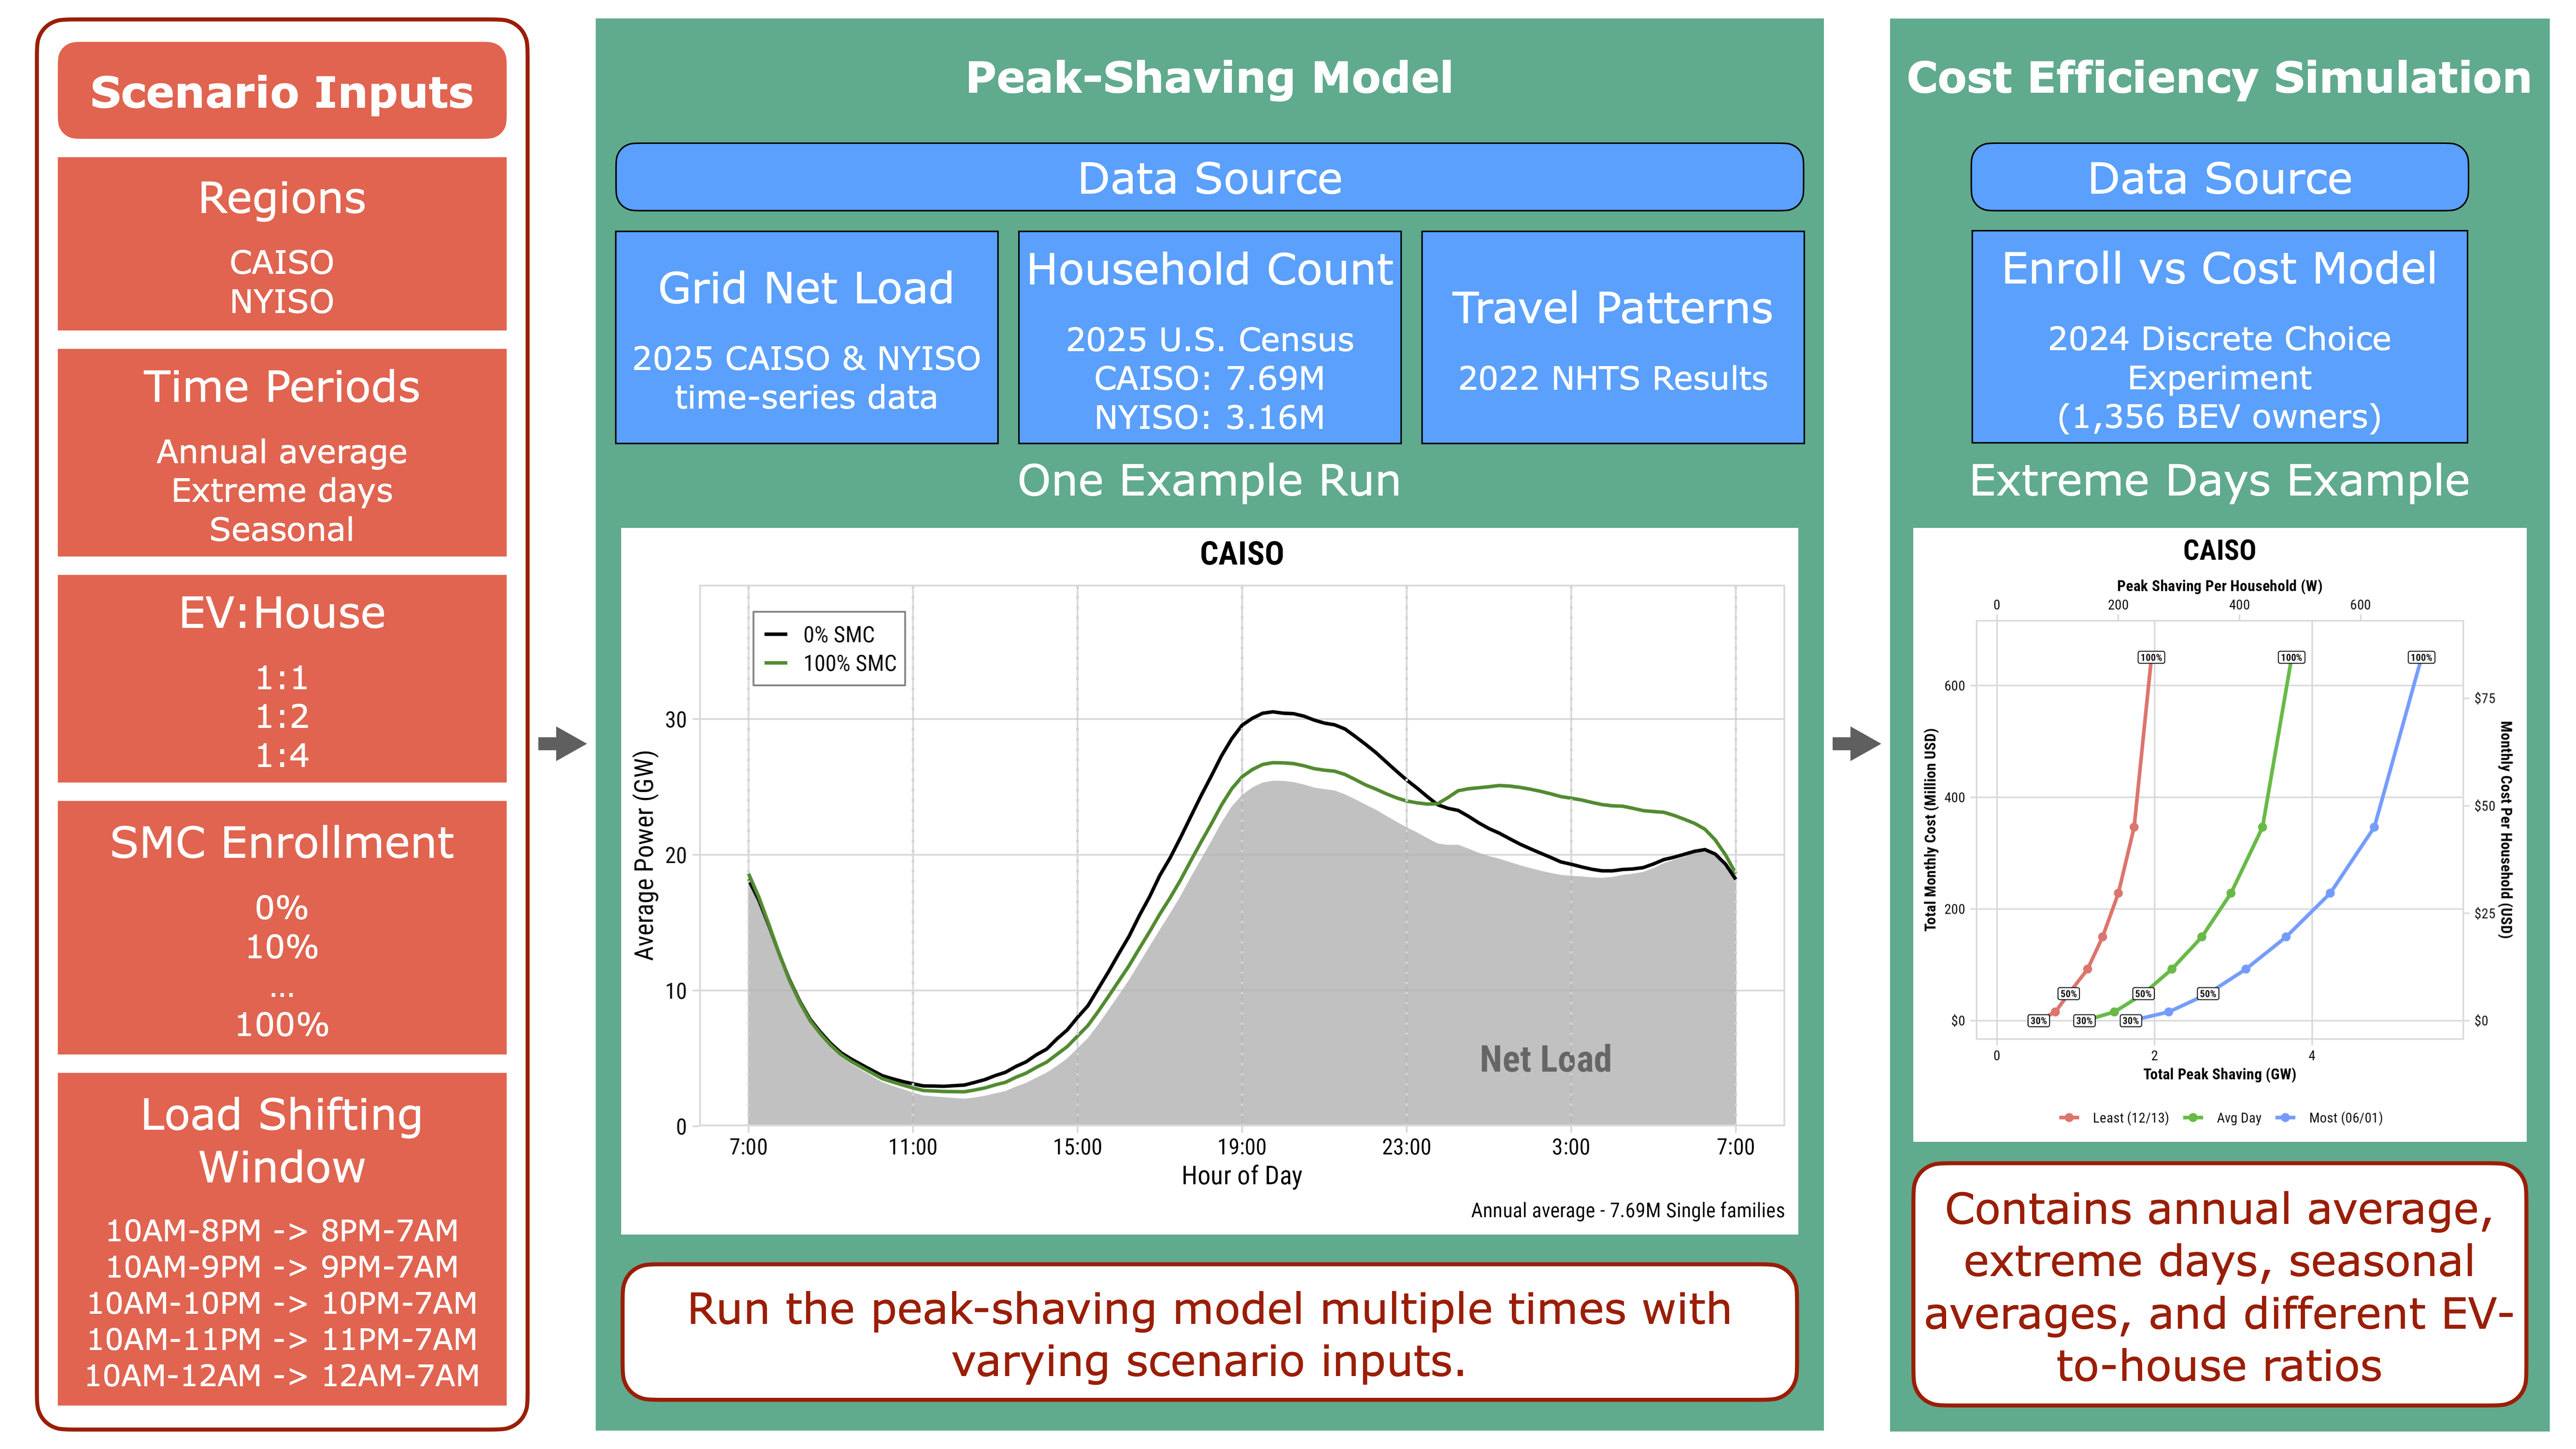
Simulation Overview
Step 1: BEV Charging Load Profile
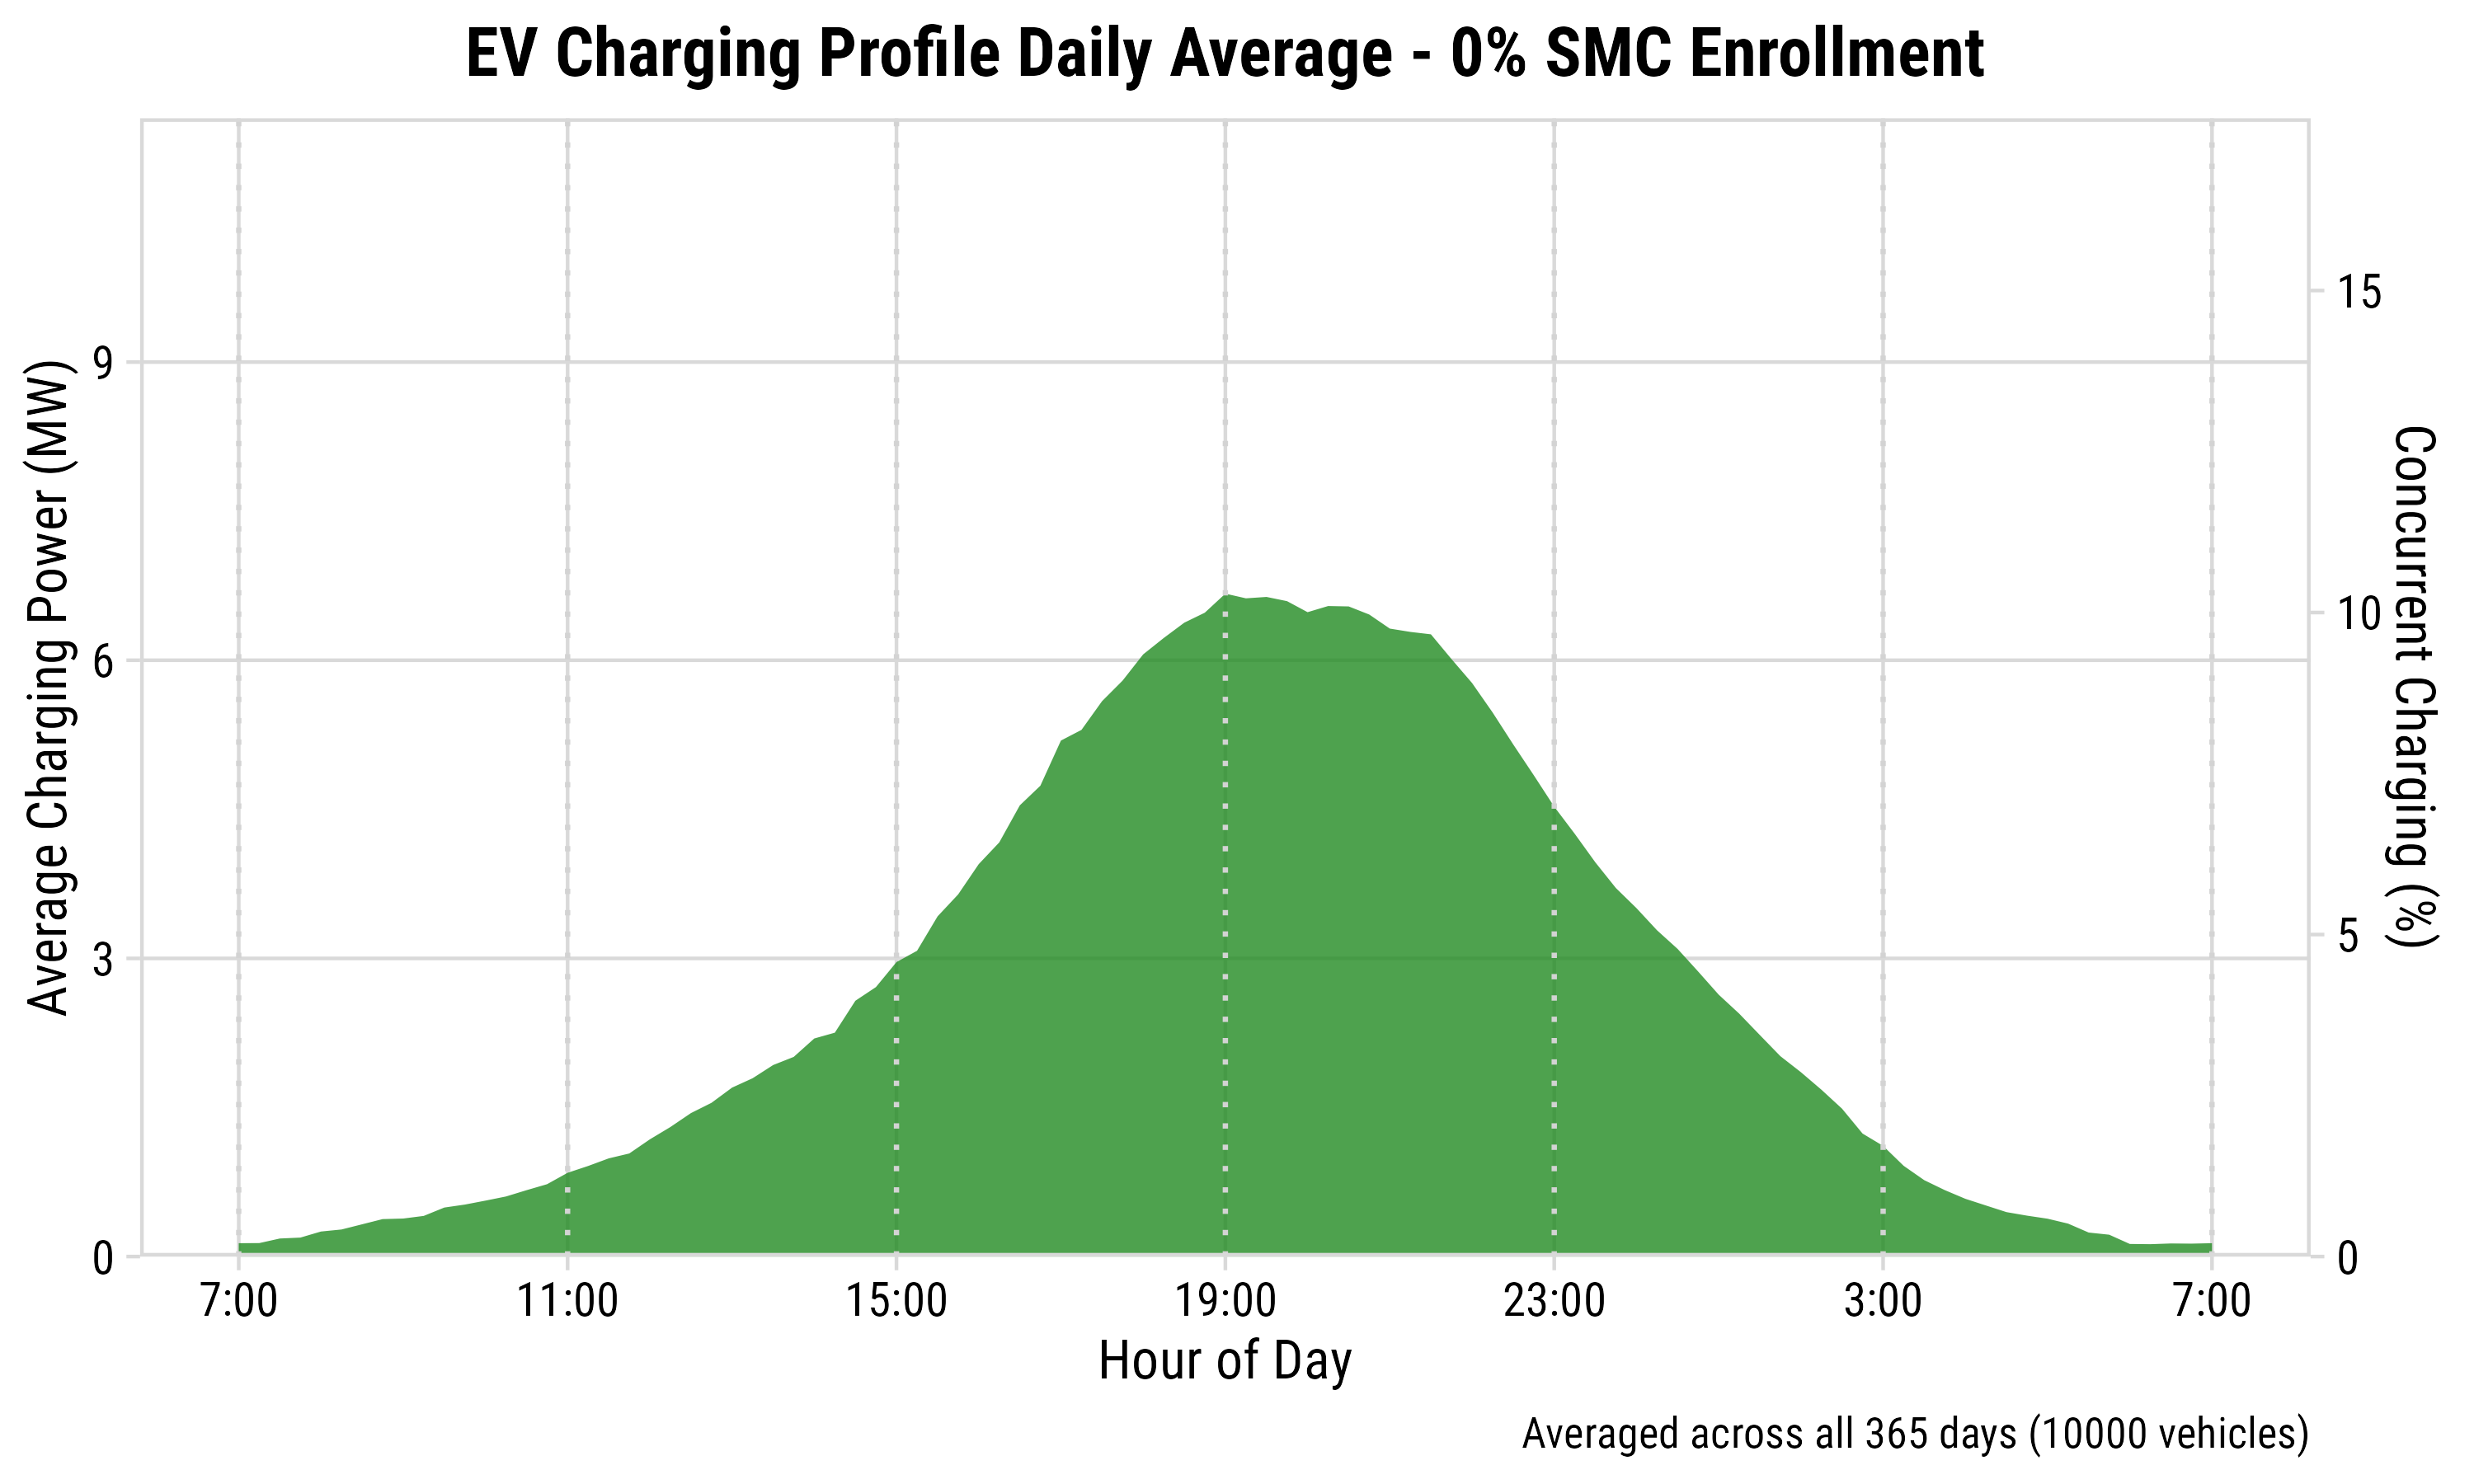
Simulation of 10,000 vehicles based on ~26,000 trip records from 2022 NHTS.
Step 2: BEV Load Peak Shaving
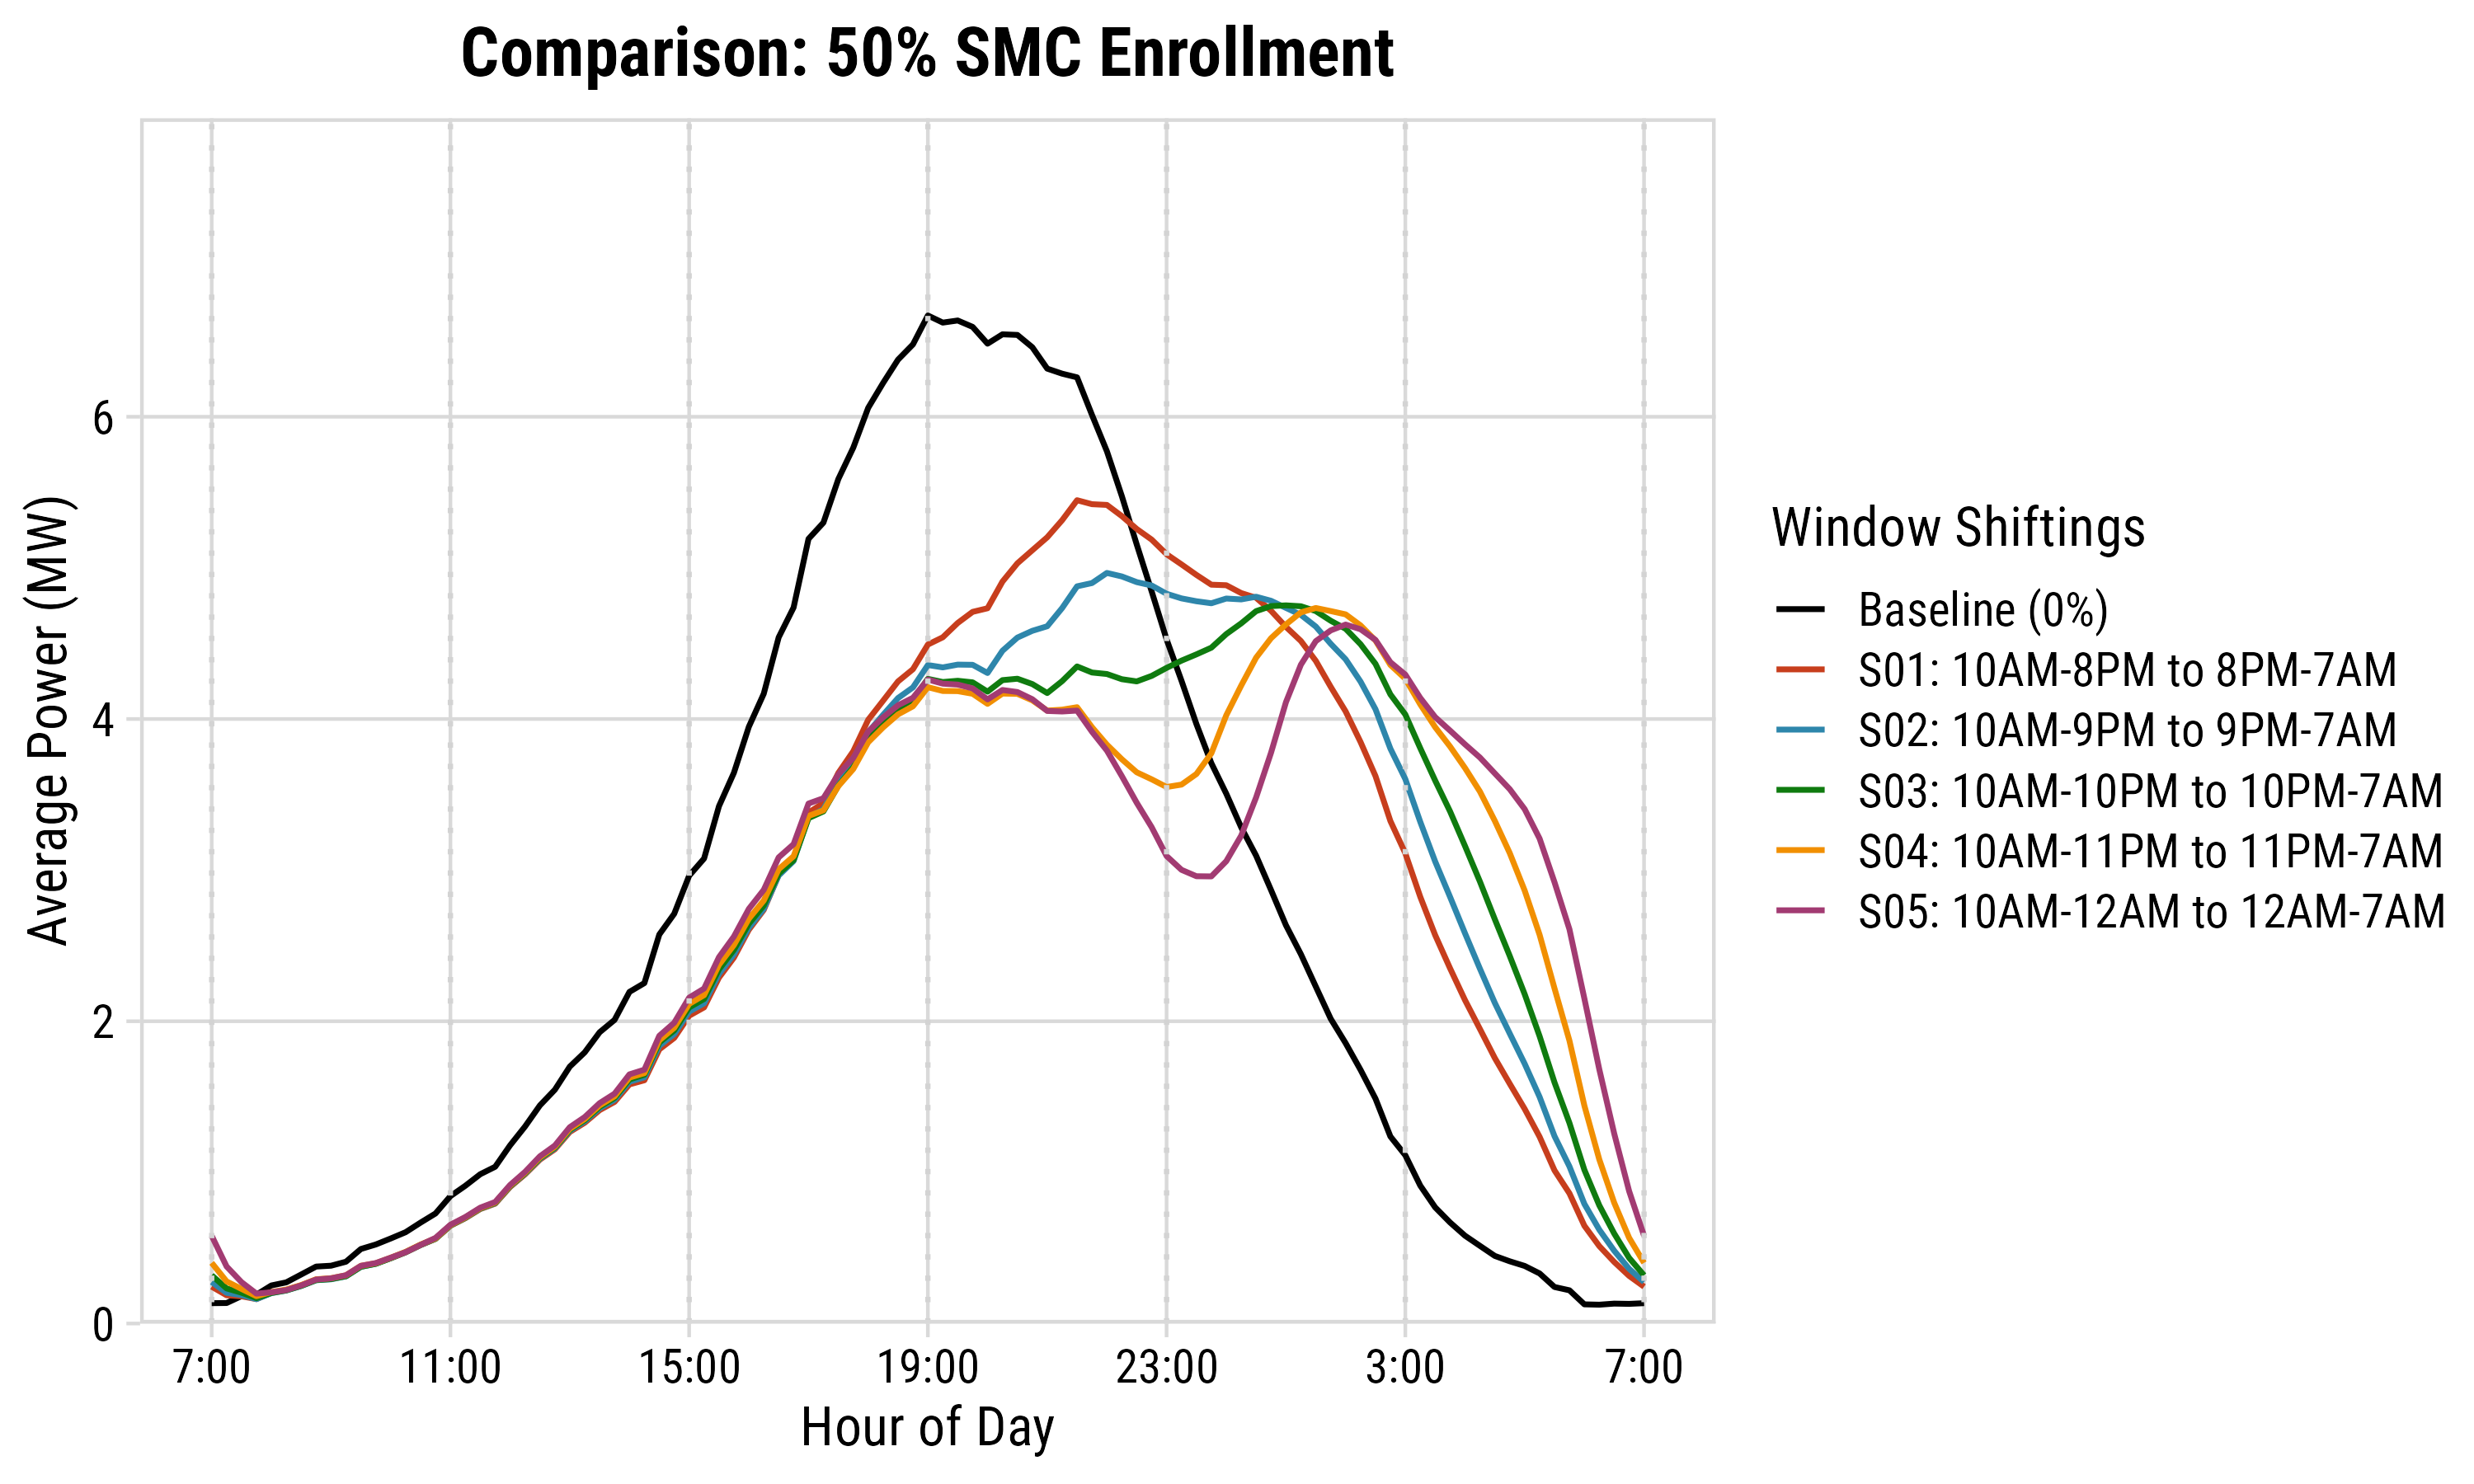
Five configurations with different peak/valley windows.
Step 3: Net Load + BEV & Peak Shaving
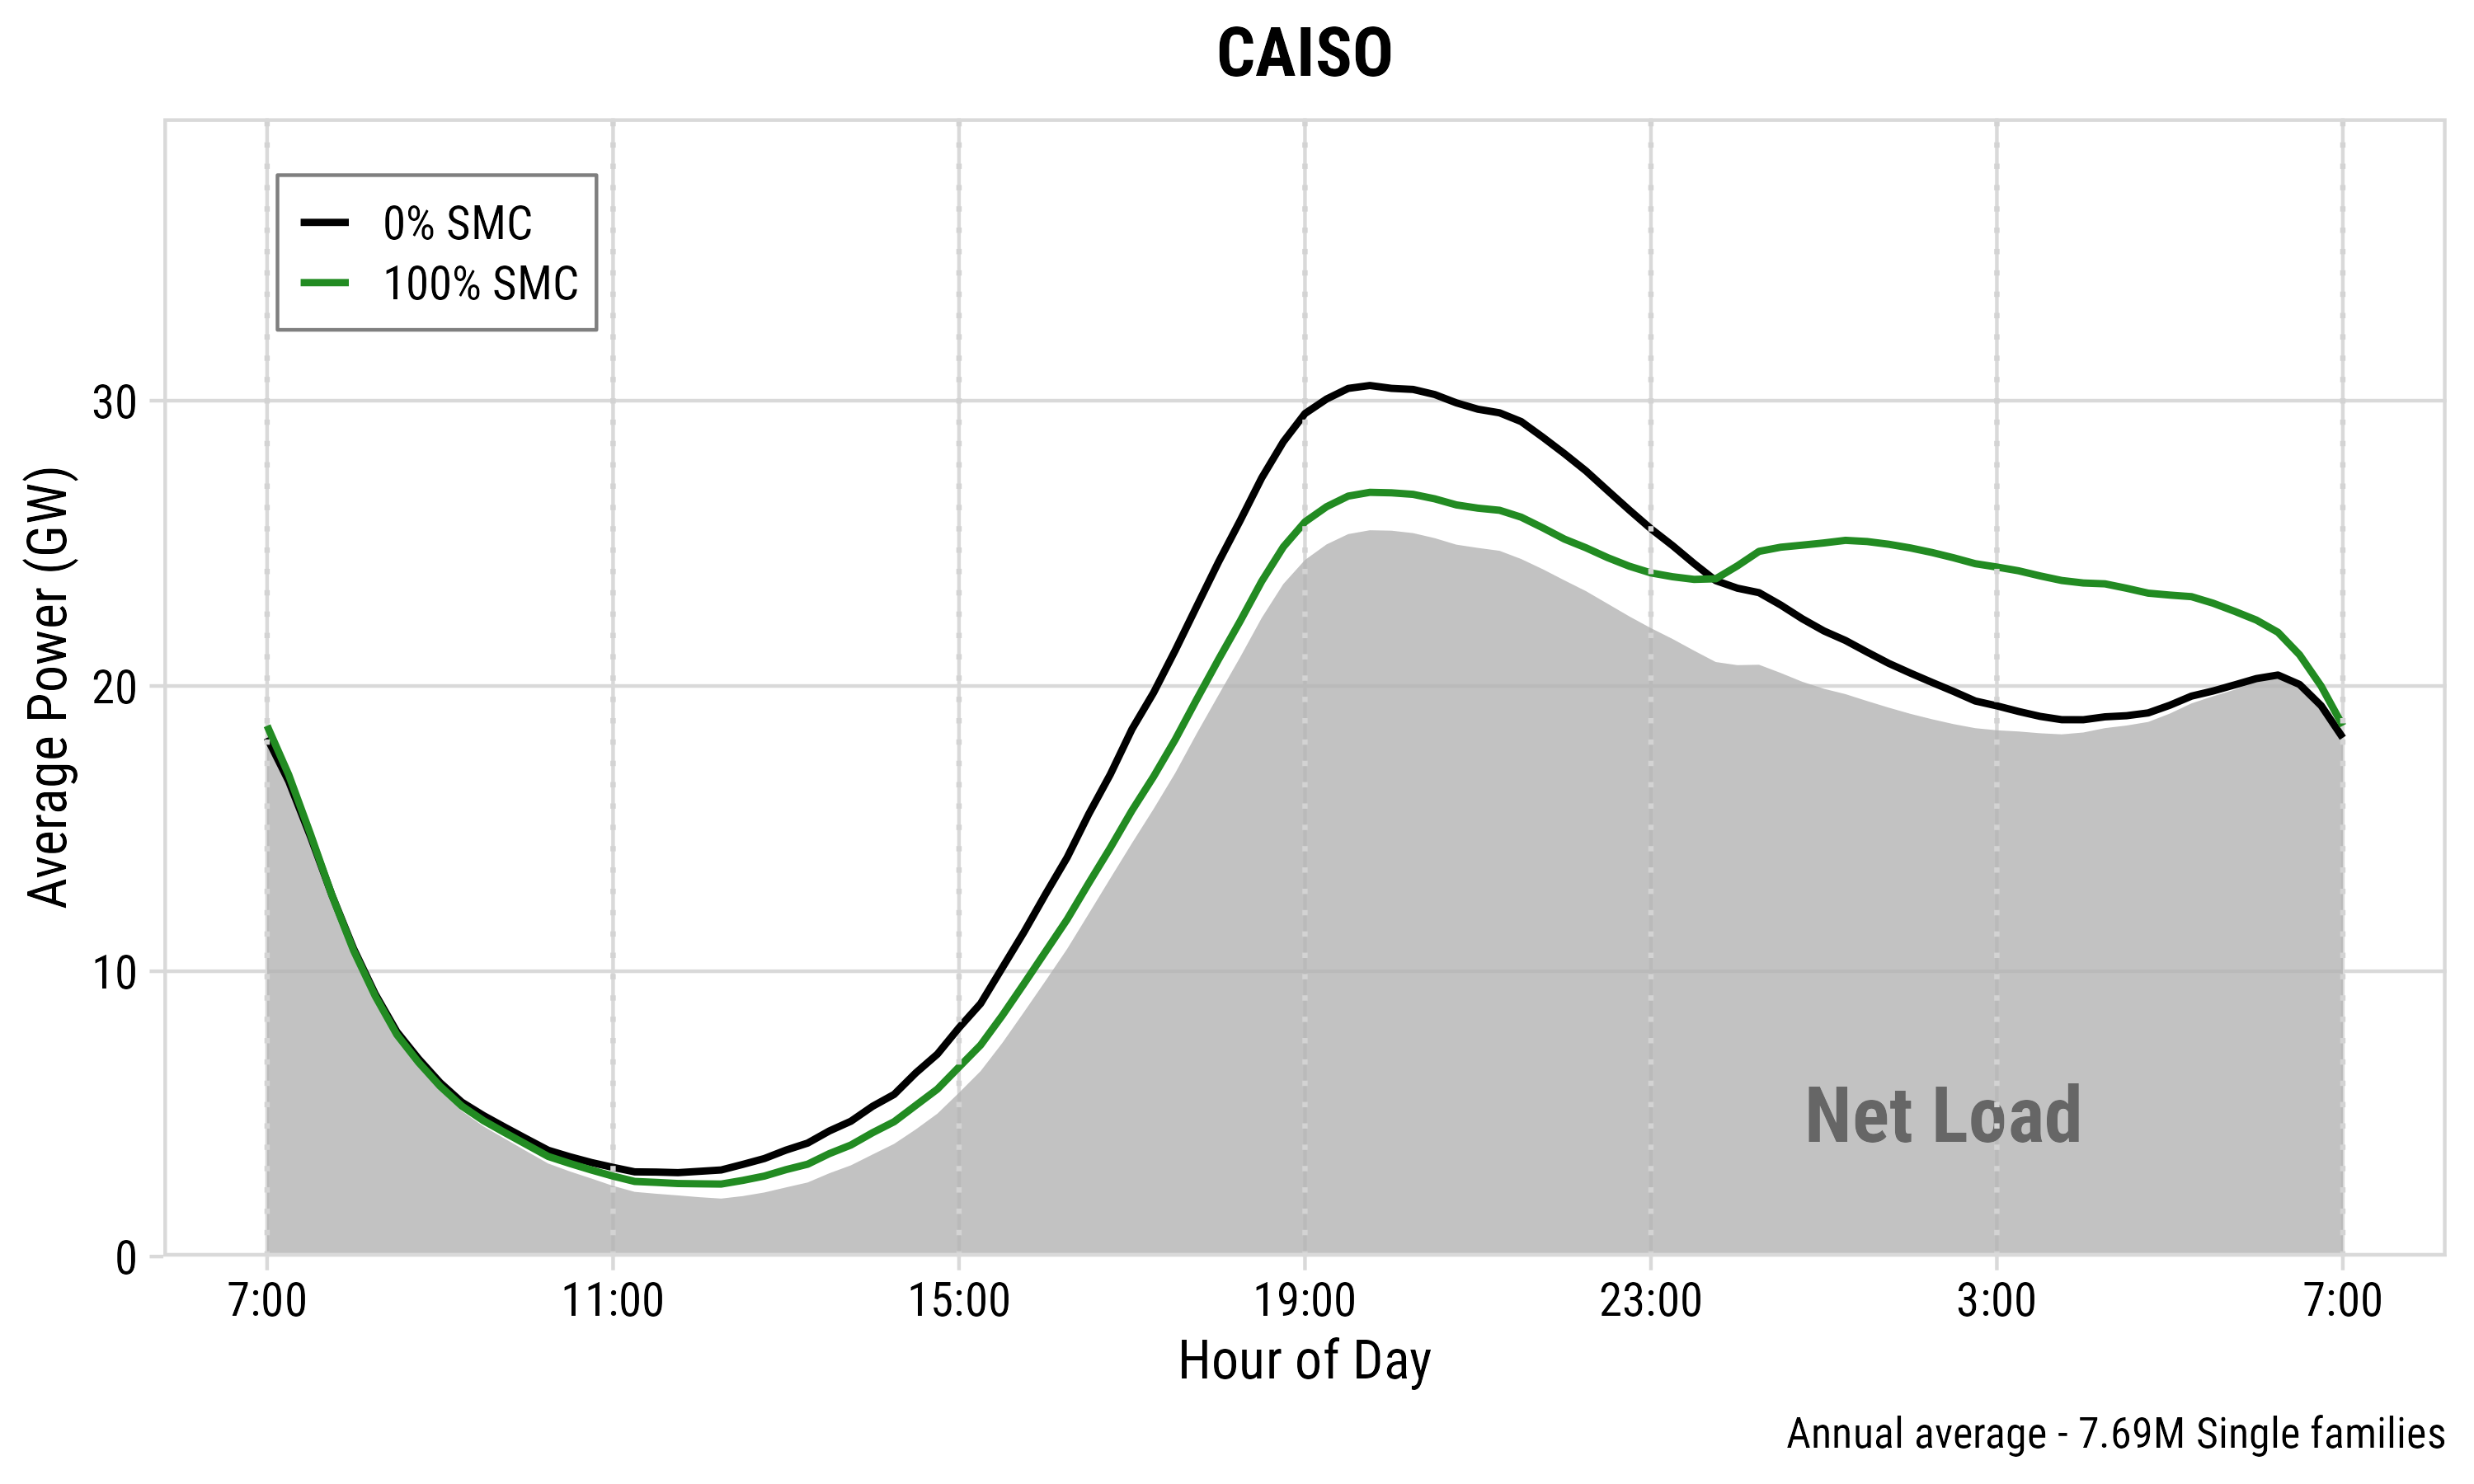
BEV load scaled to fleet size and stacked on net load.
Enrollment Curve from Prior Stage
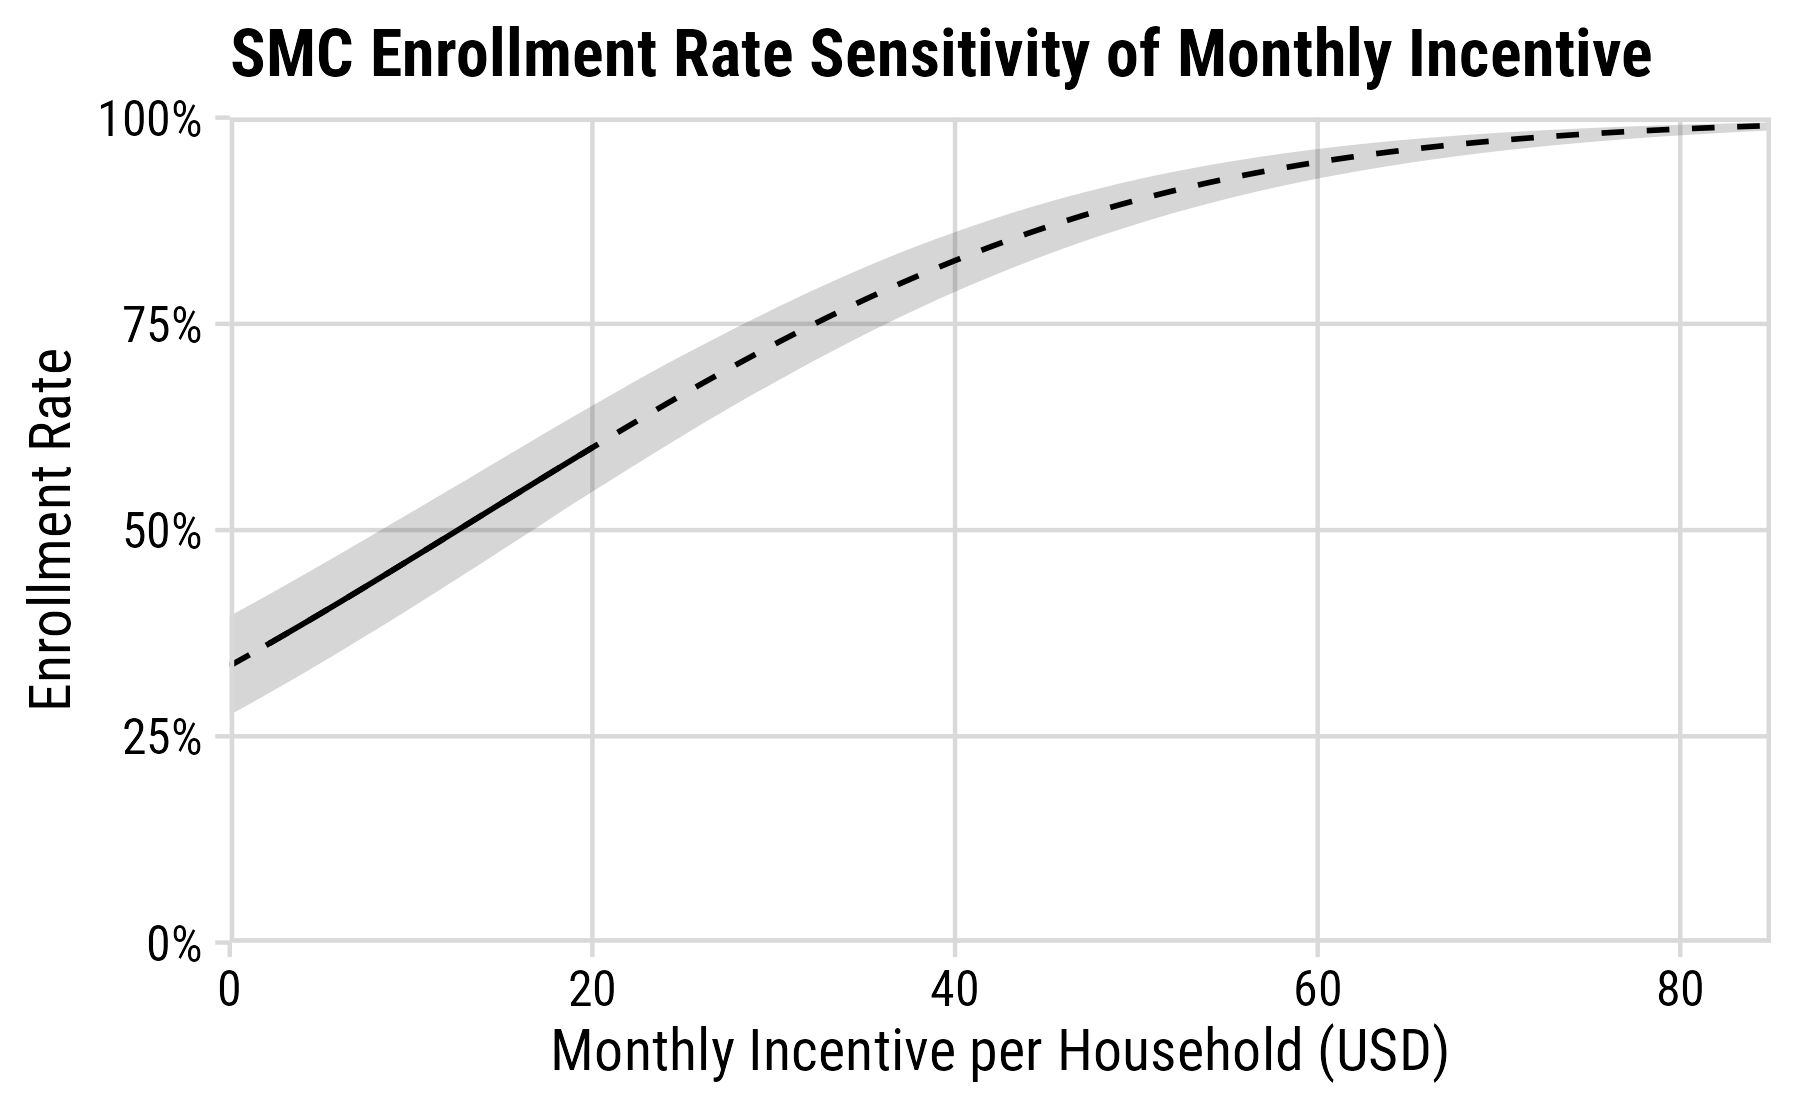
Mixed logit prediction based on 1,356 real BEV owners.
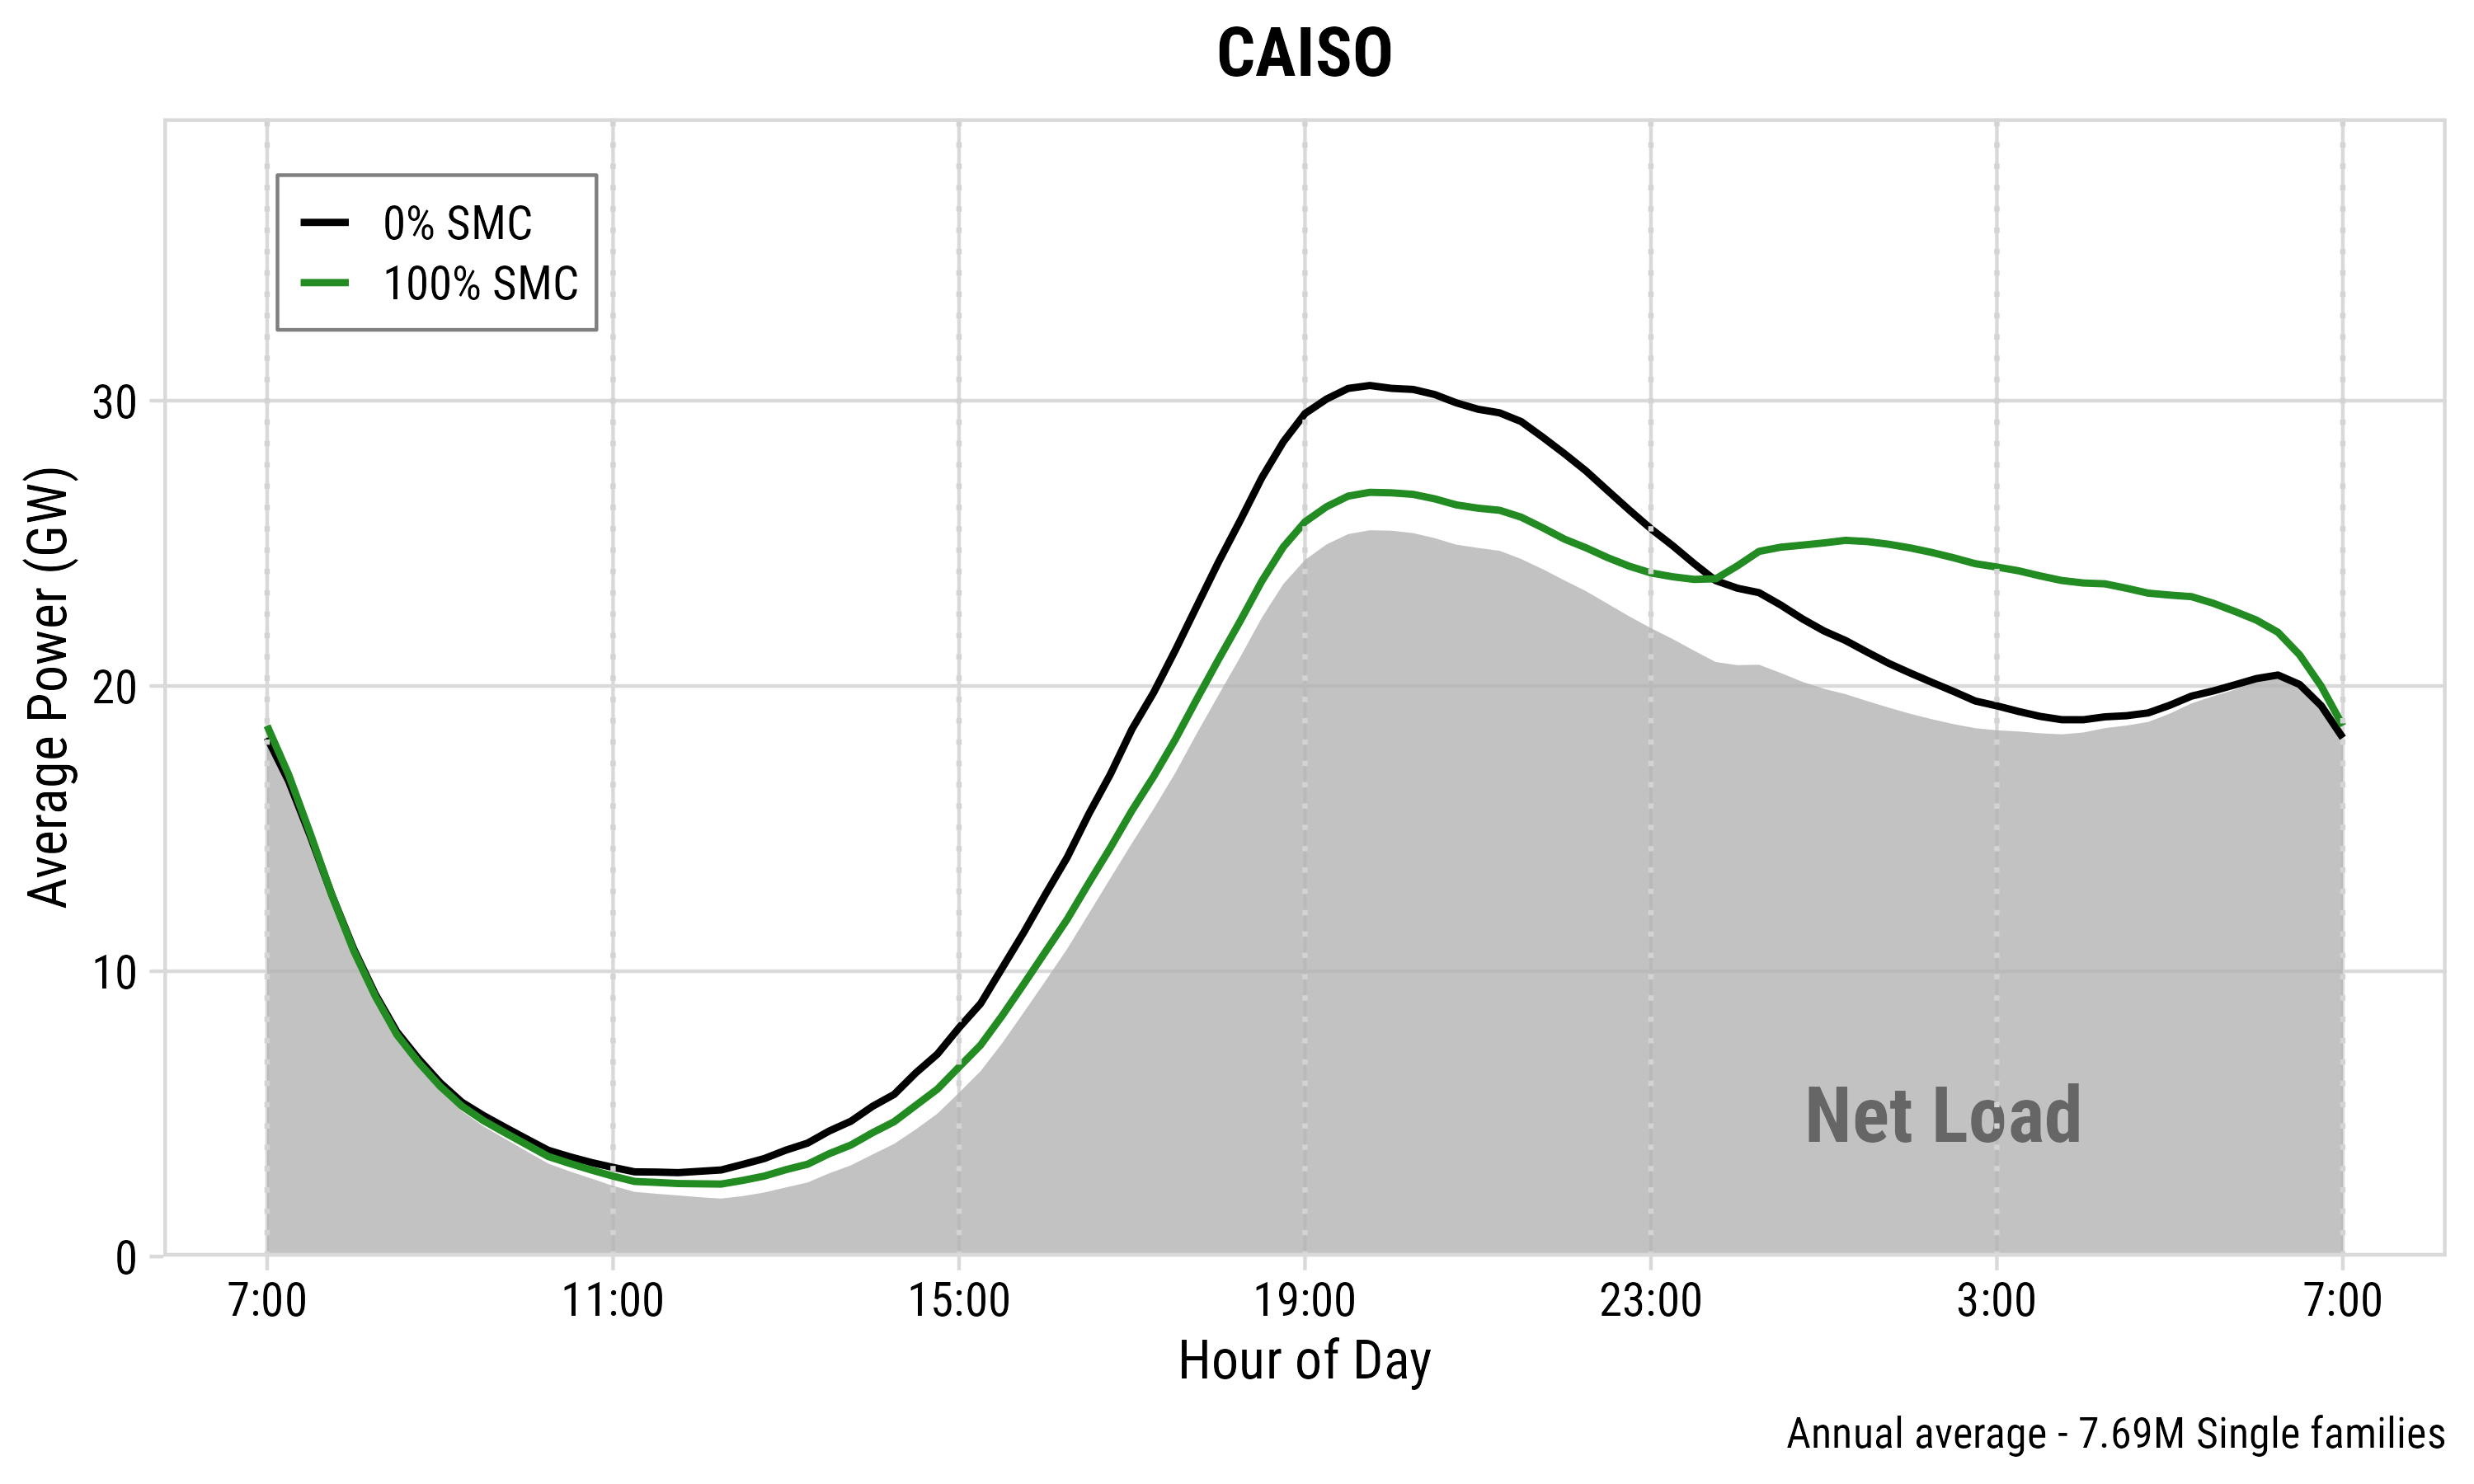
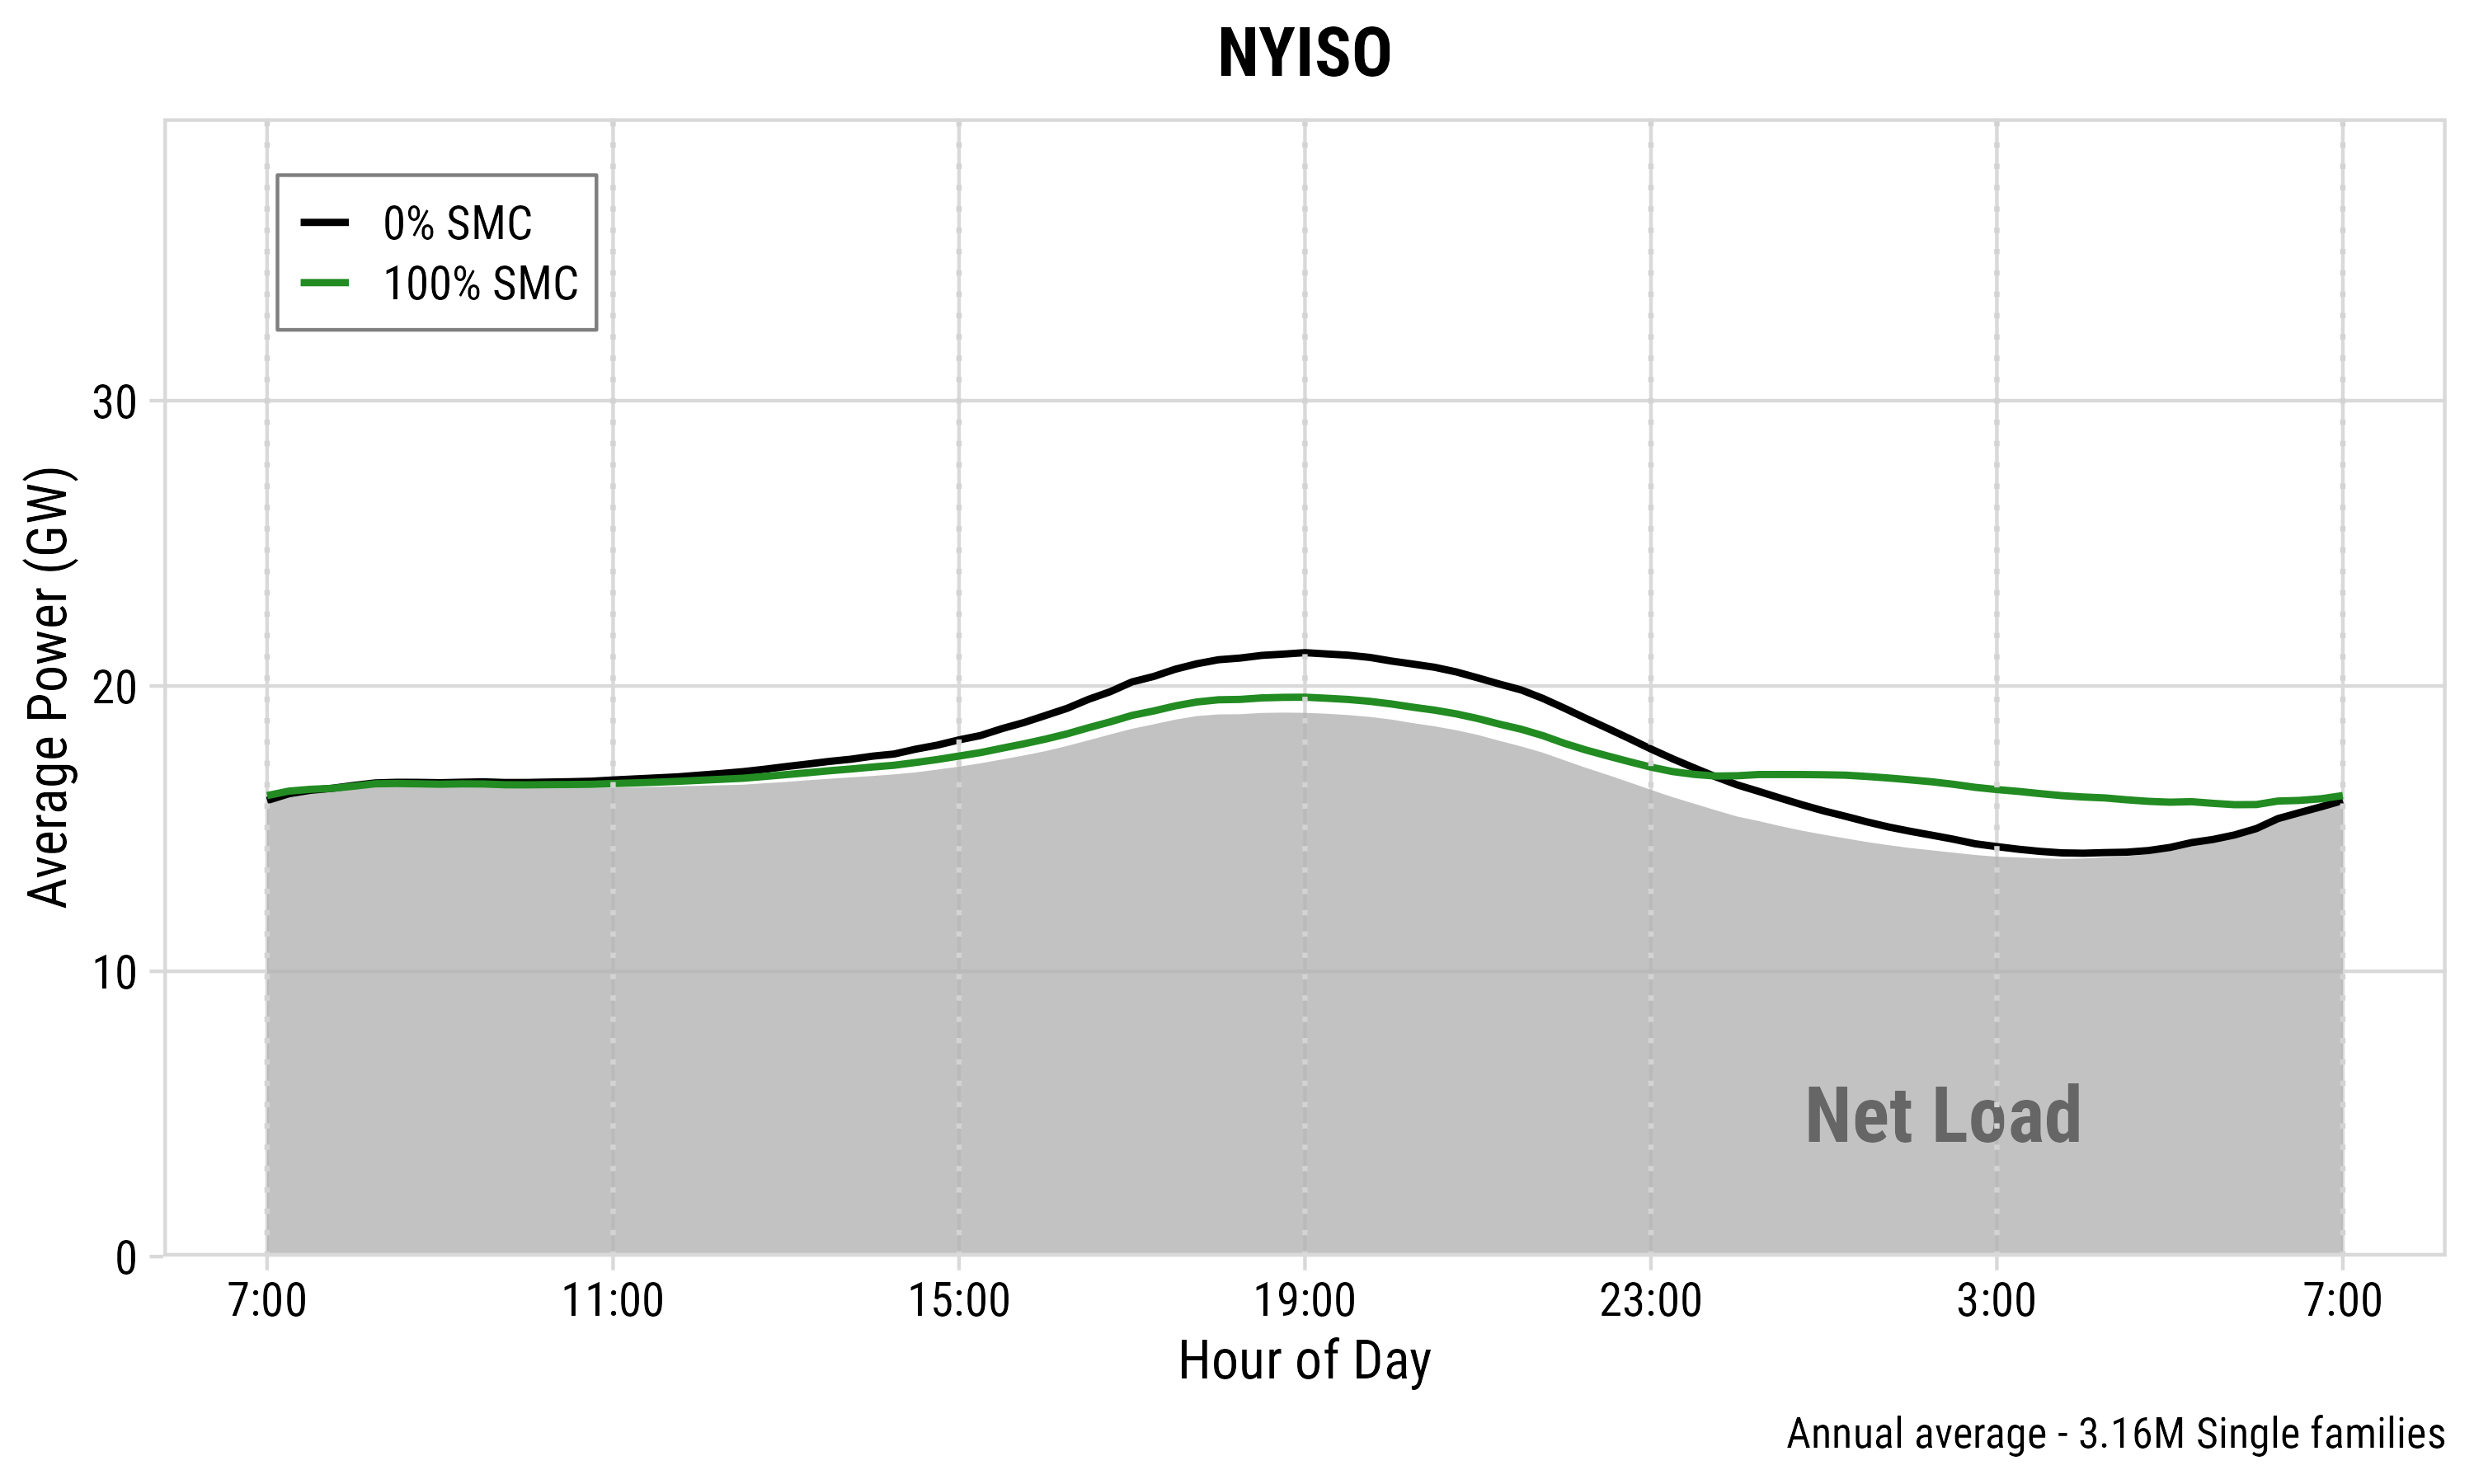
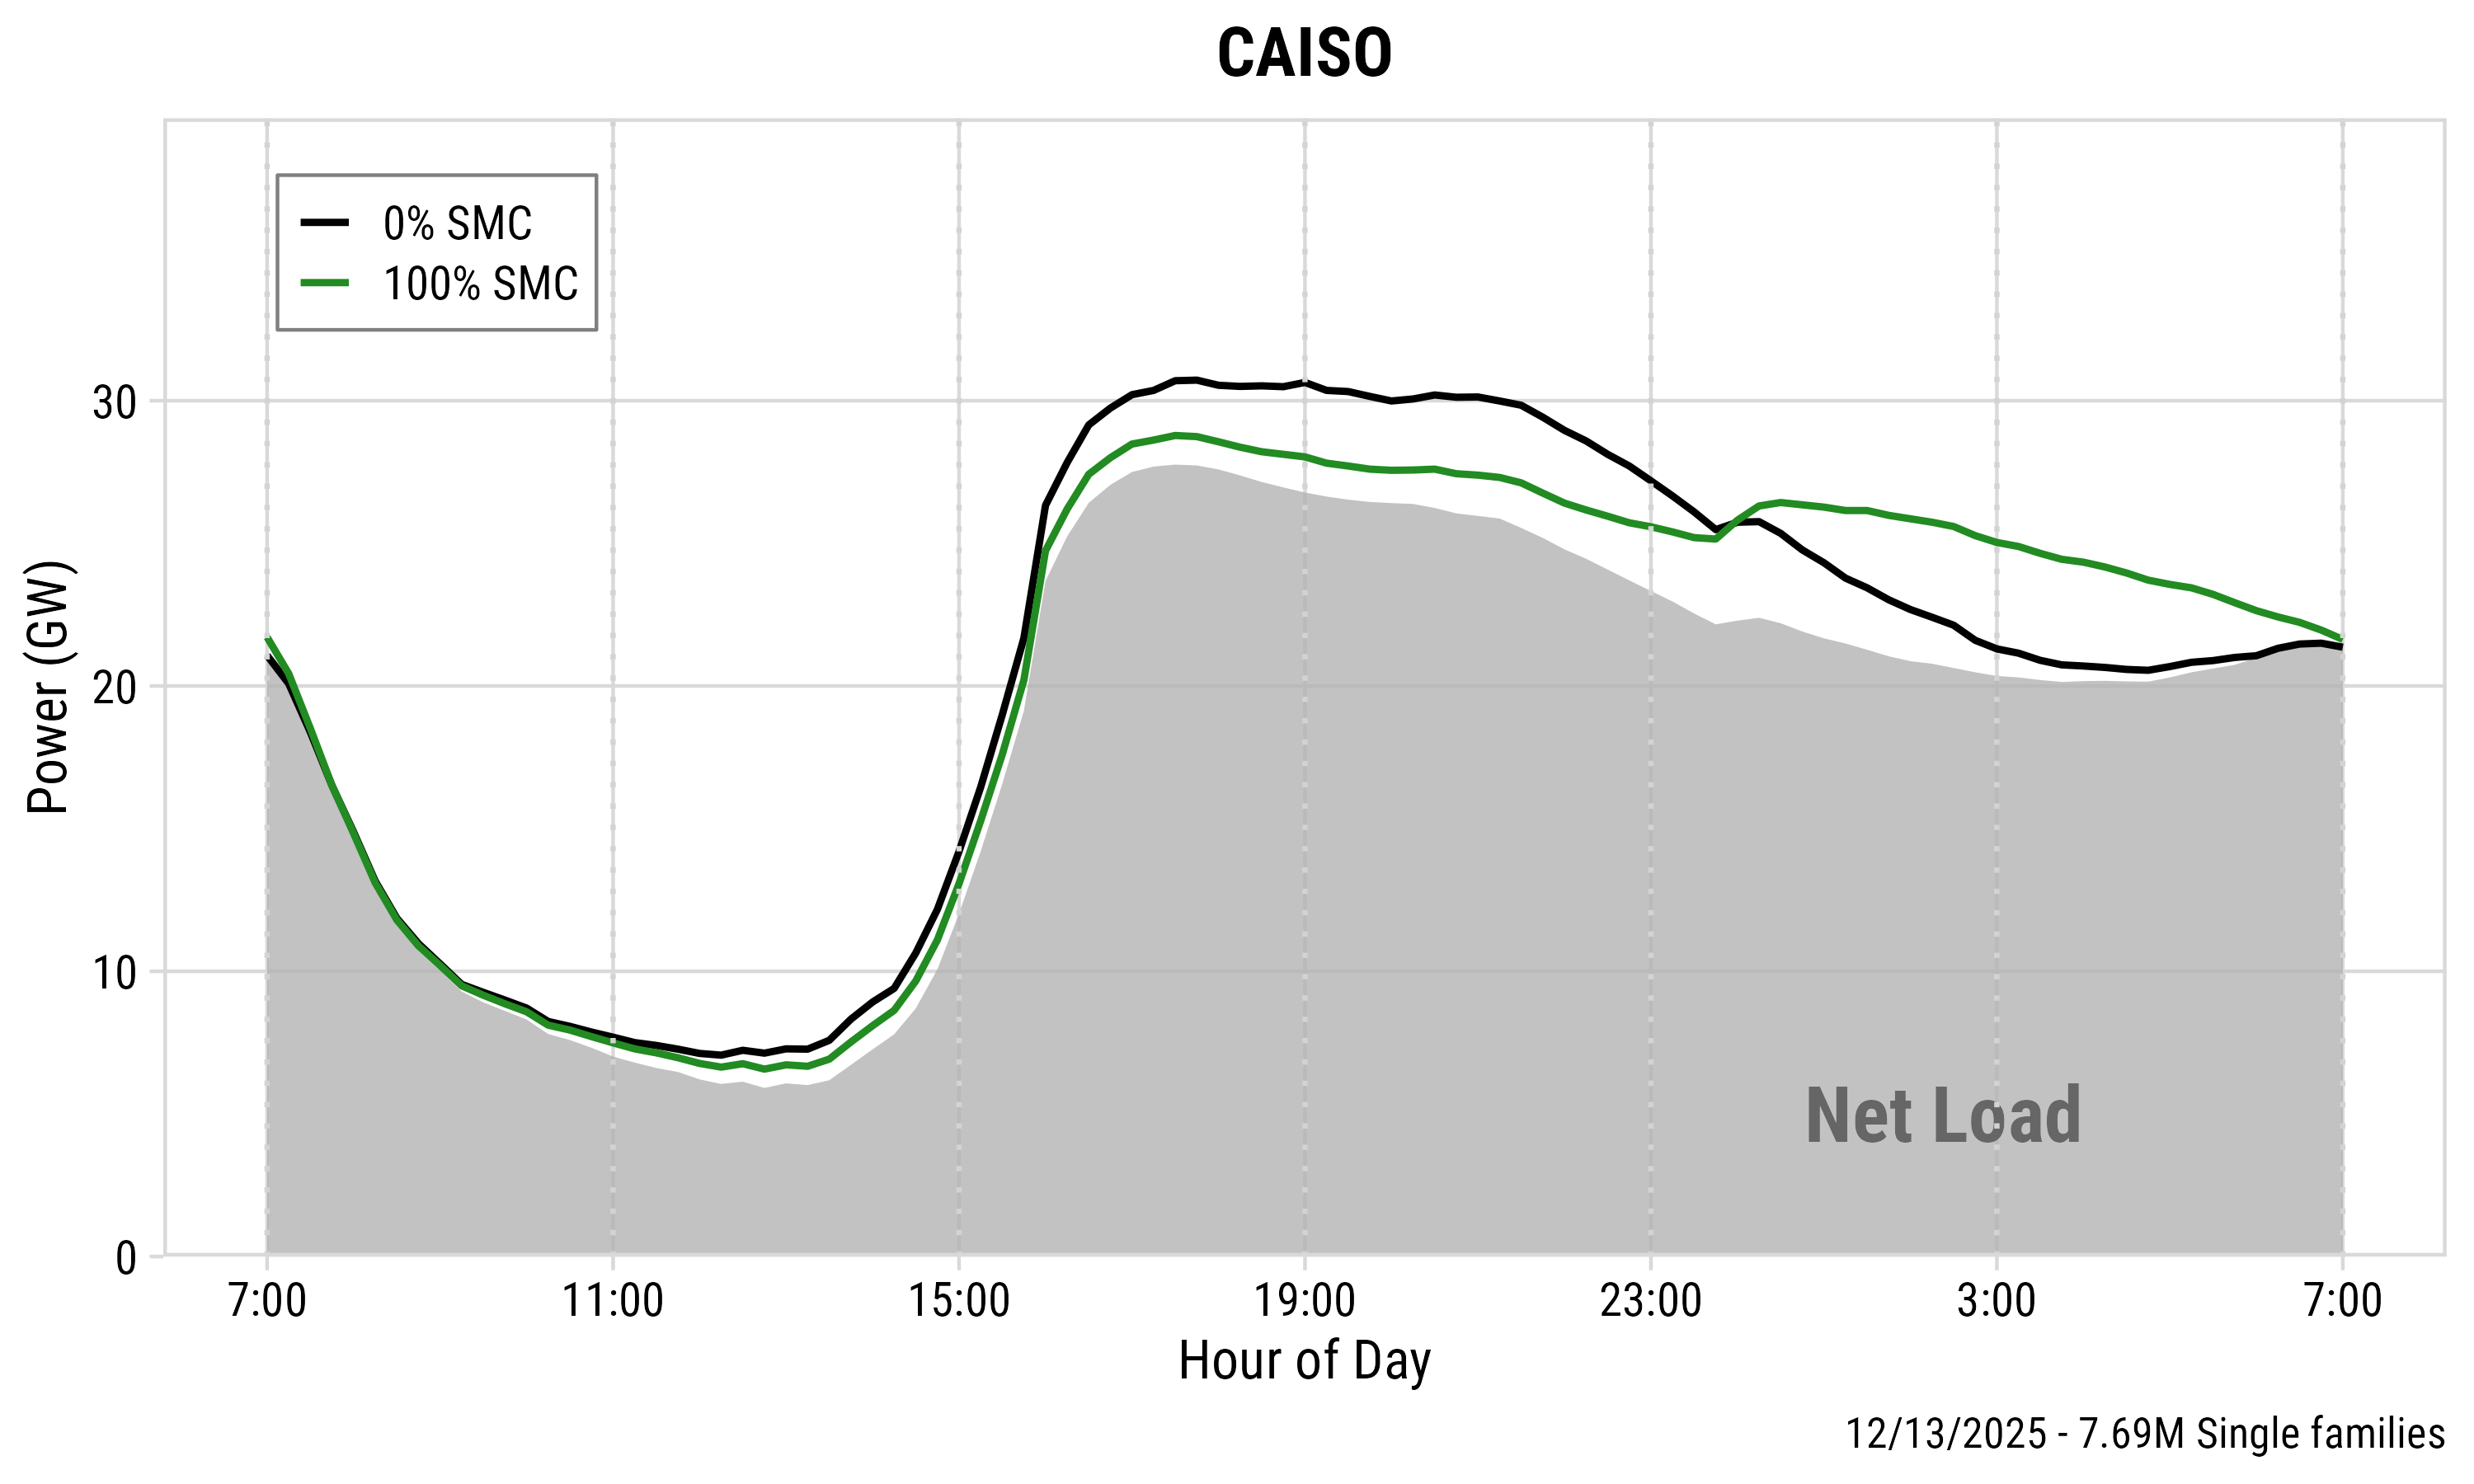
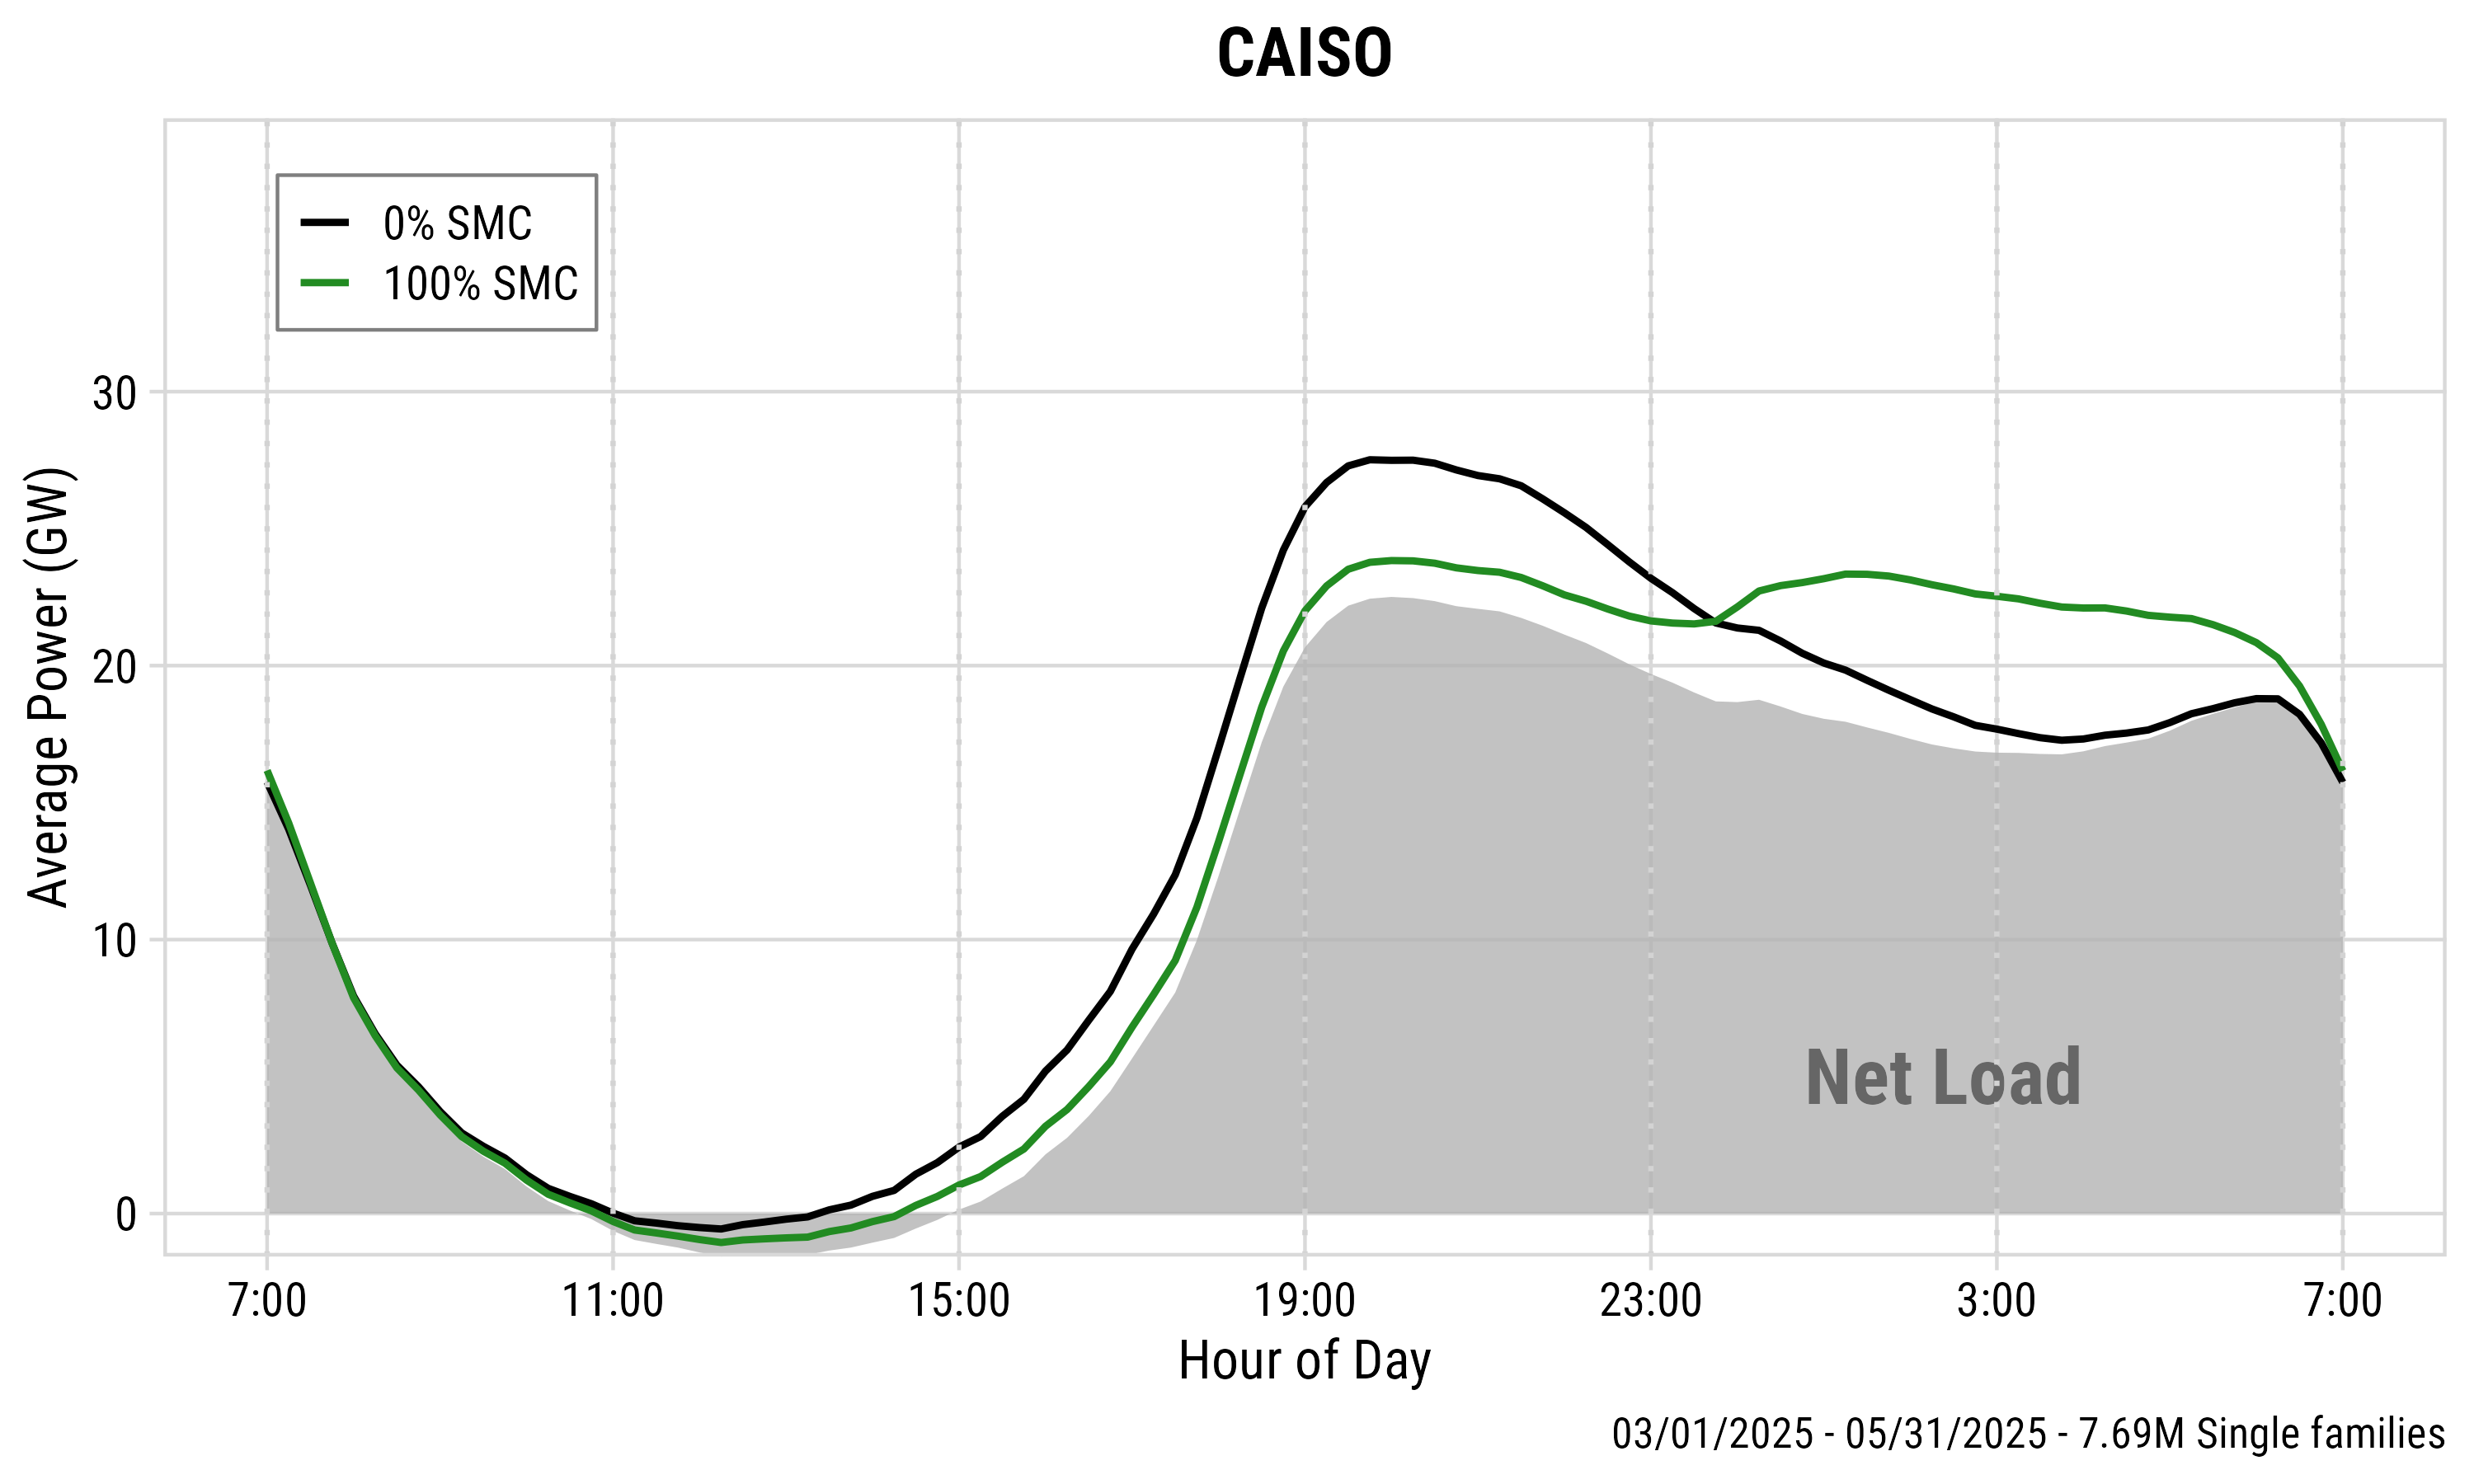
Peak Shaving: Annual Average
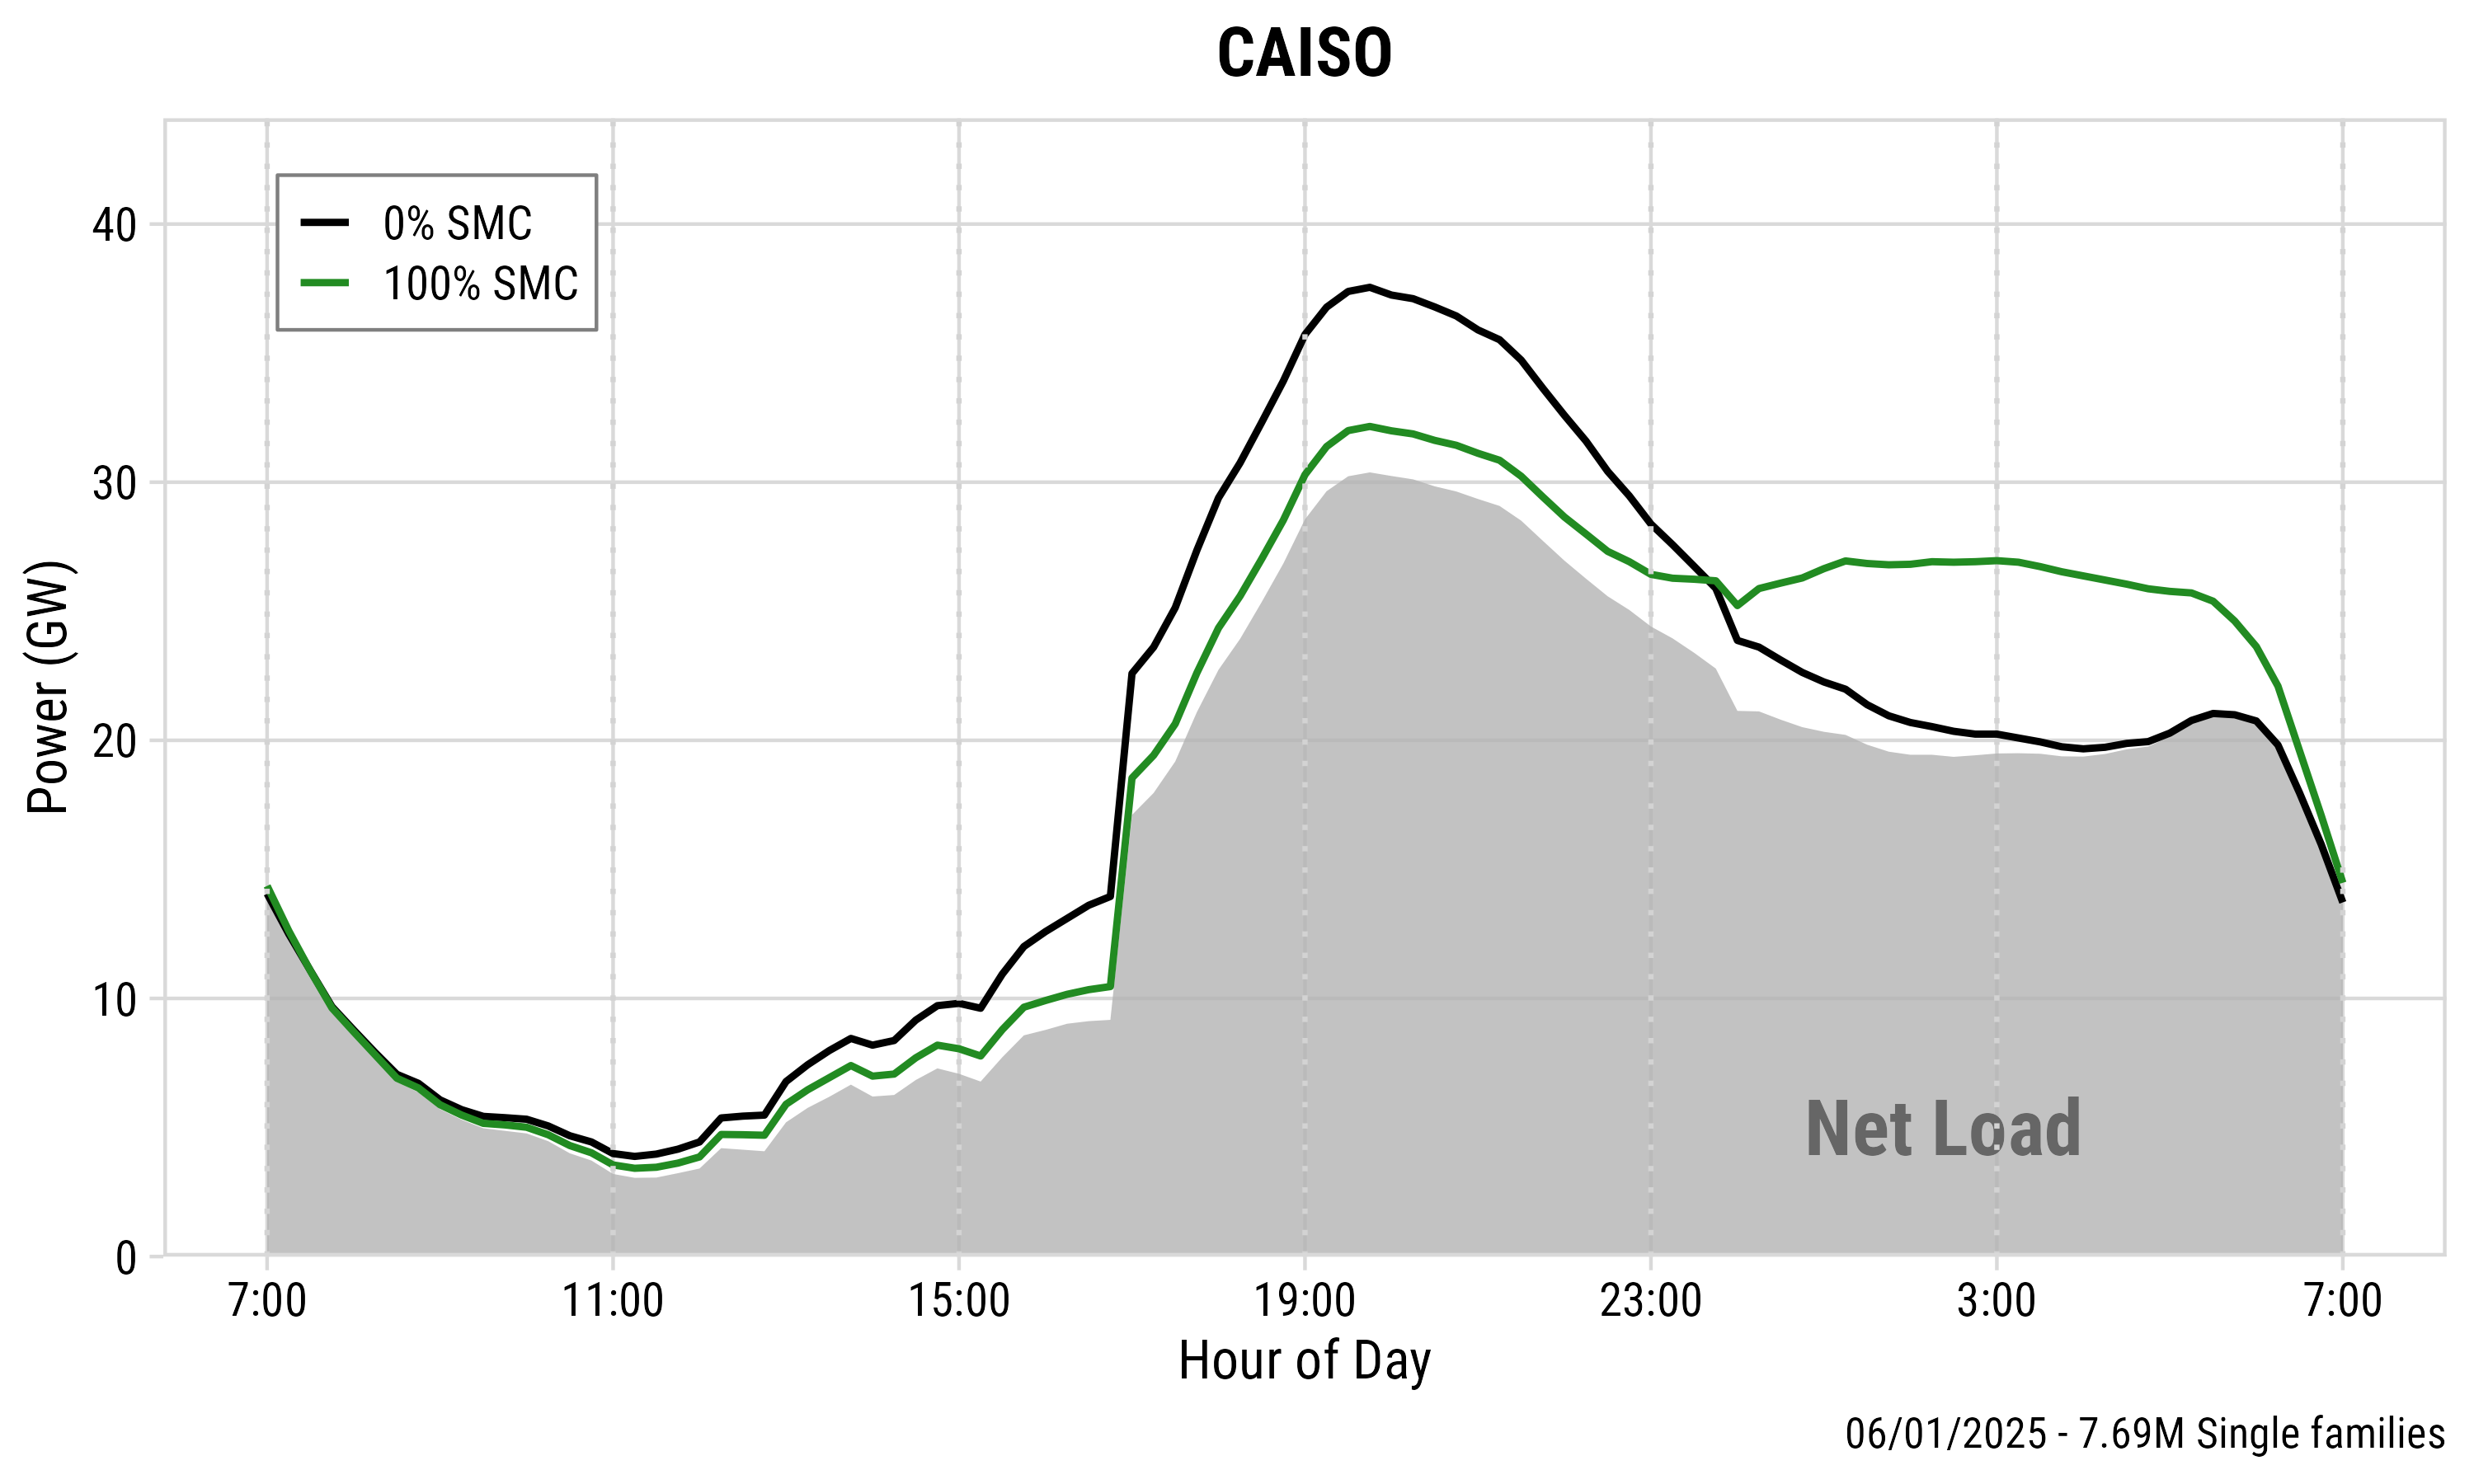
Peak Shaving: CAISO Extreme Days
Peak Shaving: NYISO Extreme Days
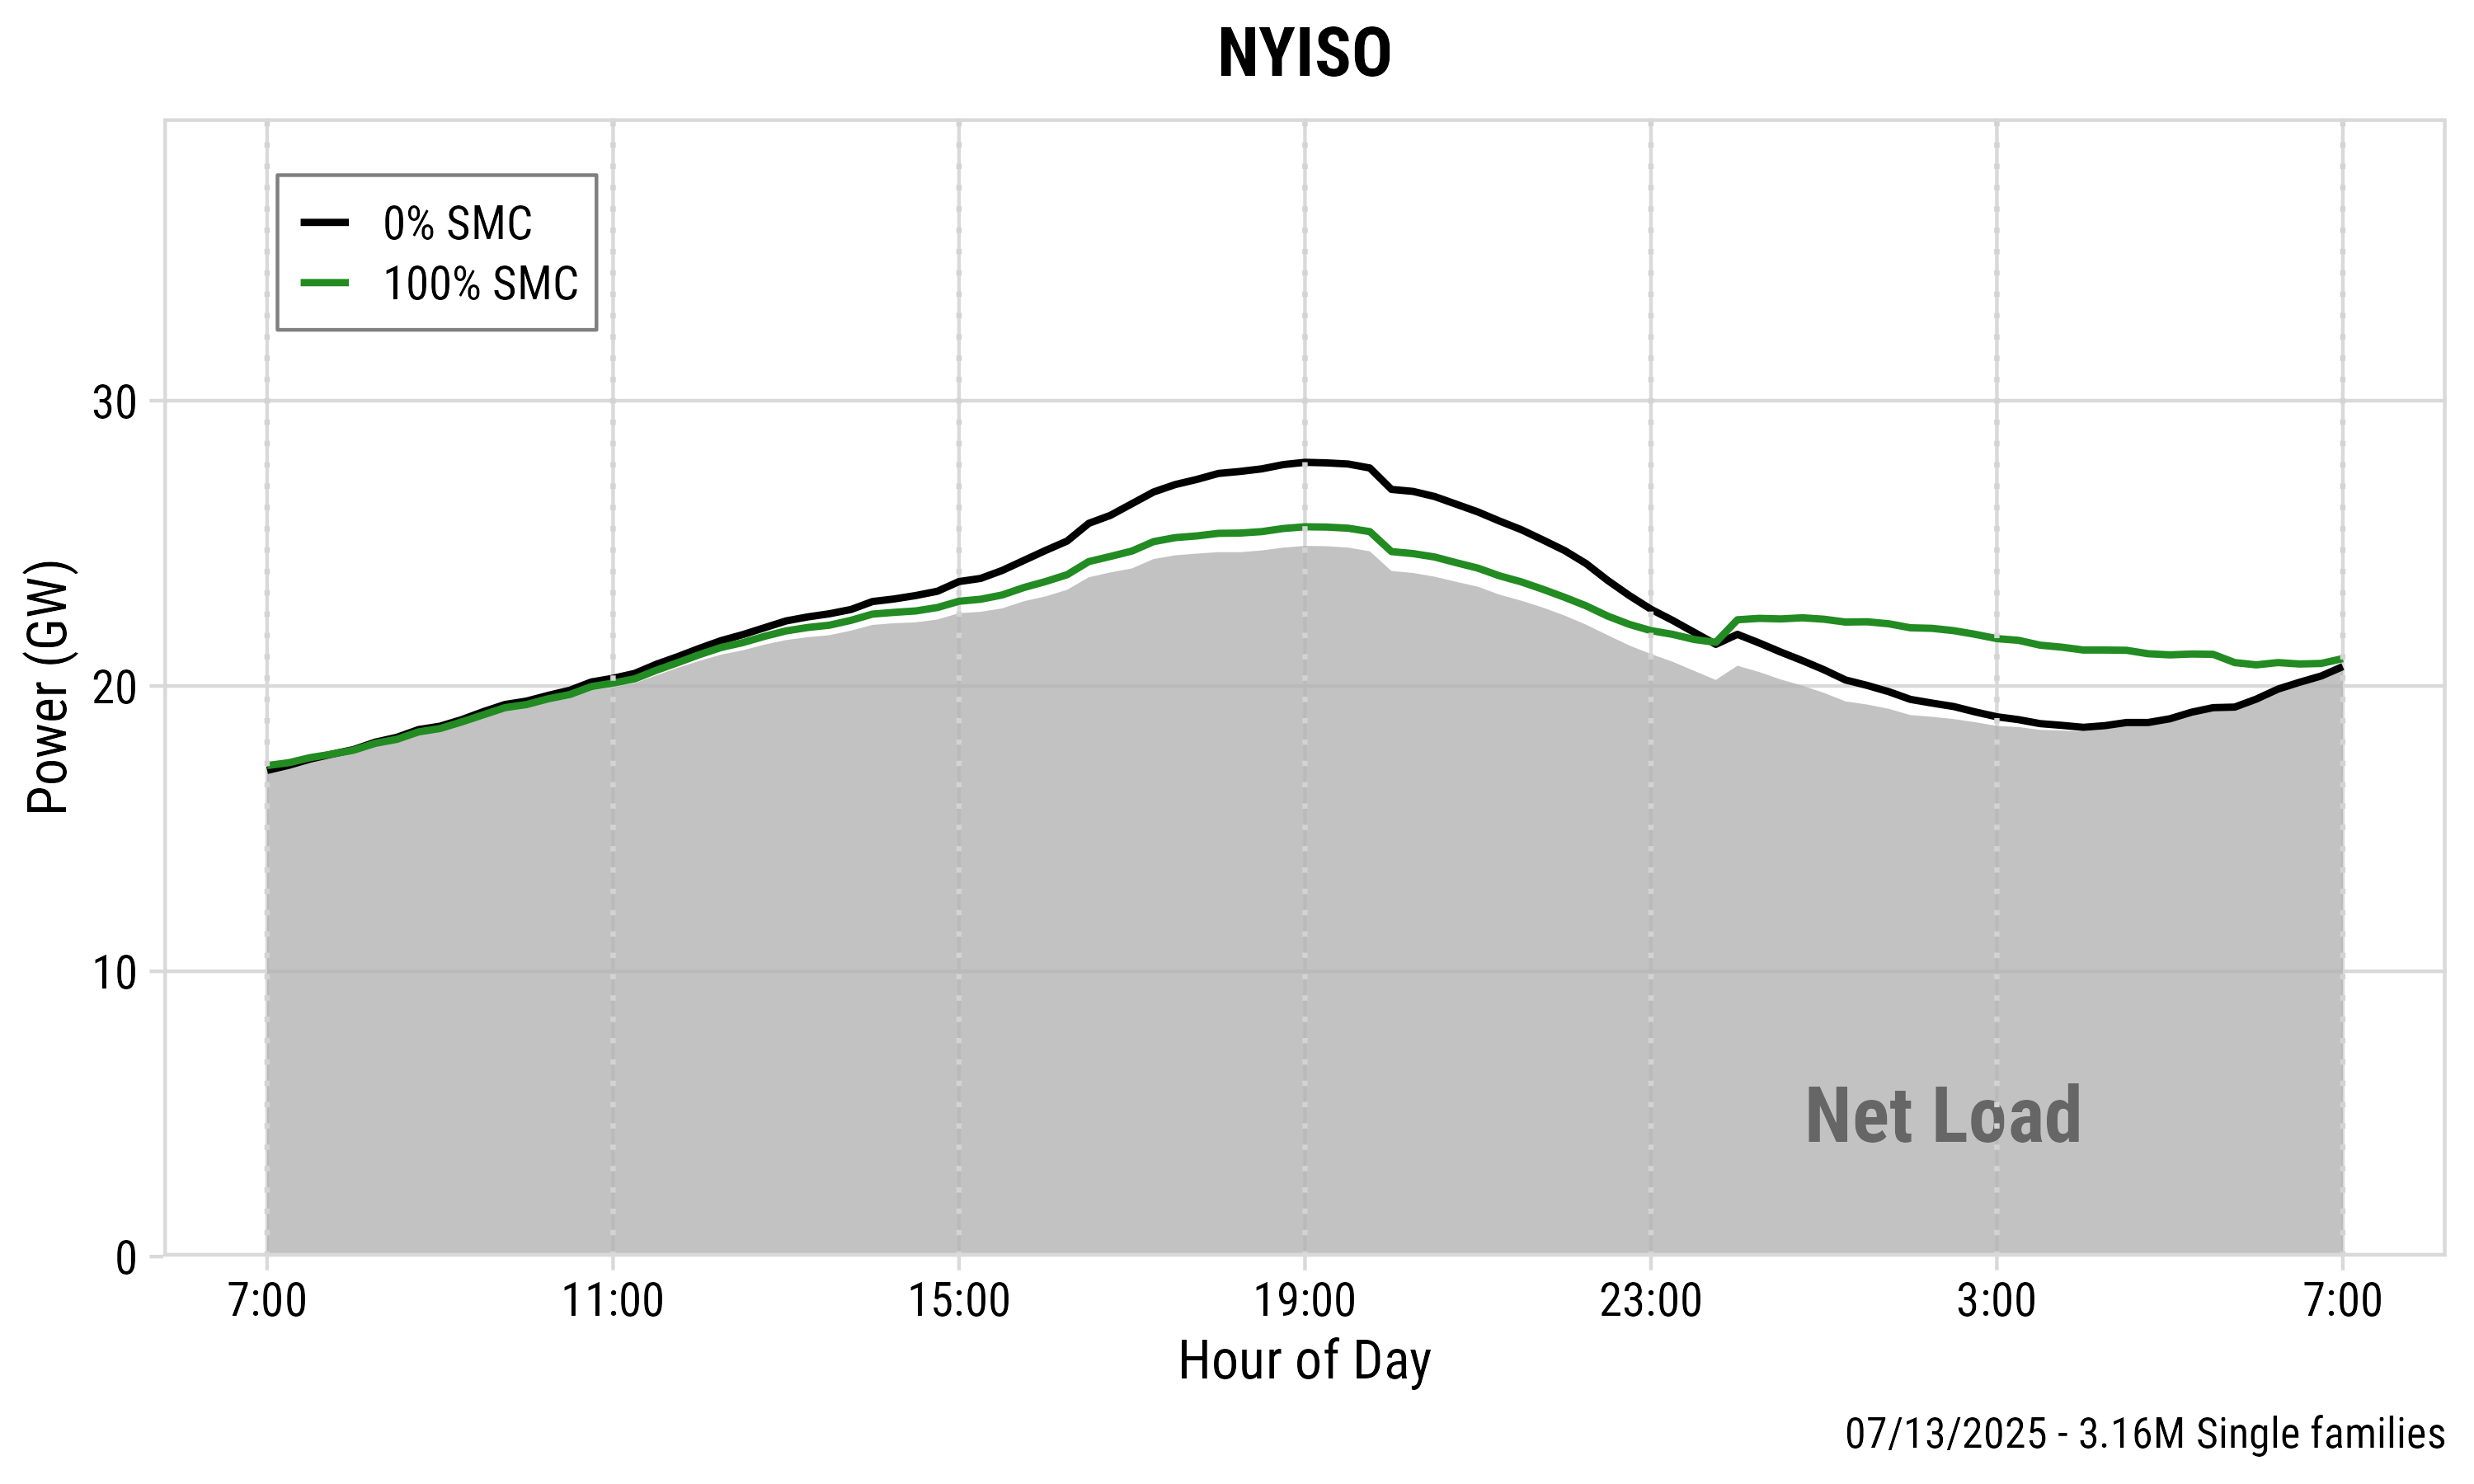
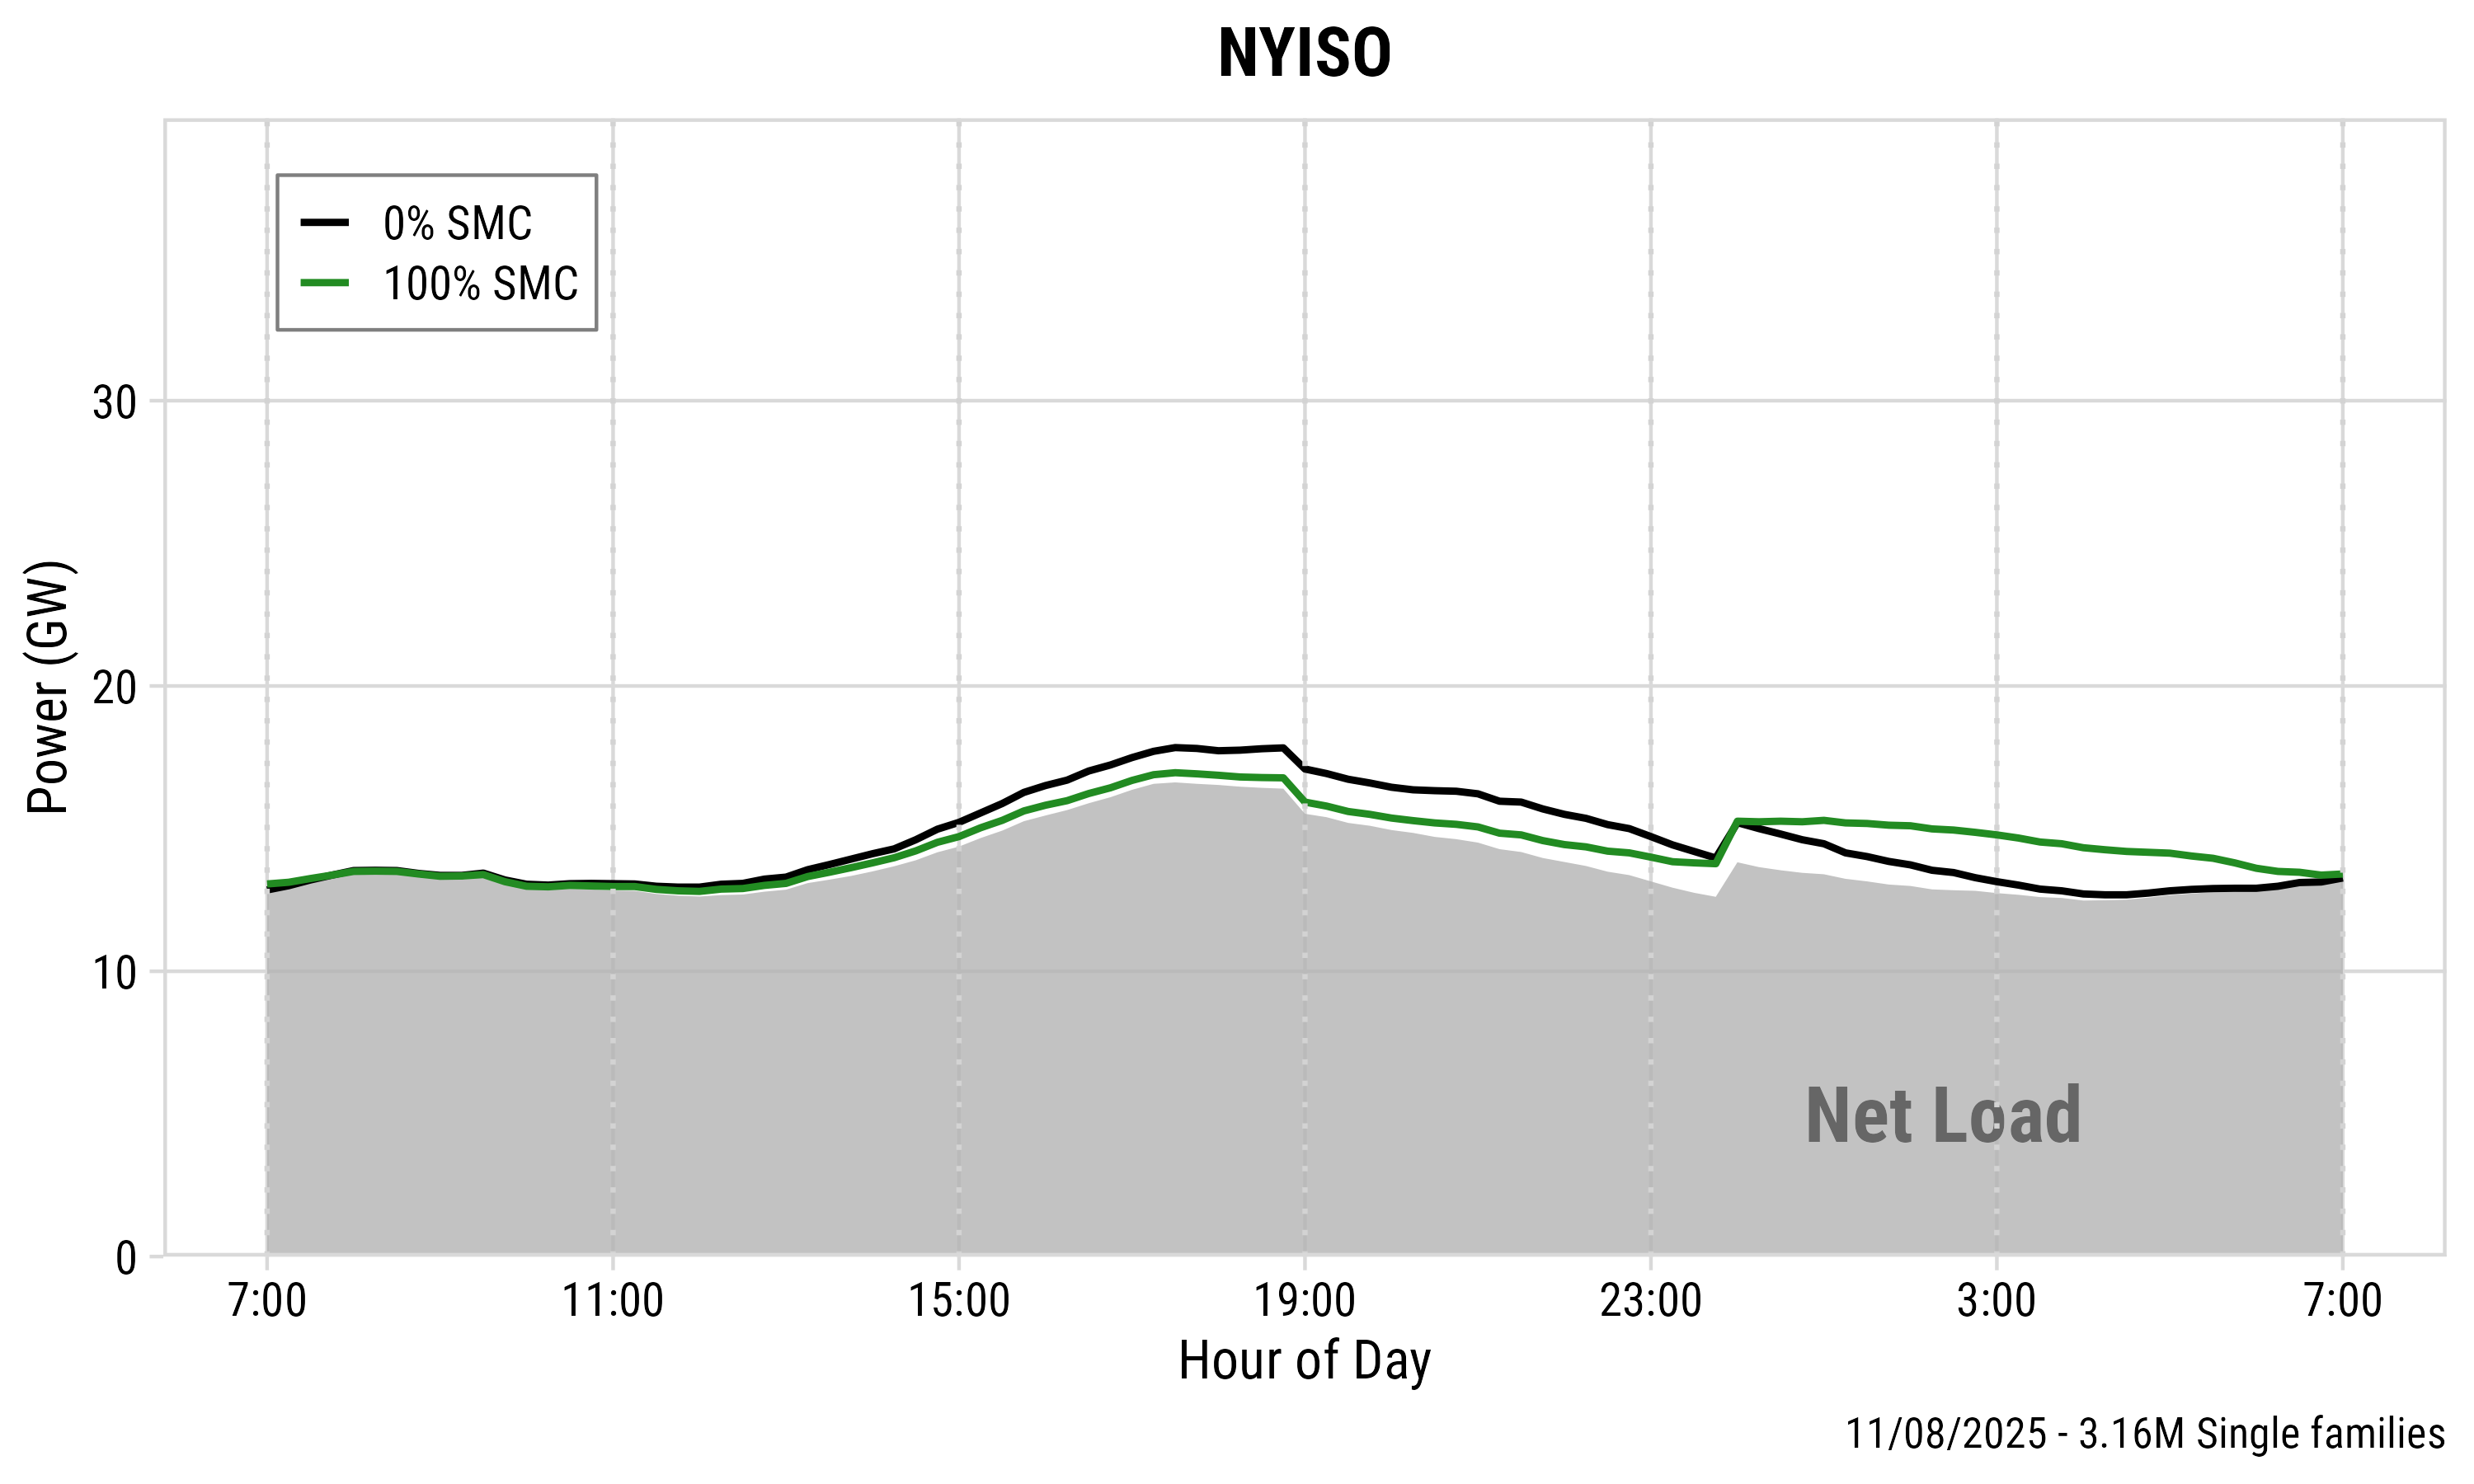
Peak from BEV charging decreases with higher enrollment
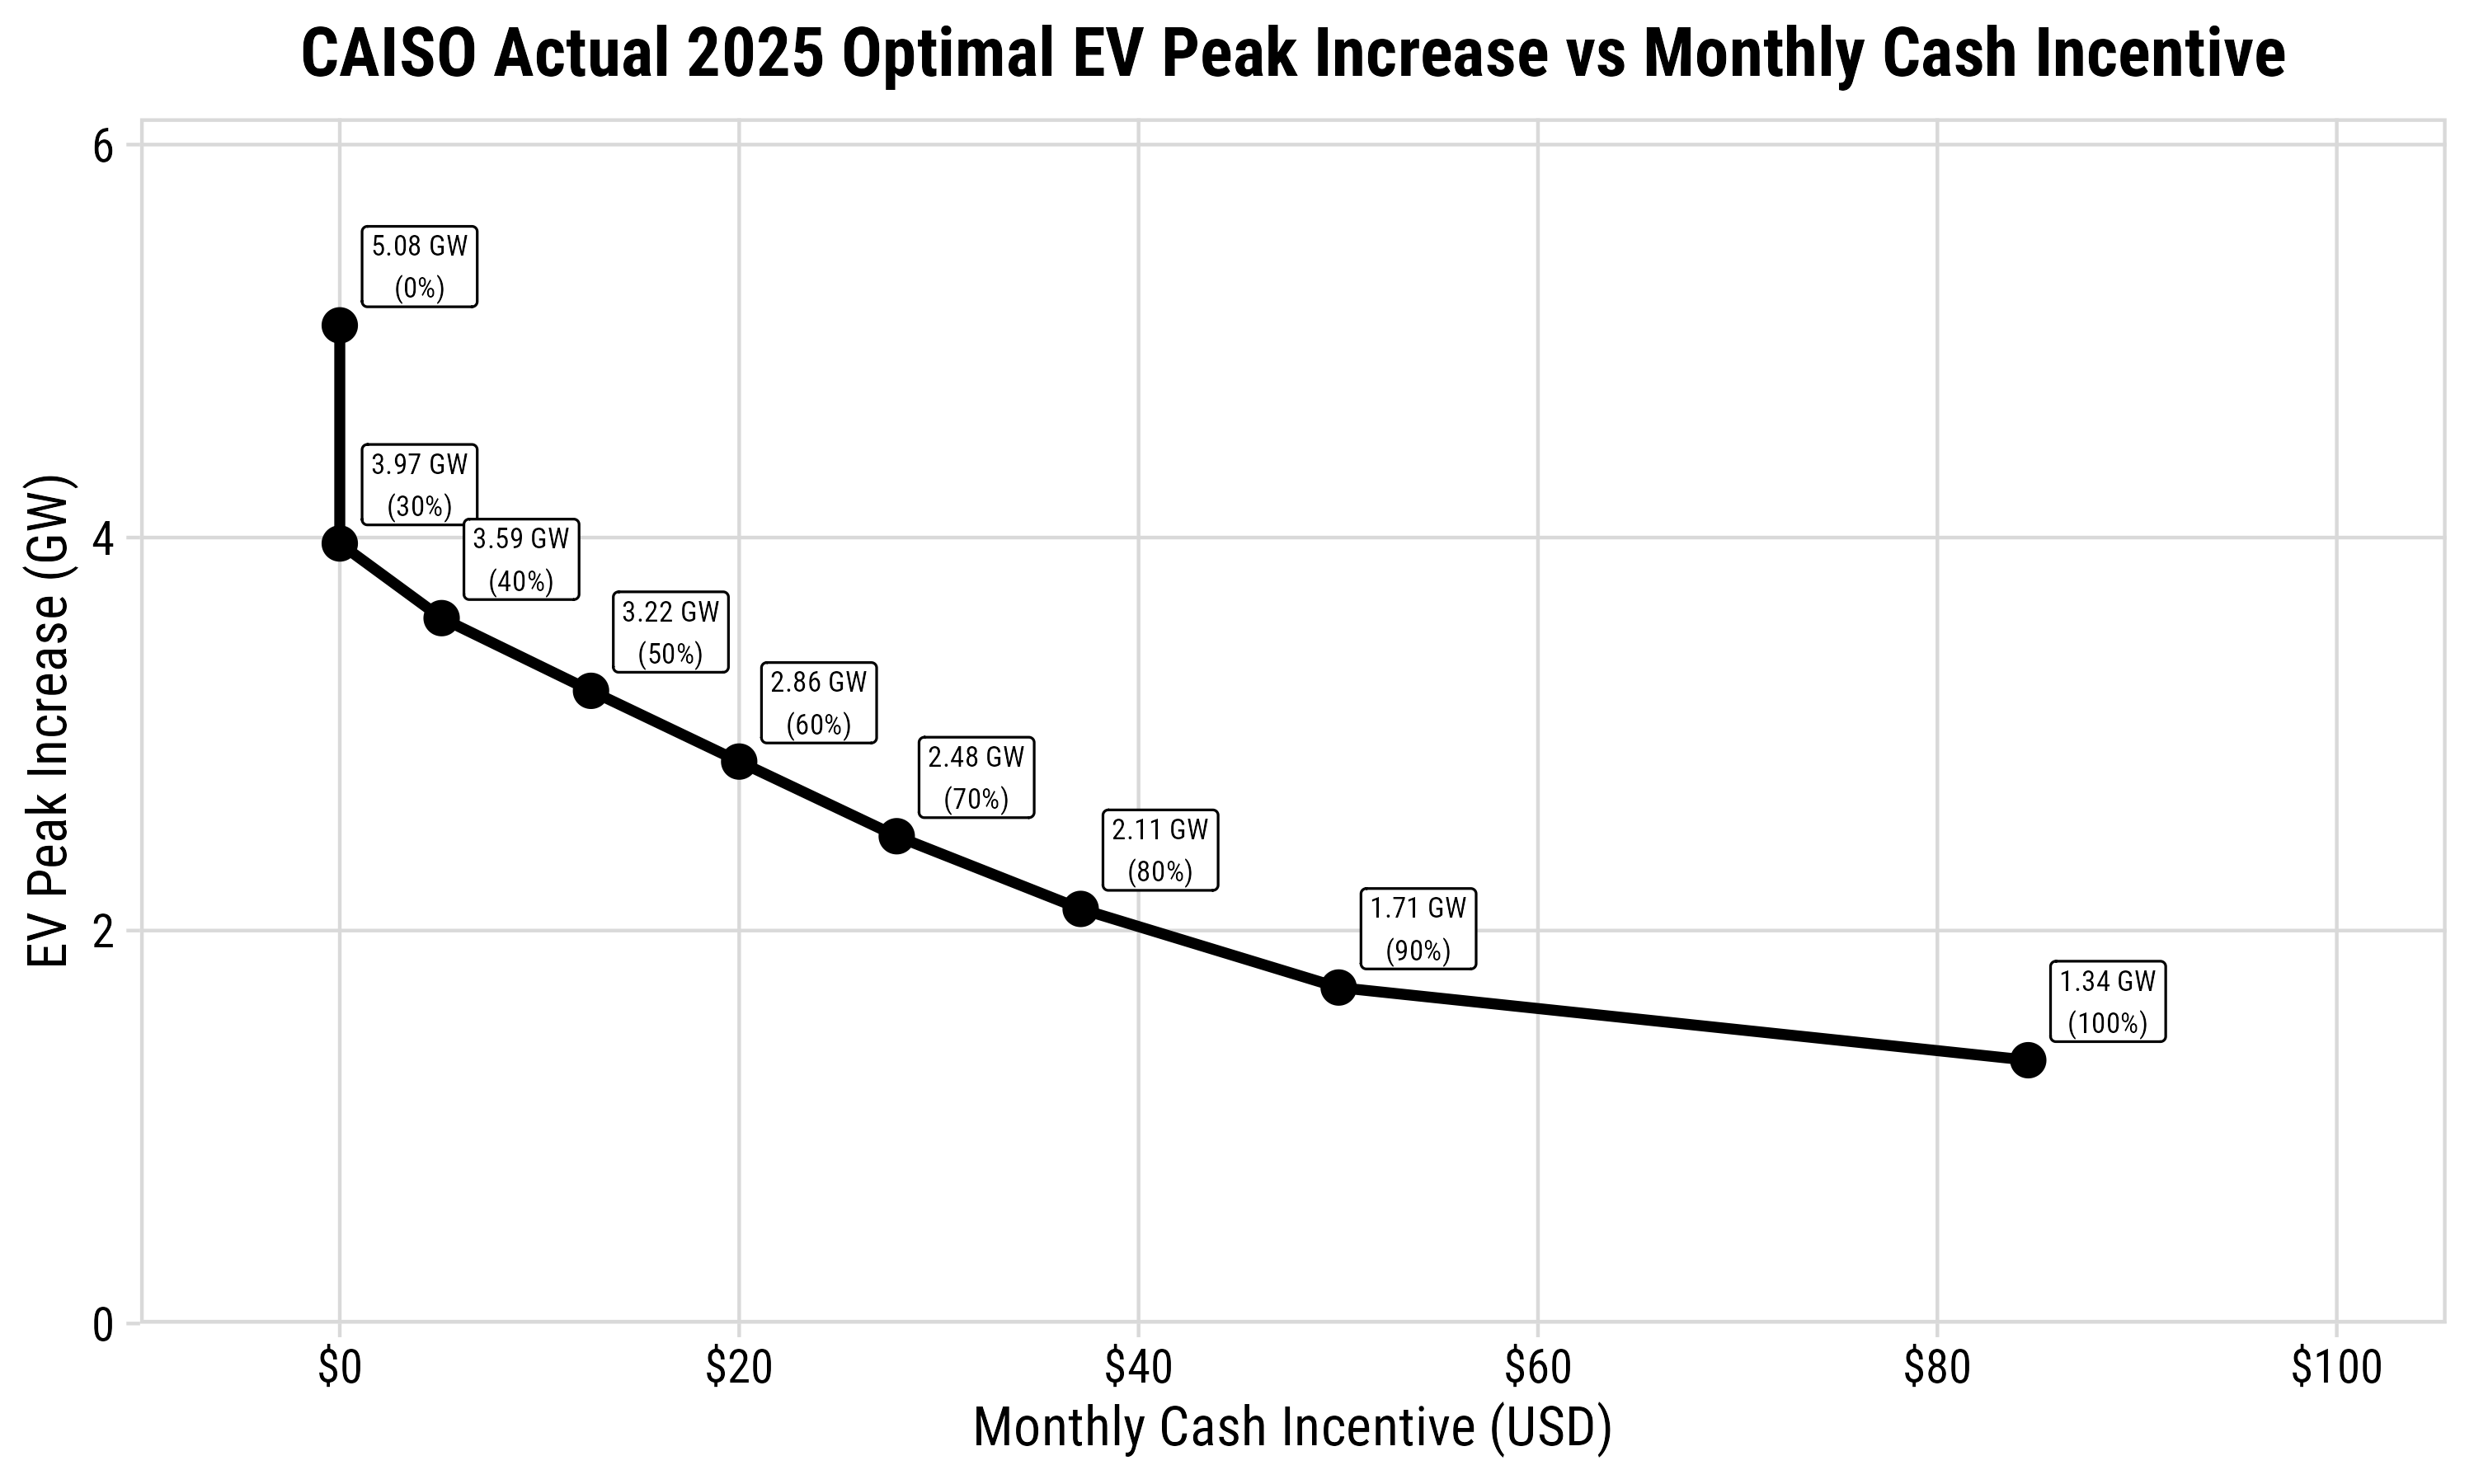
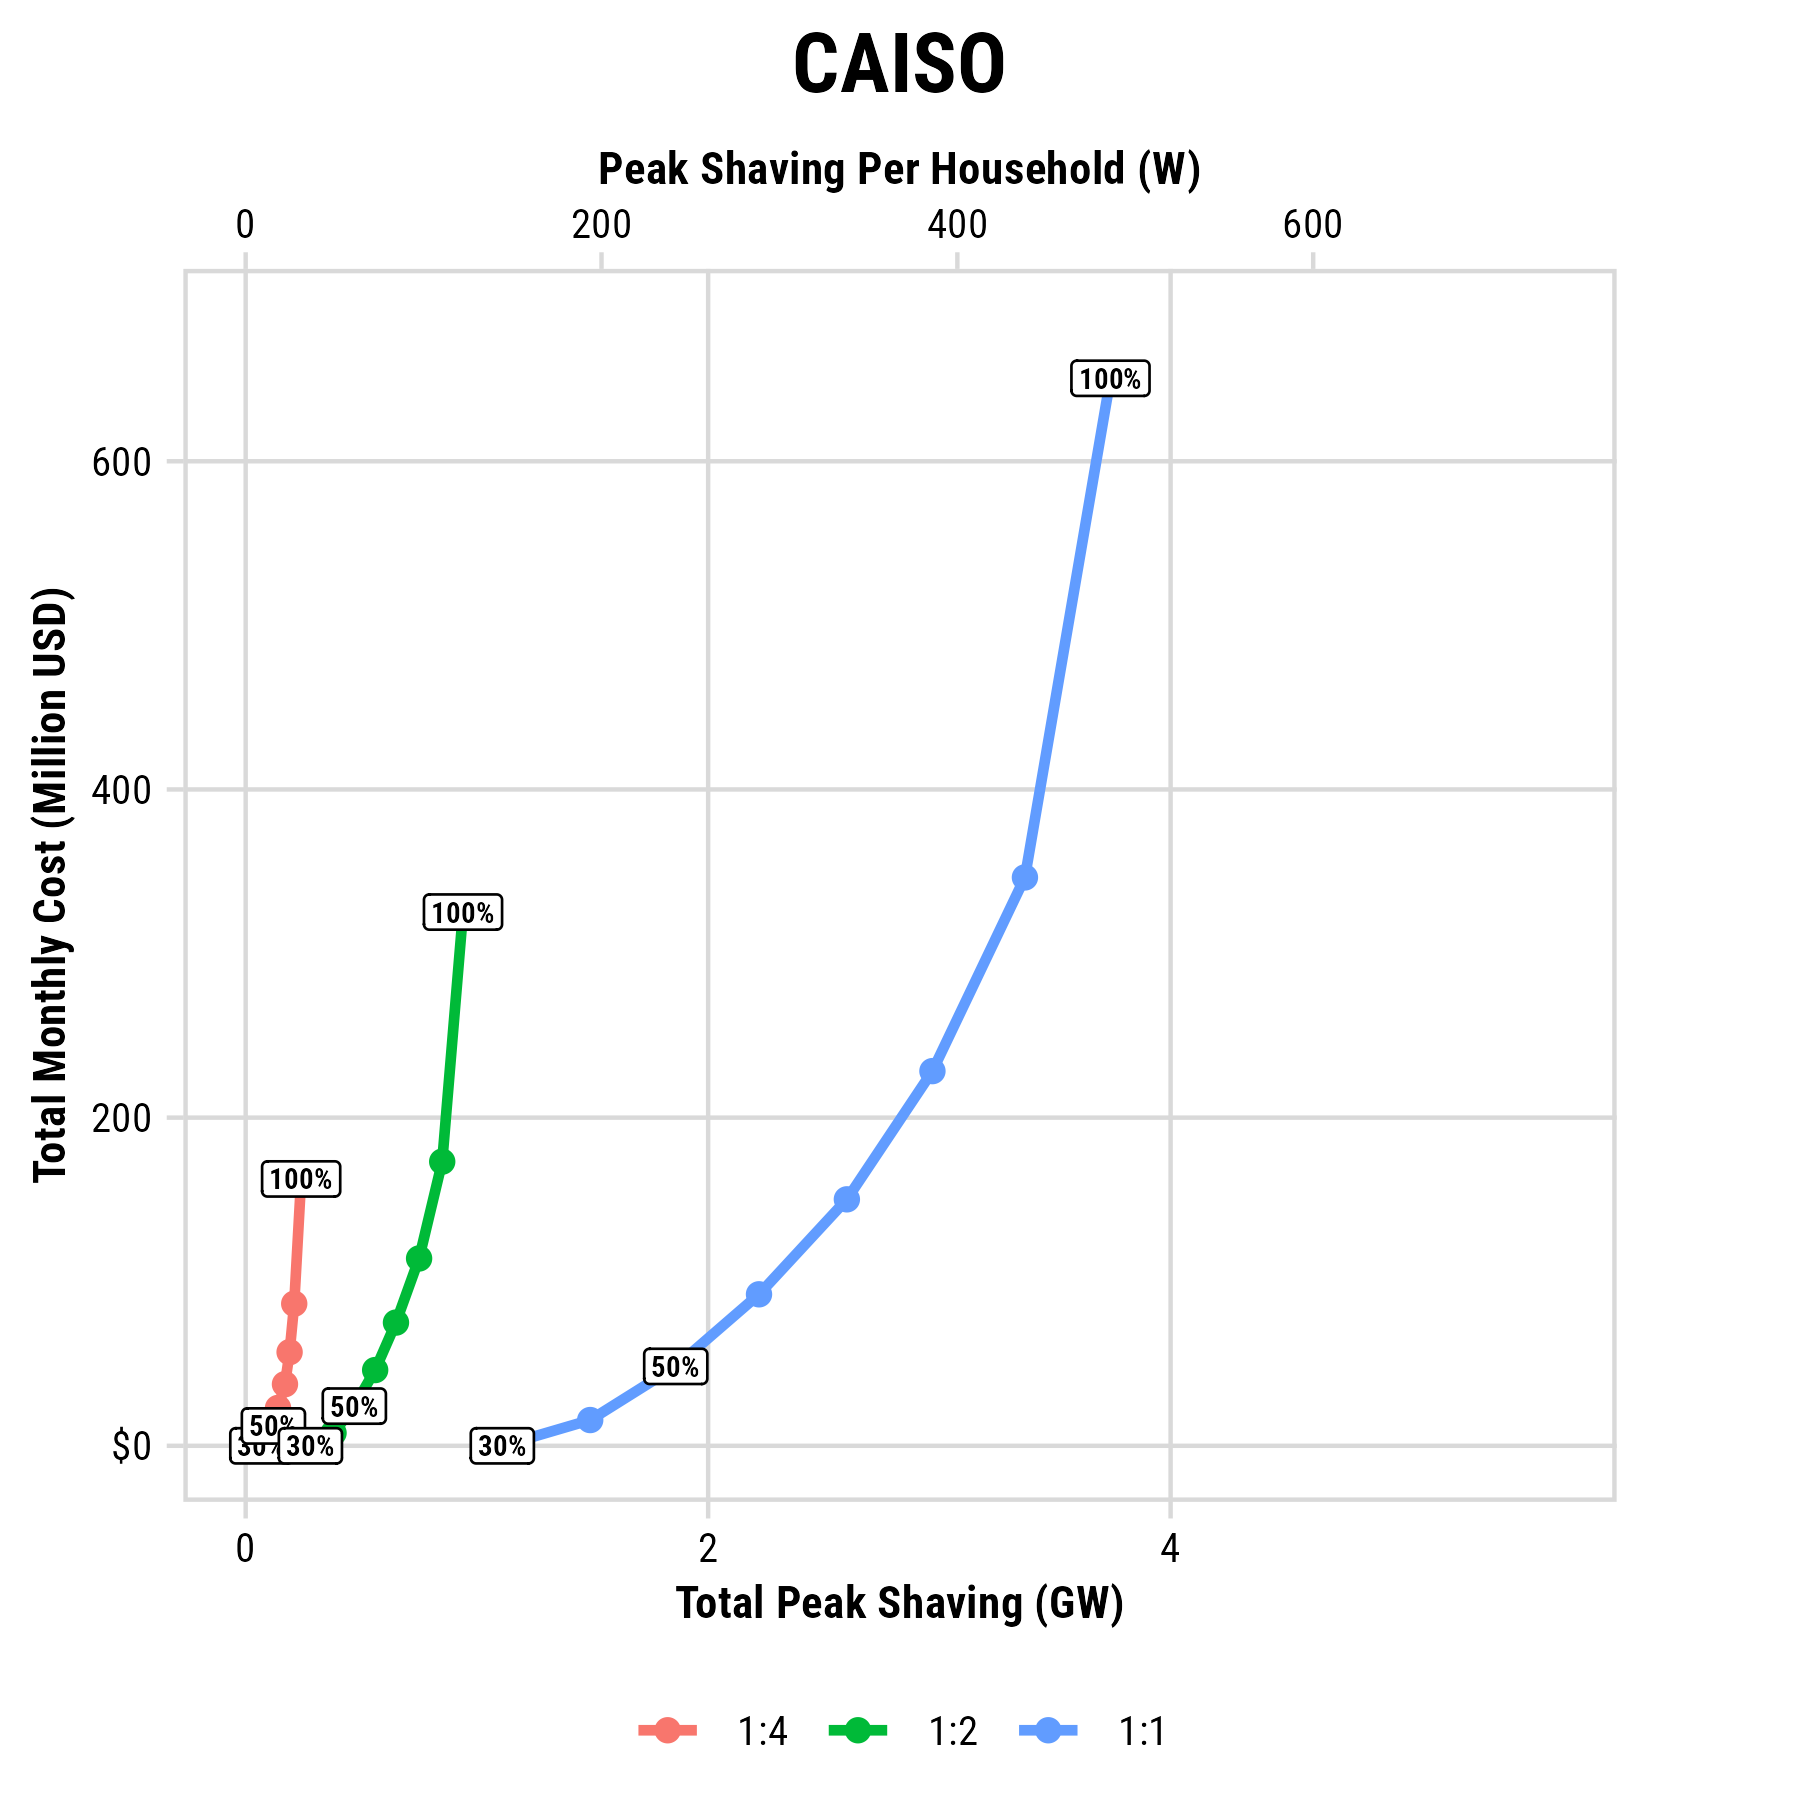
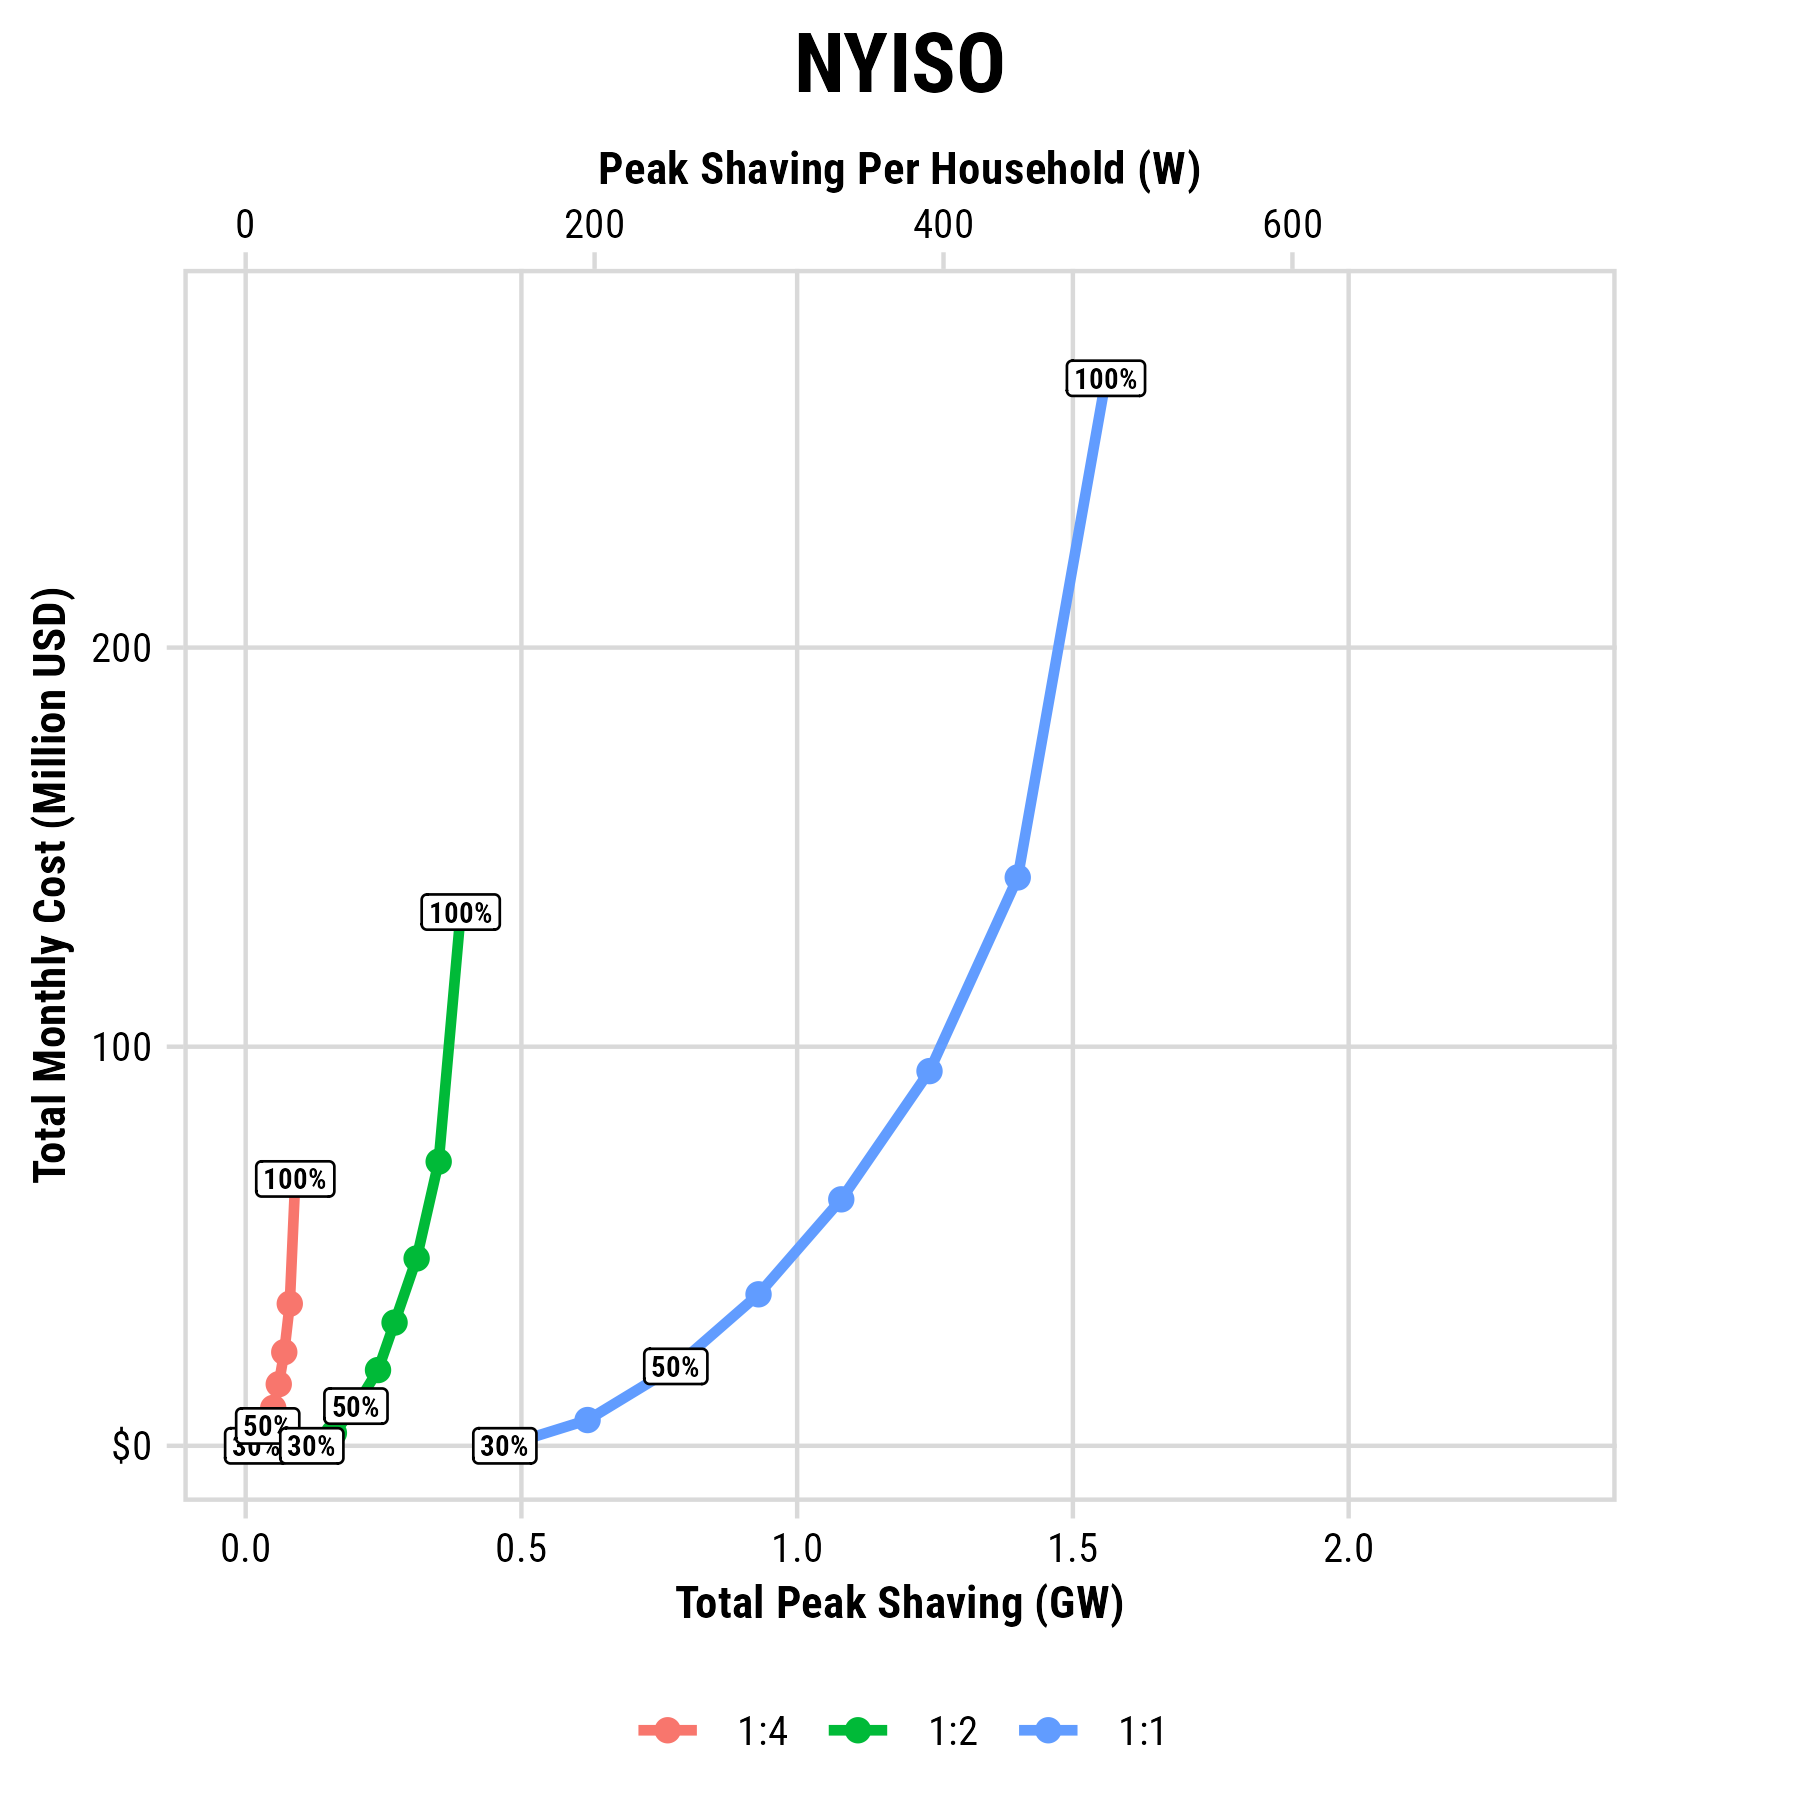
Cost Efficiency Frontier
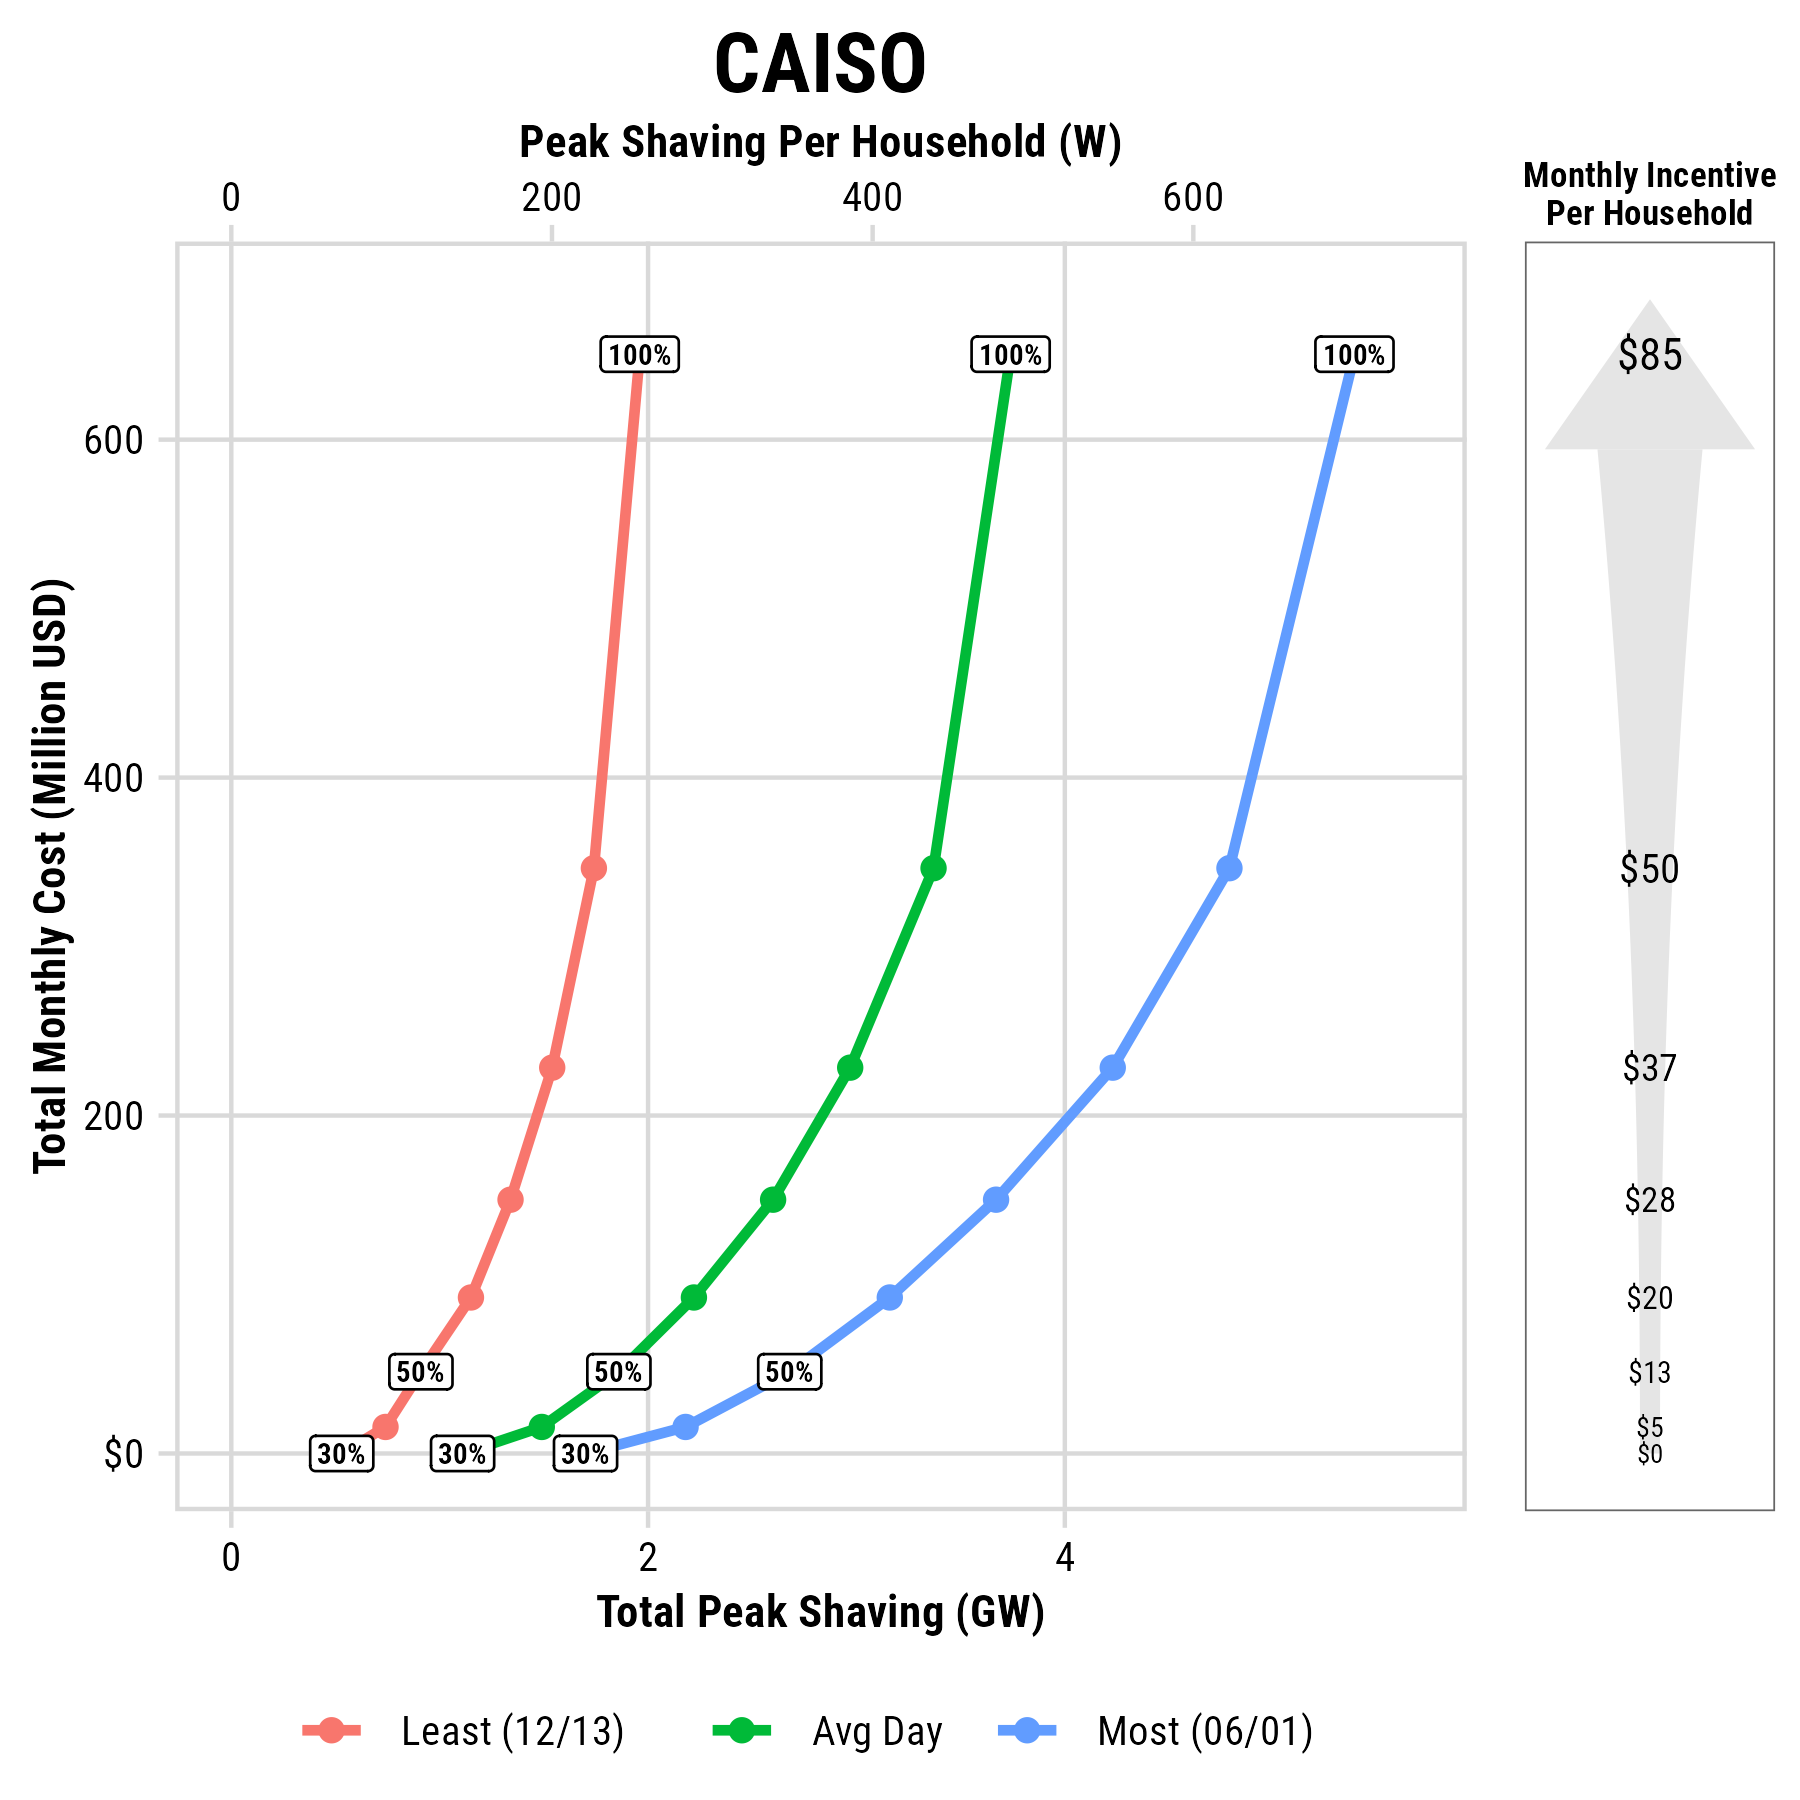
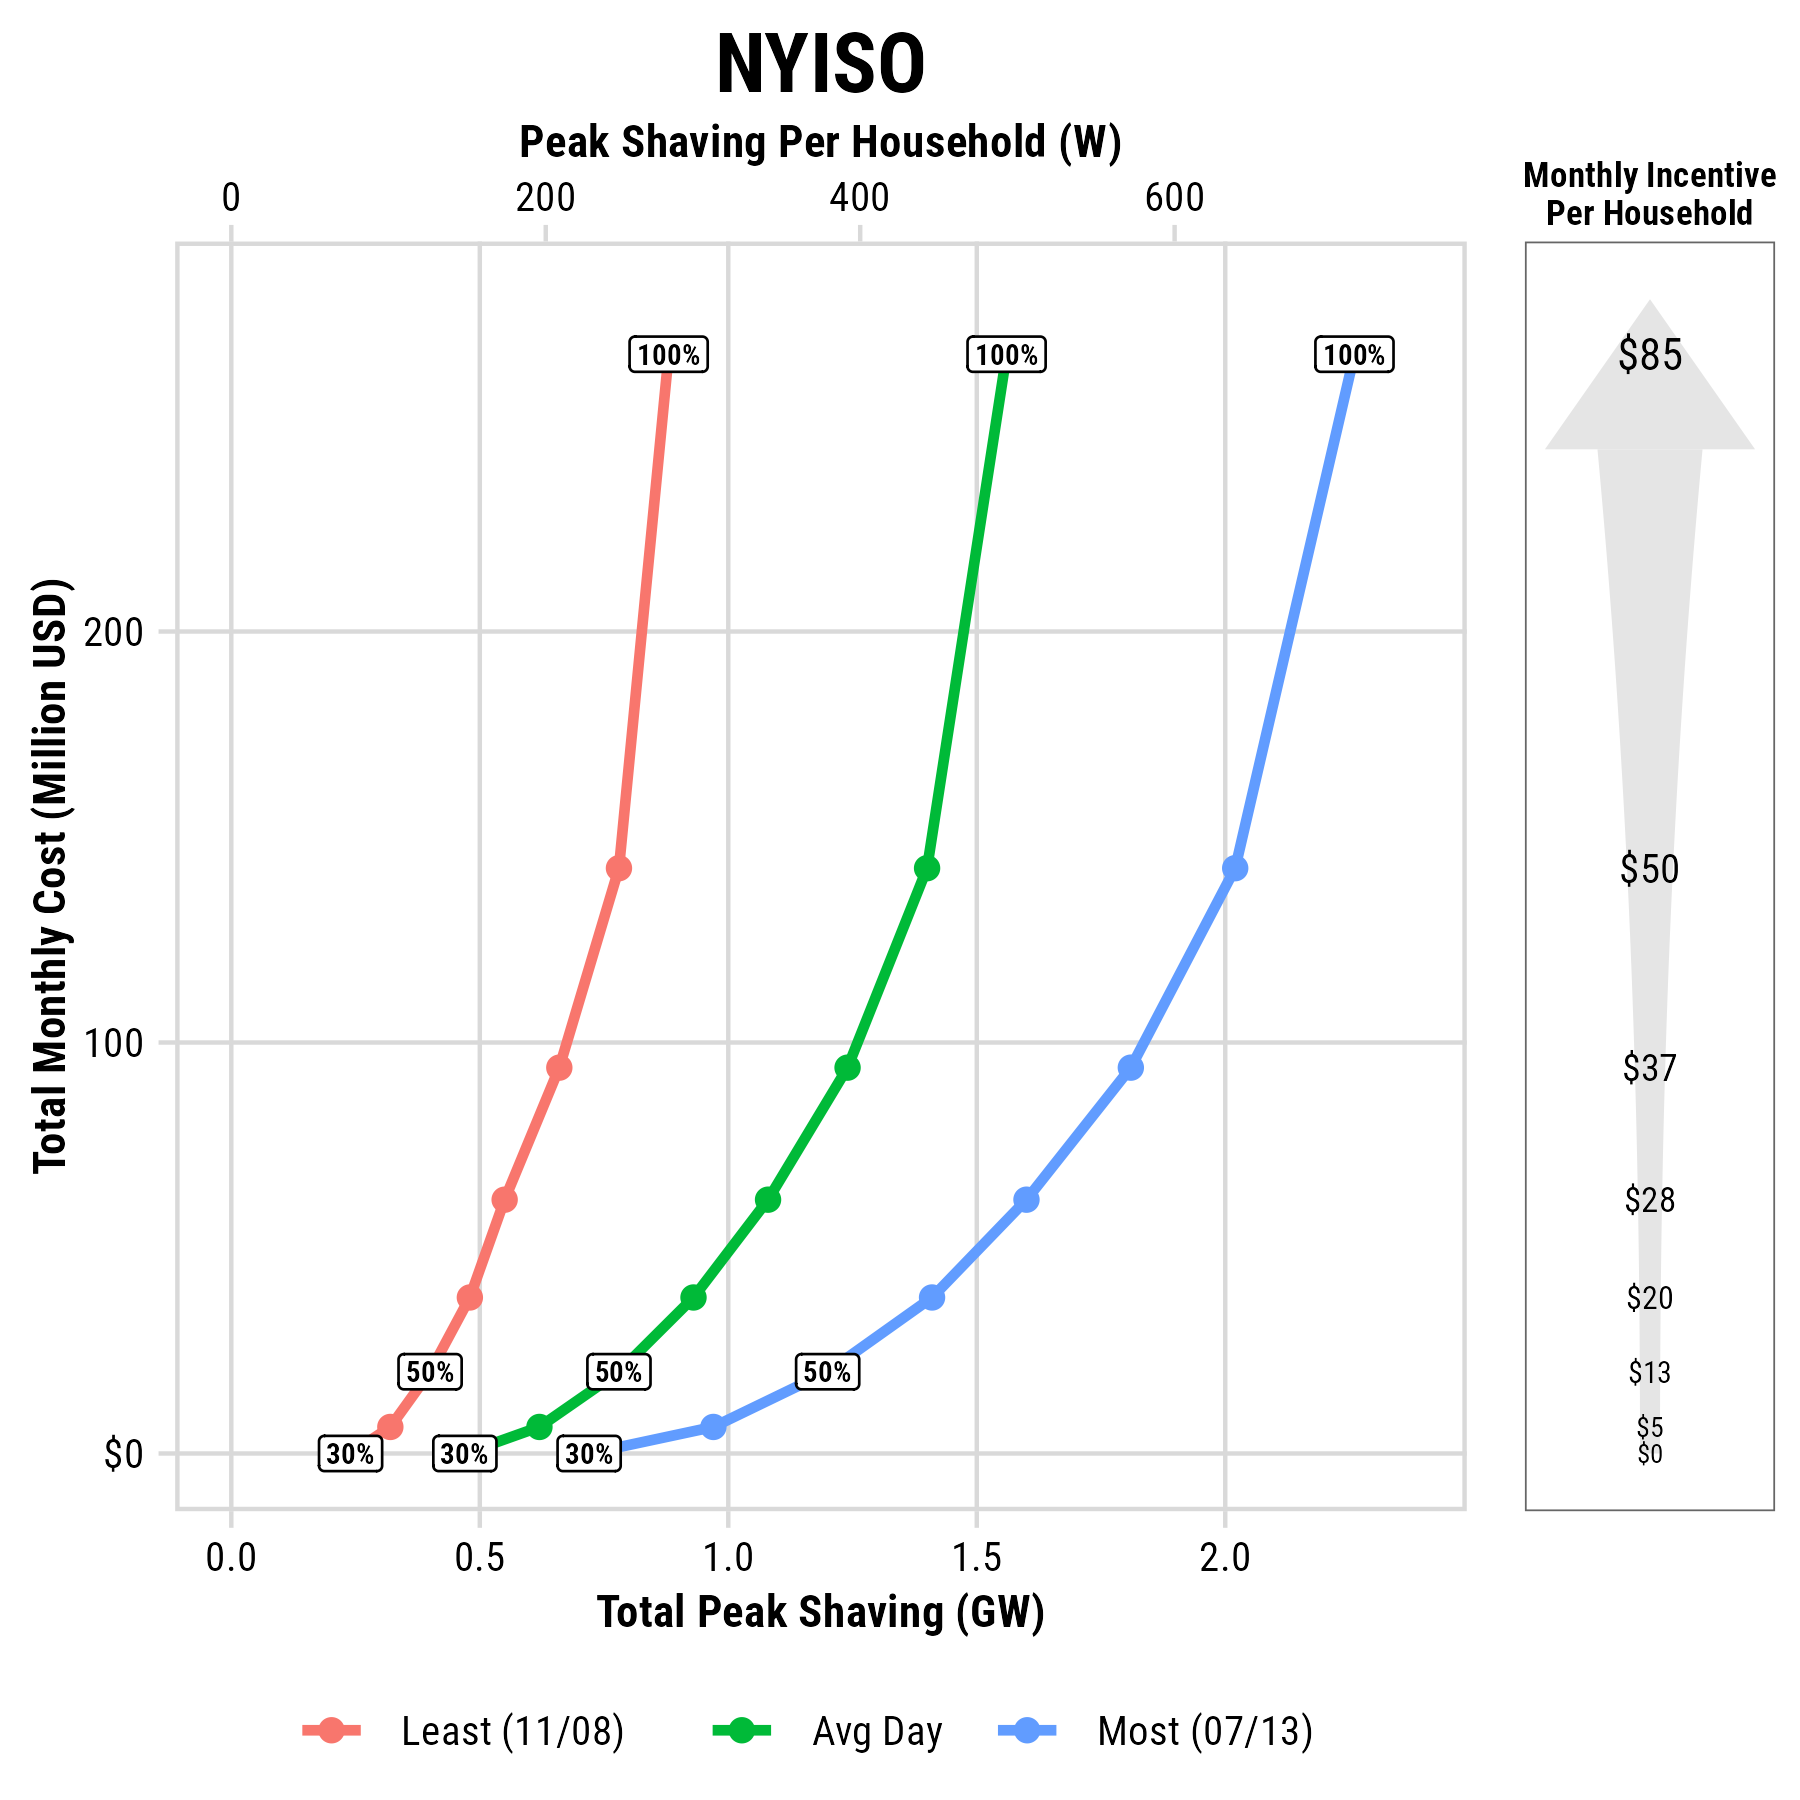
Cost efficiency is highest at moderate enrollment (30–50%).
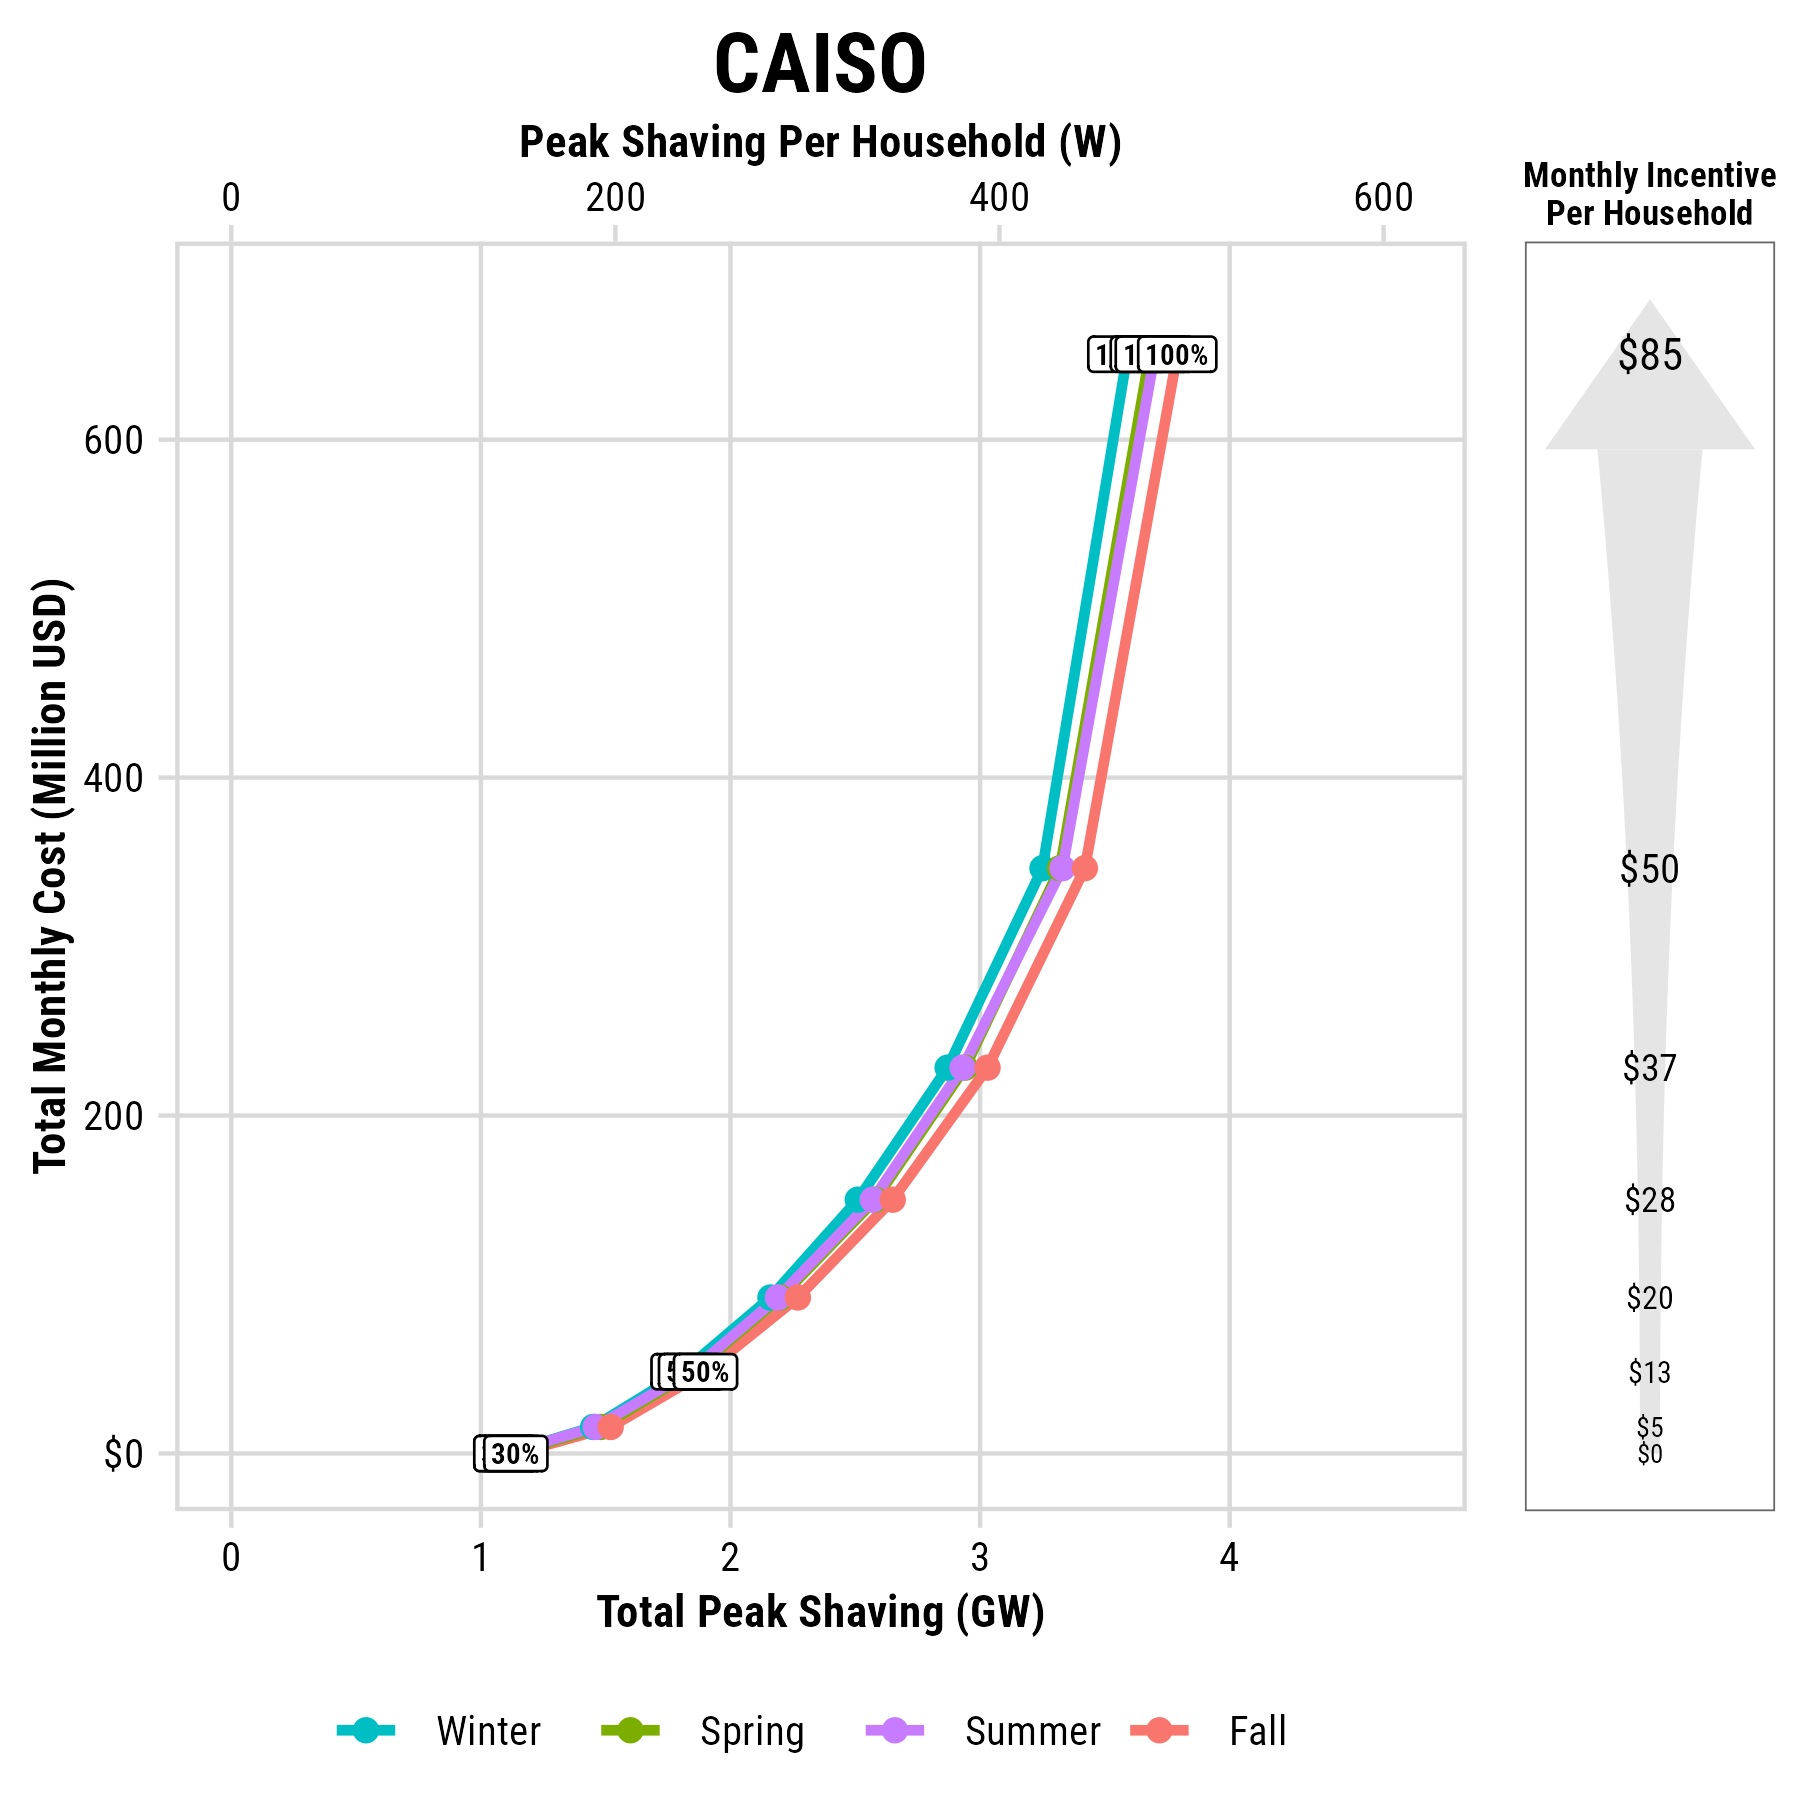
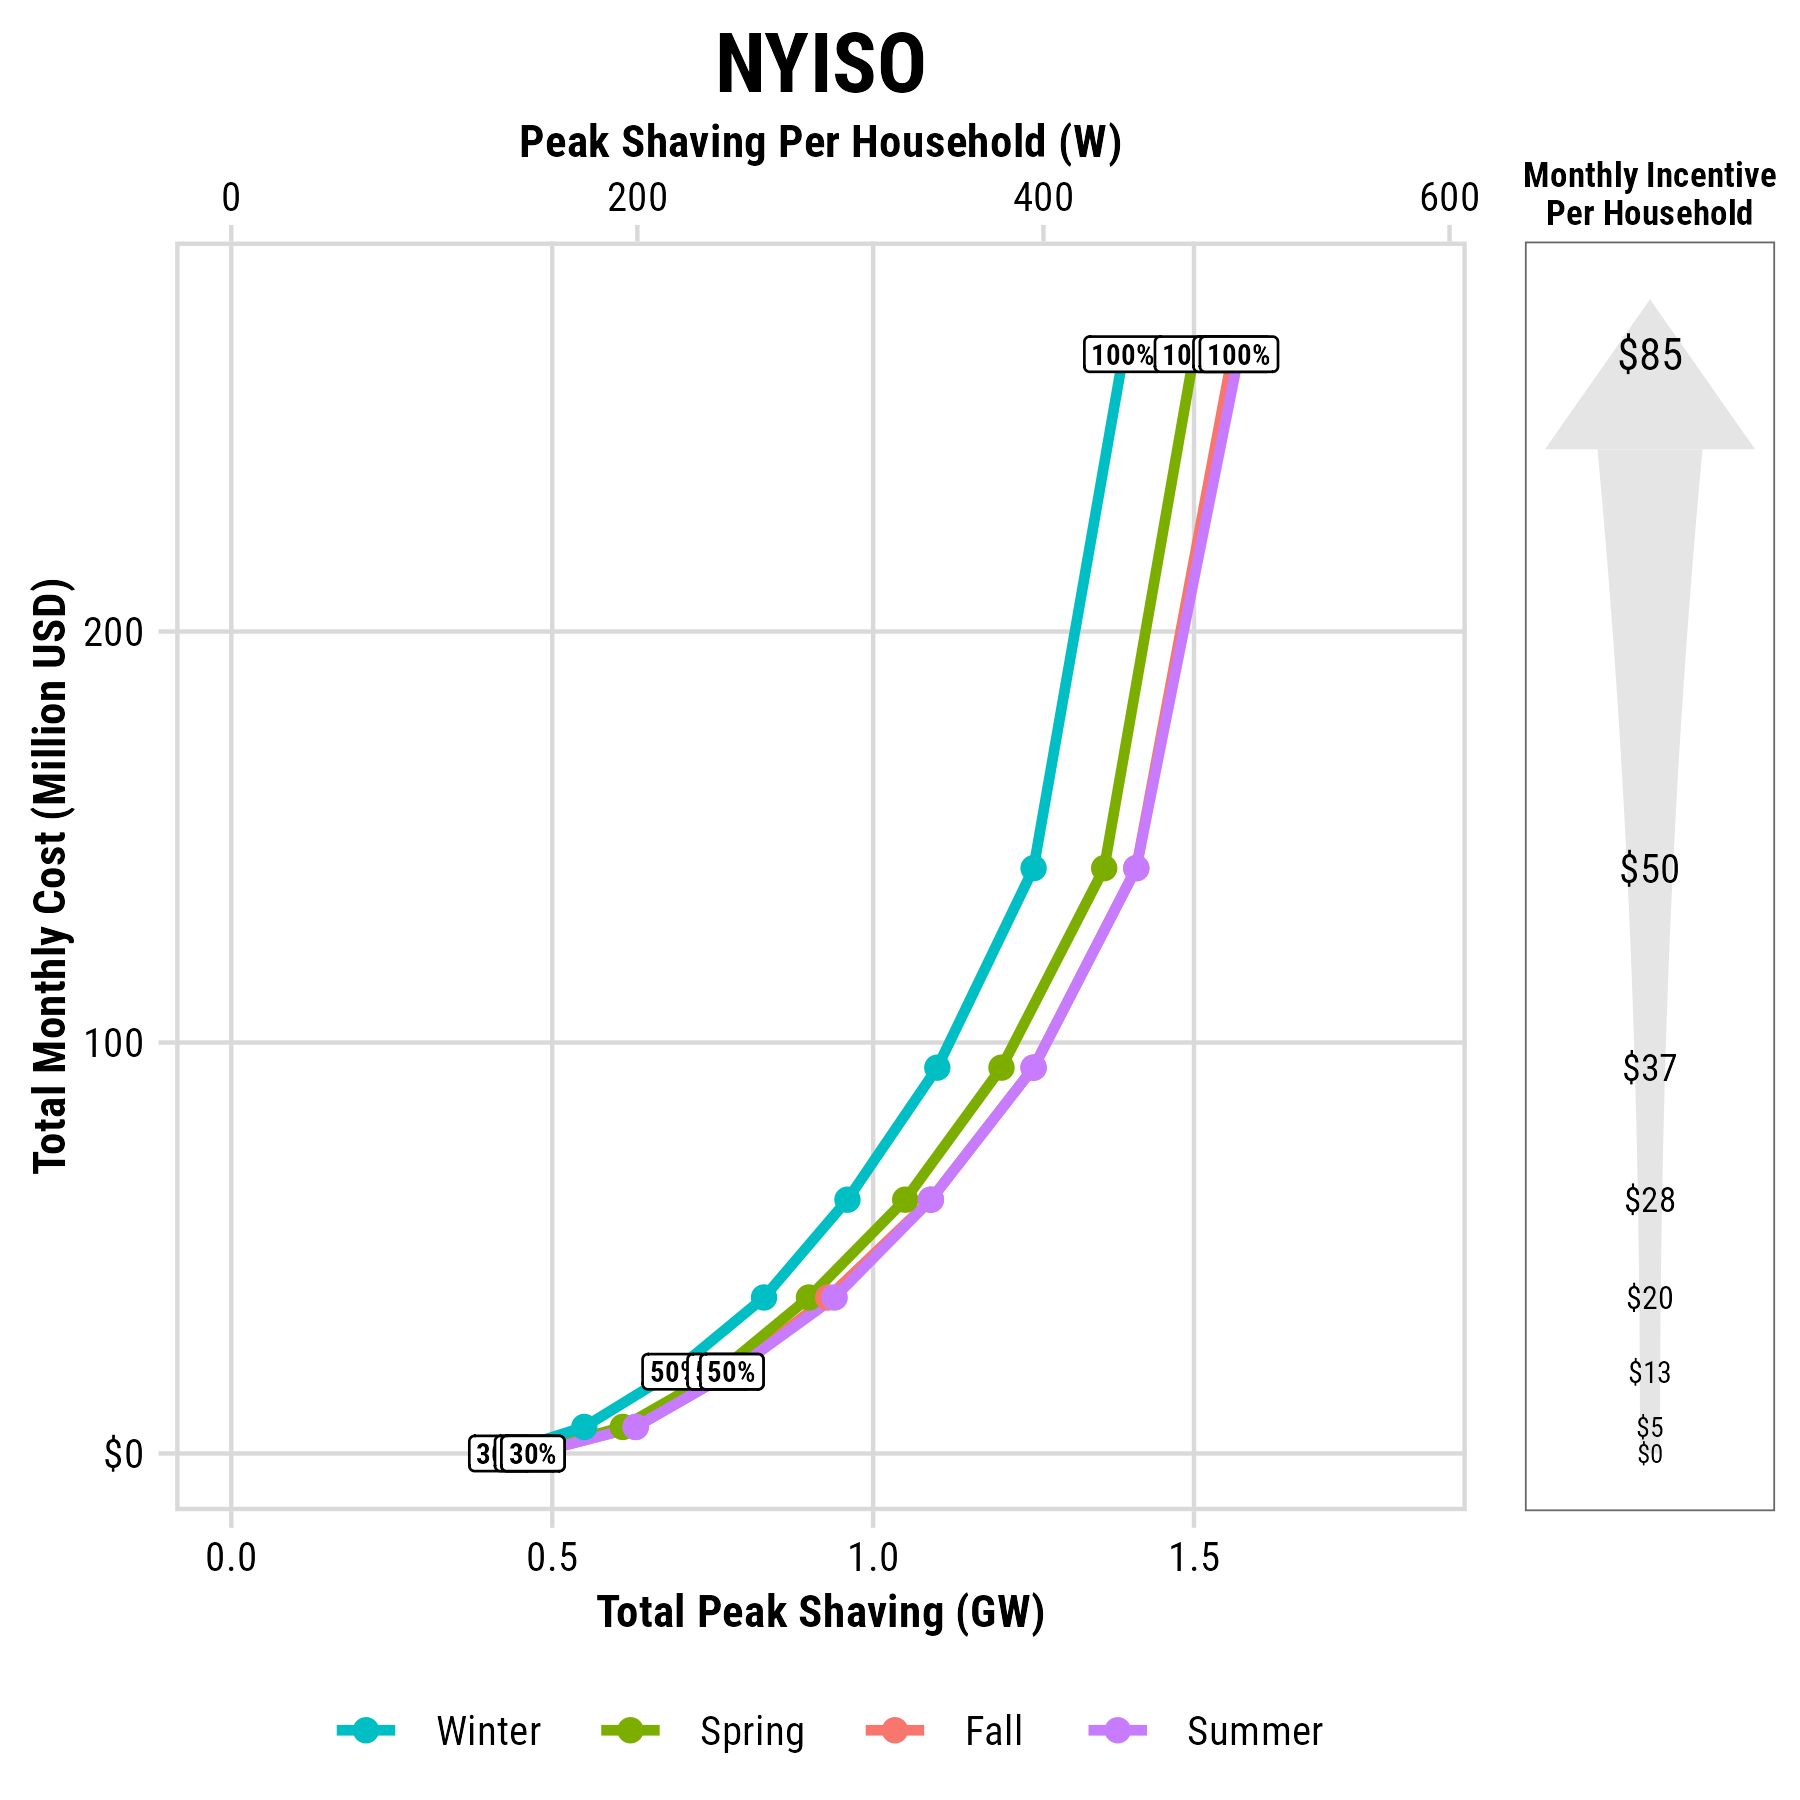
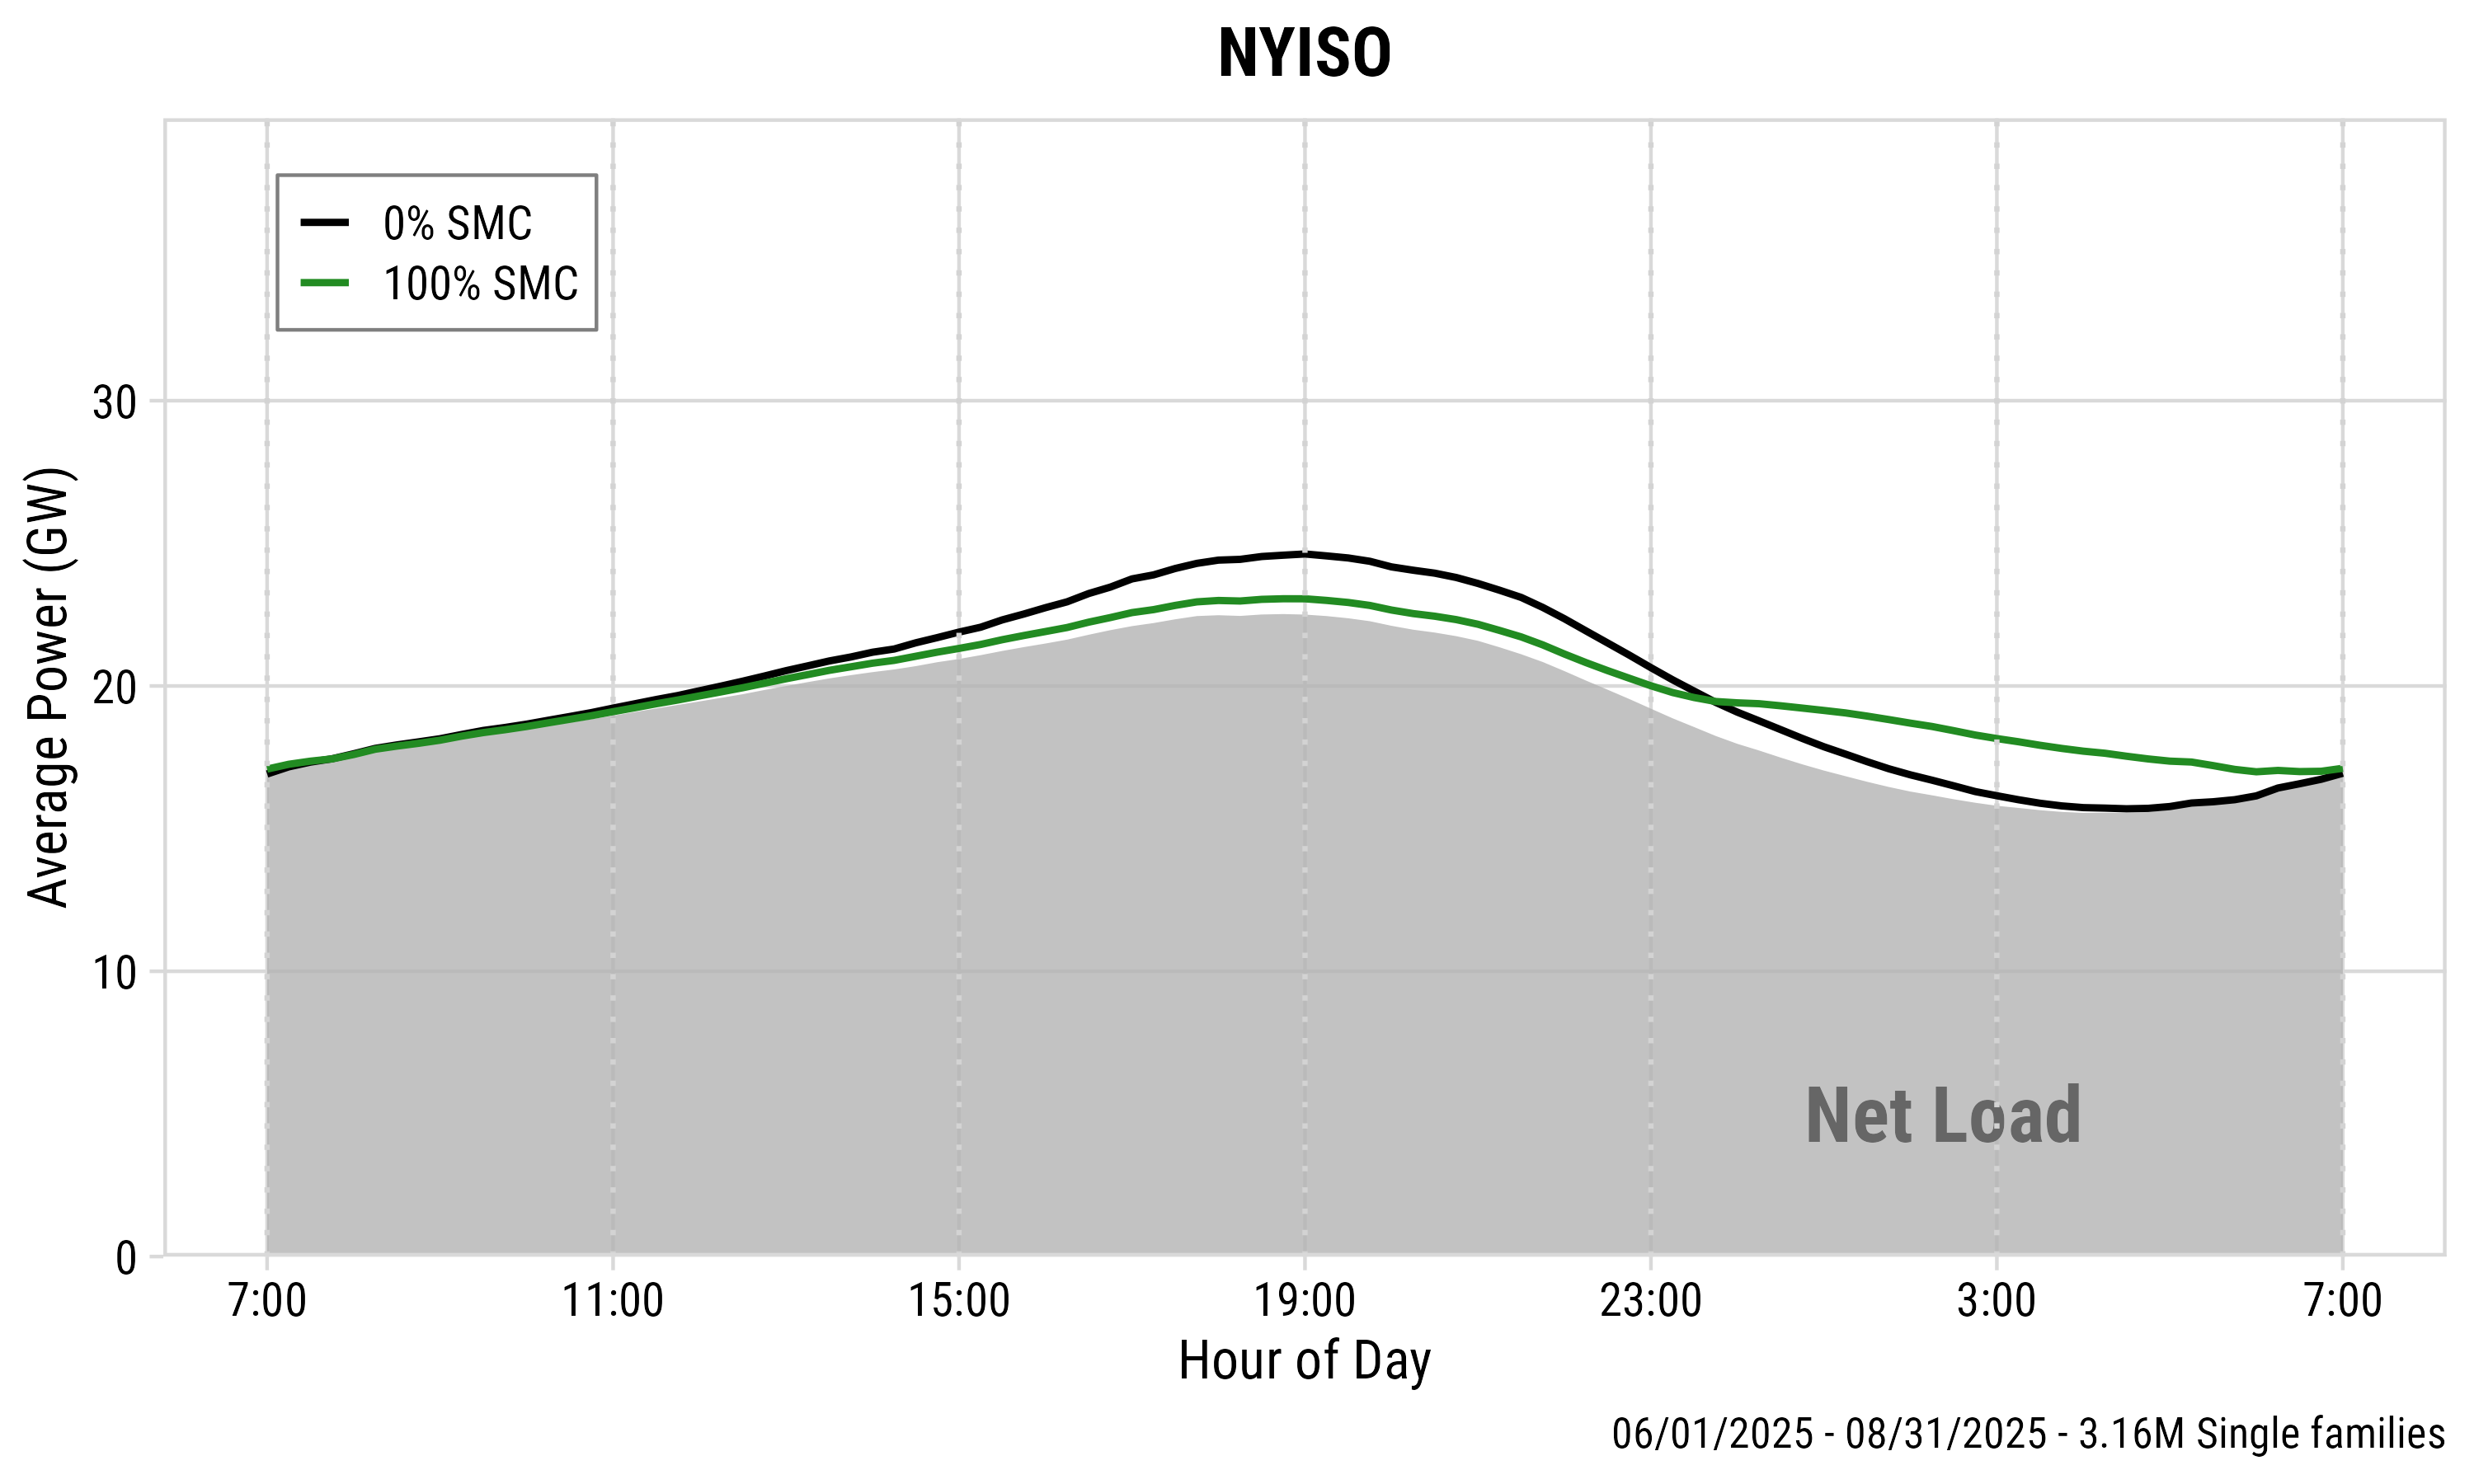
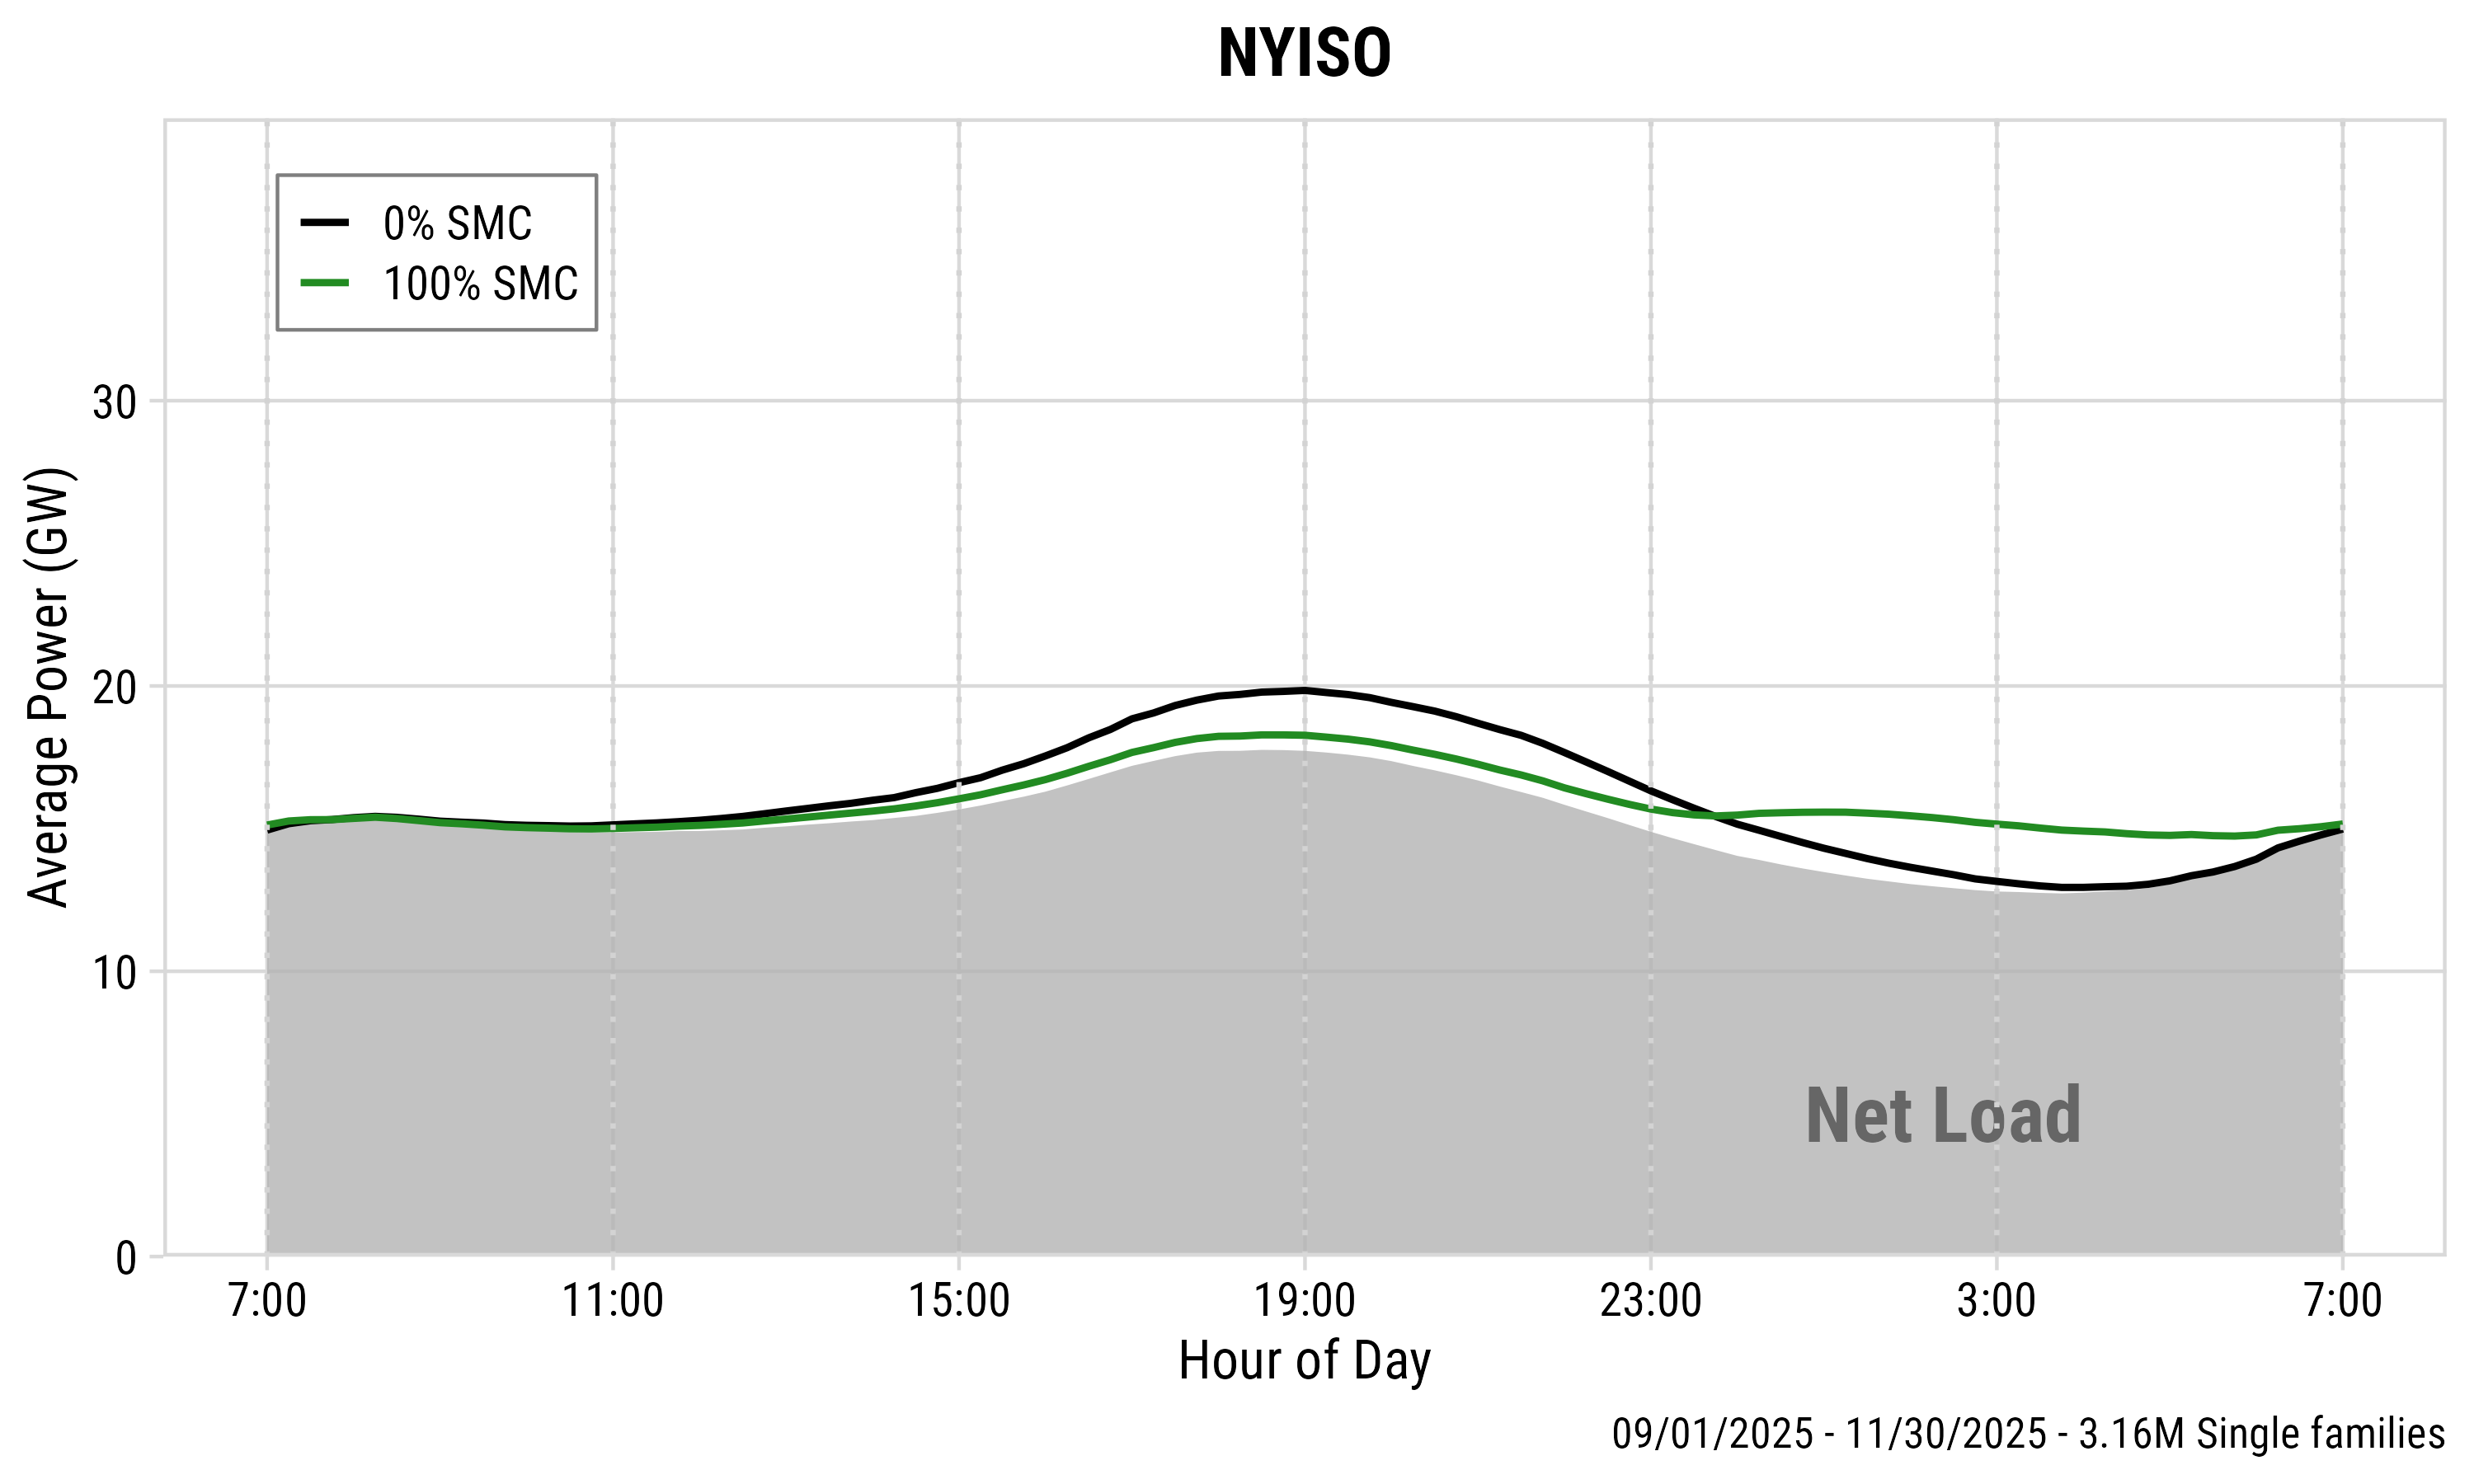
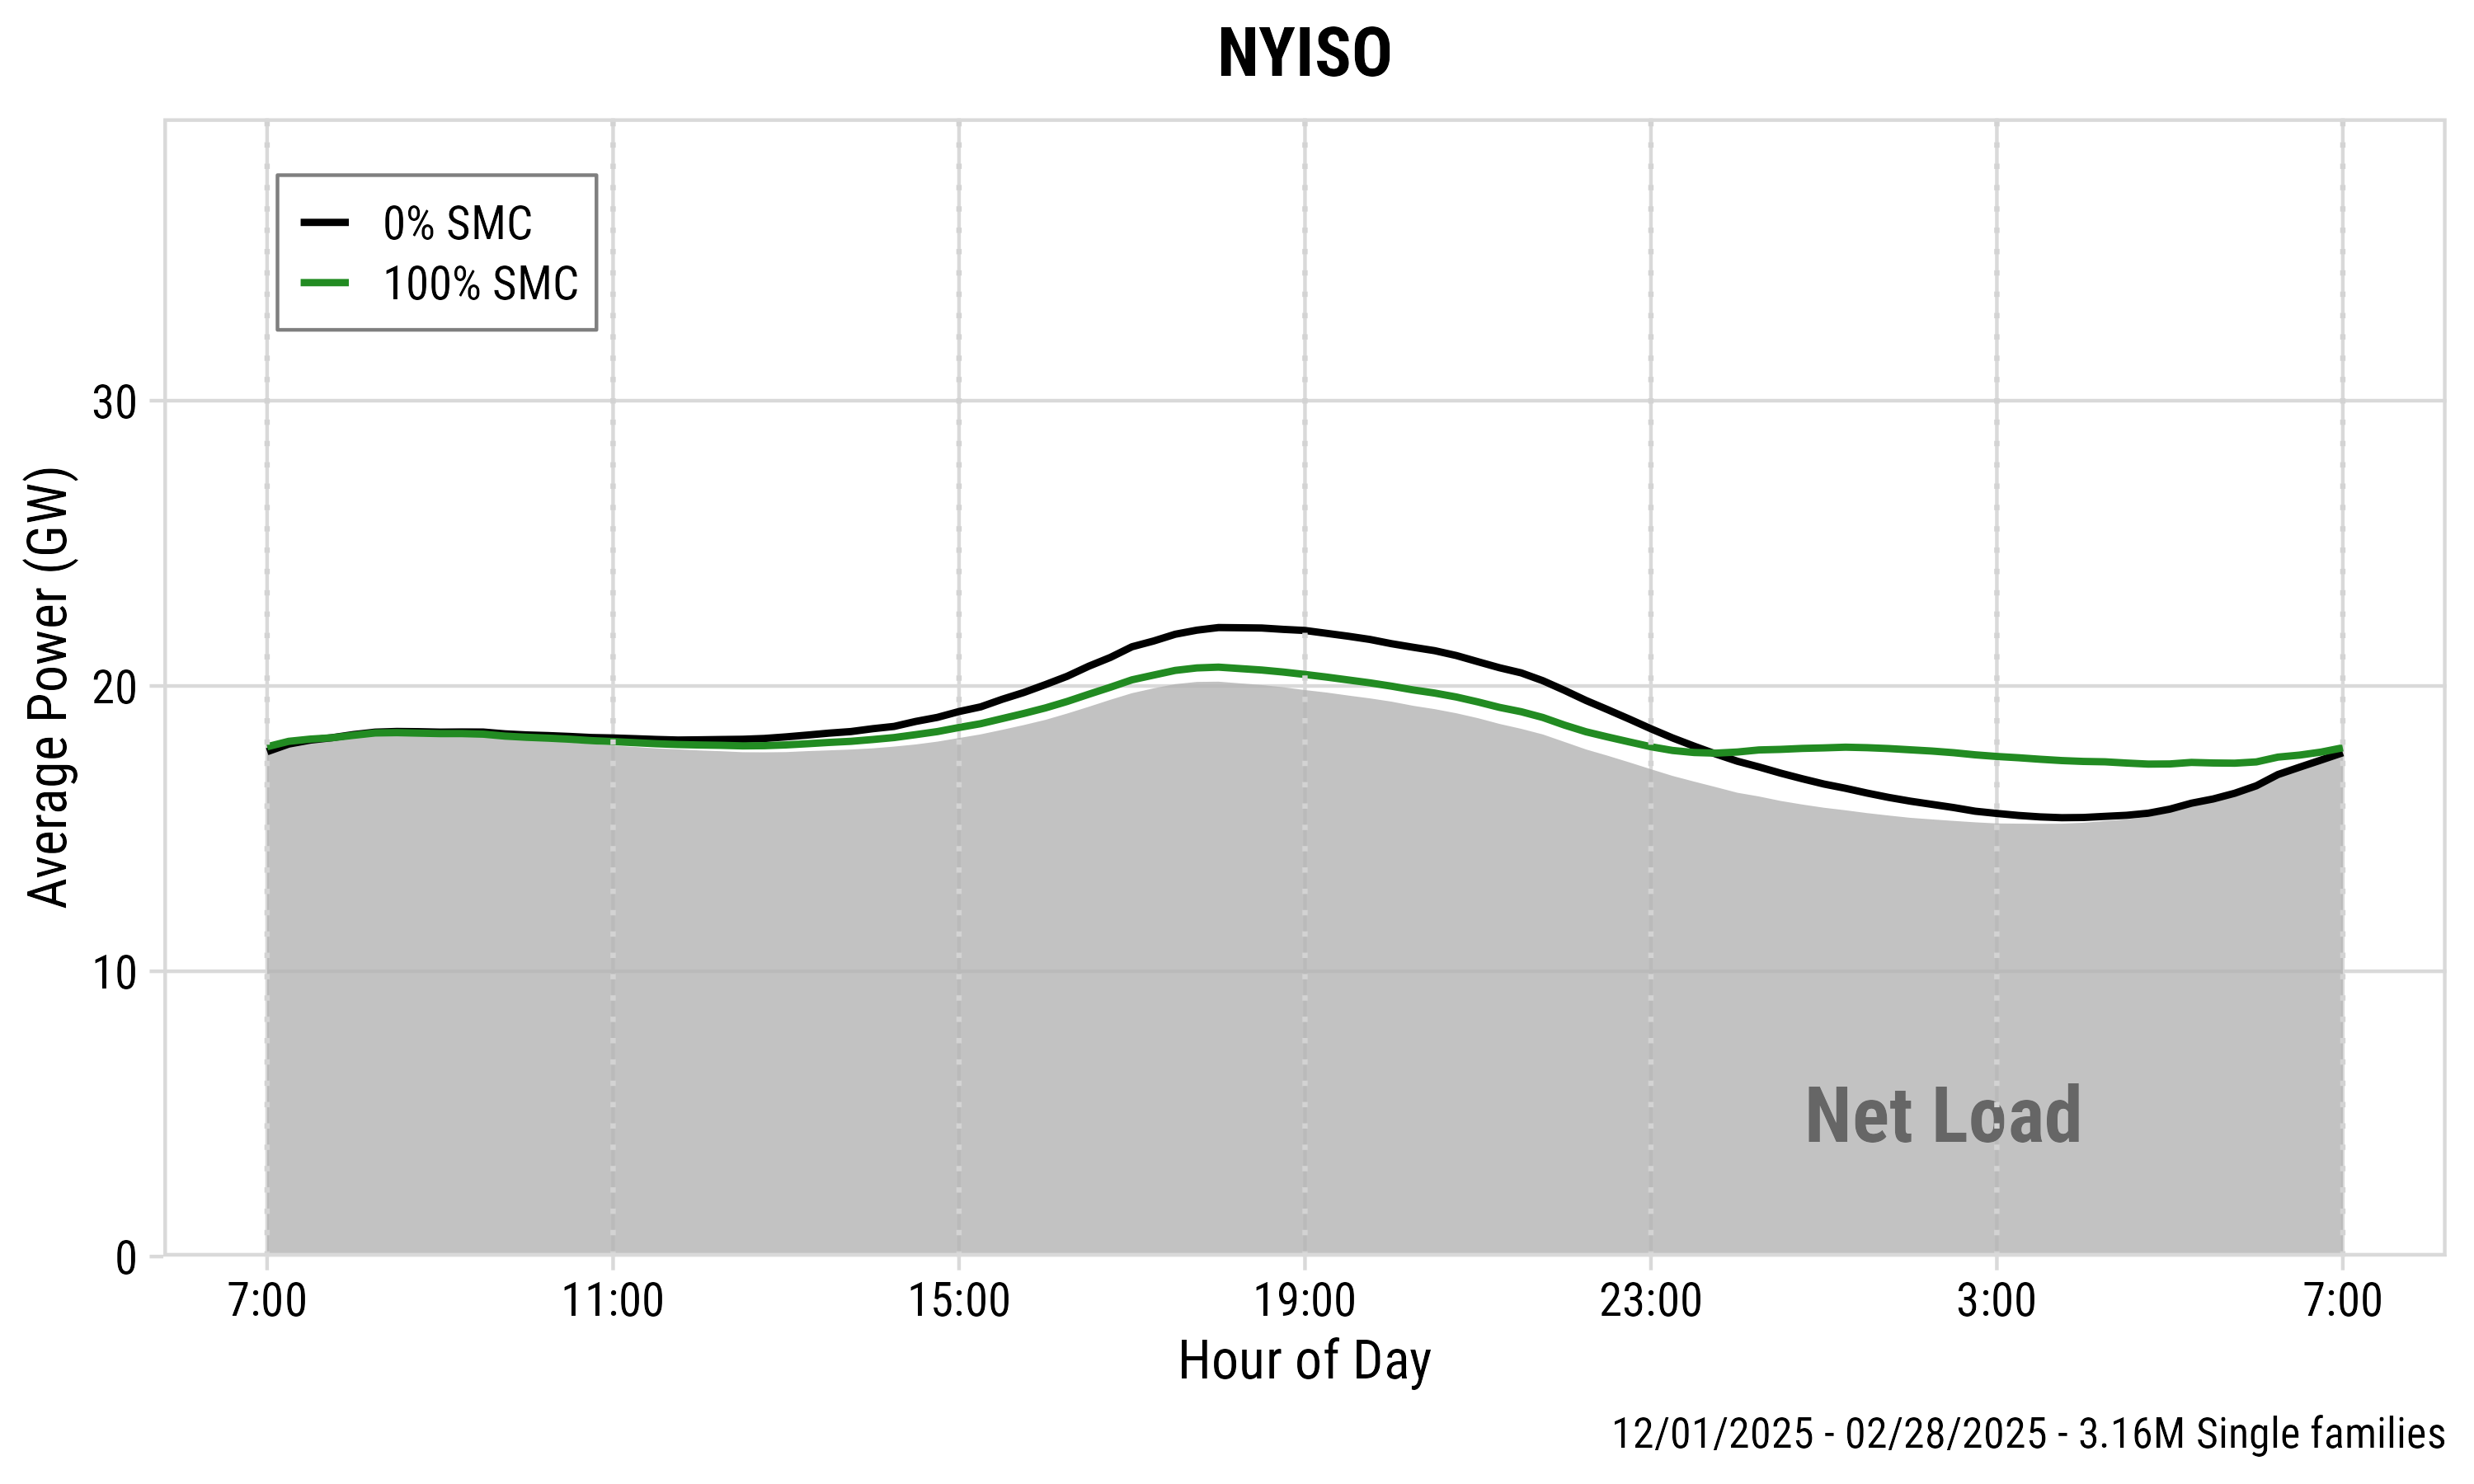
Seasonal cost efficiency is
consistent in CAISO, but varies in NYISO.
Most program cost is participant surplus
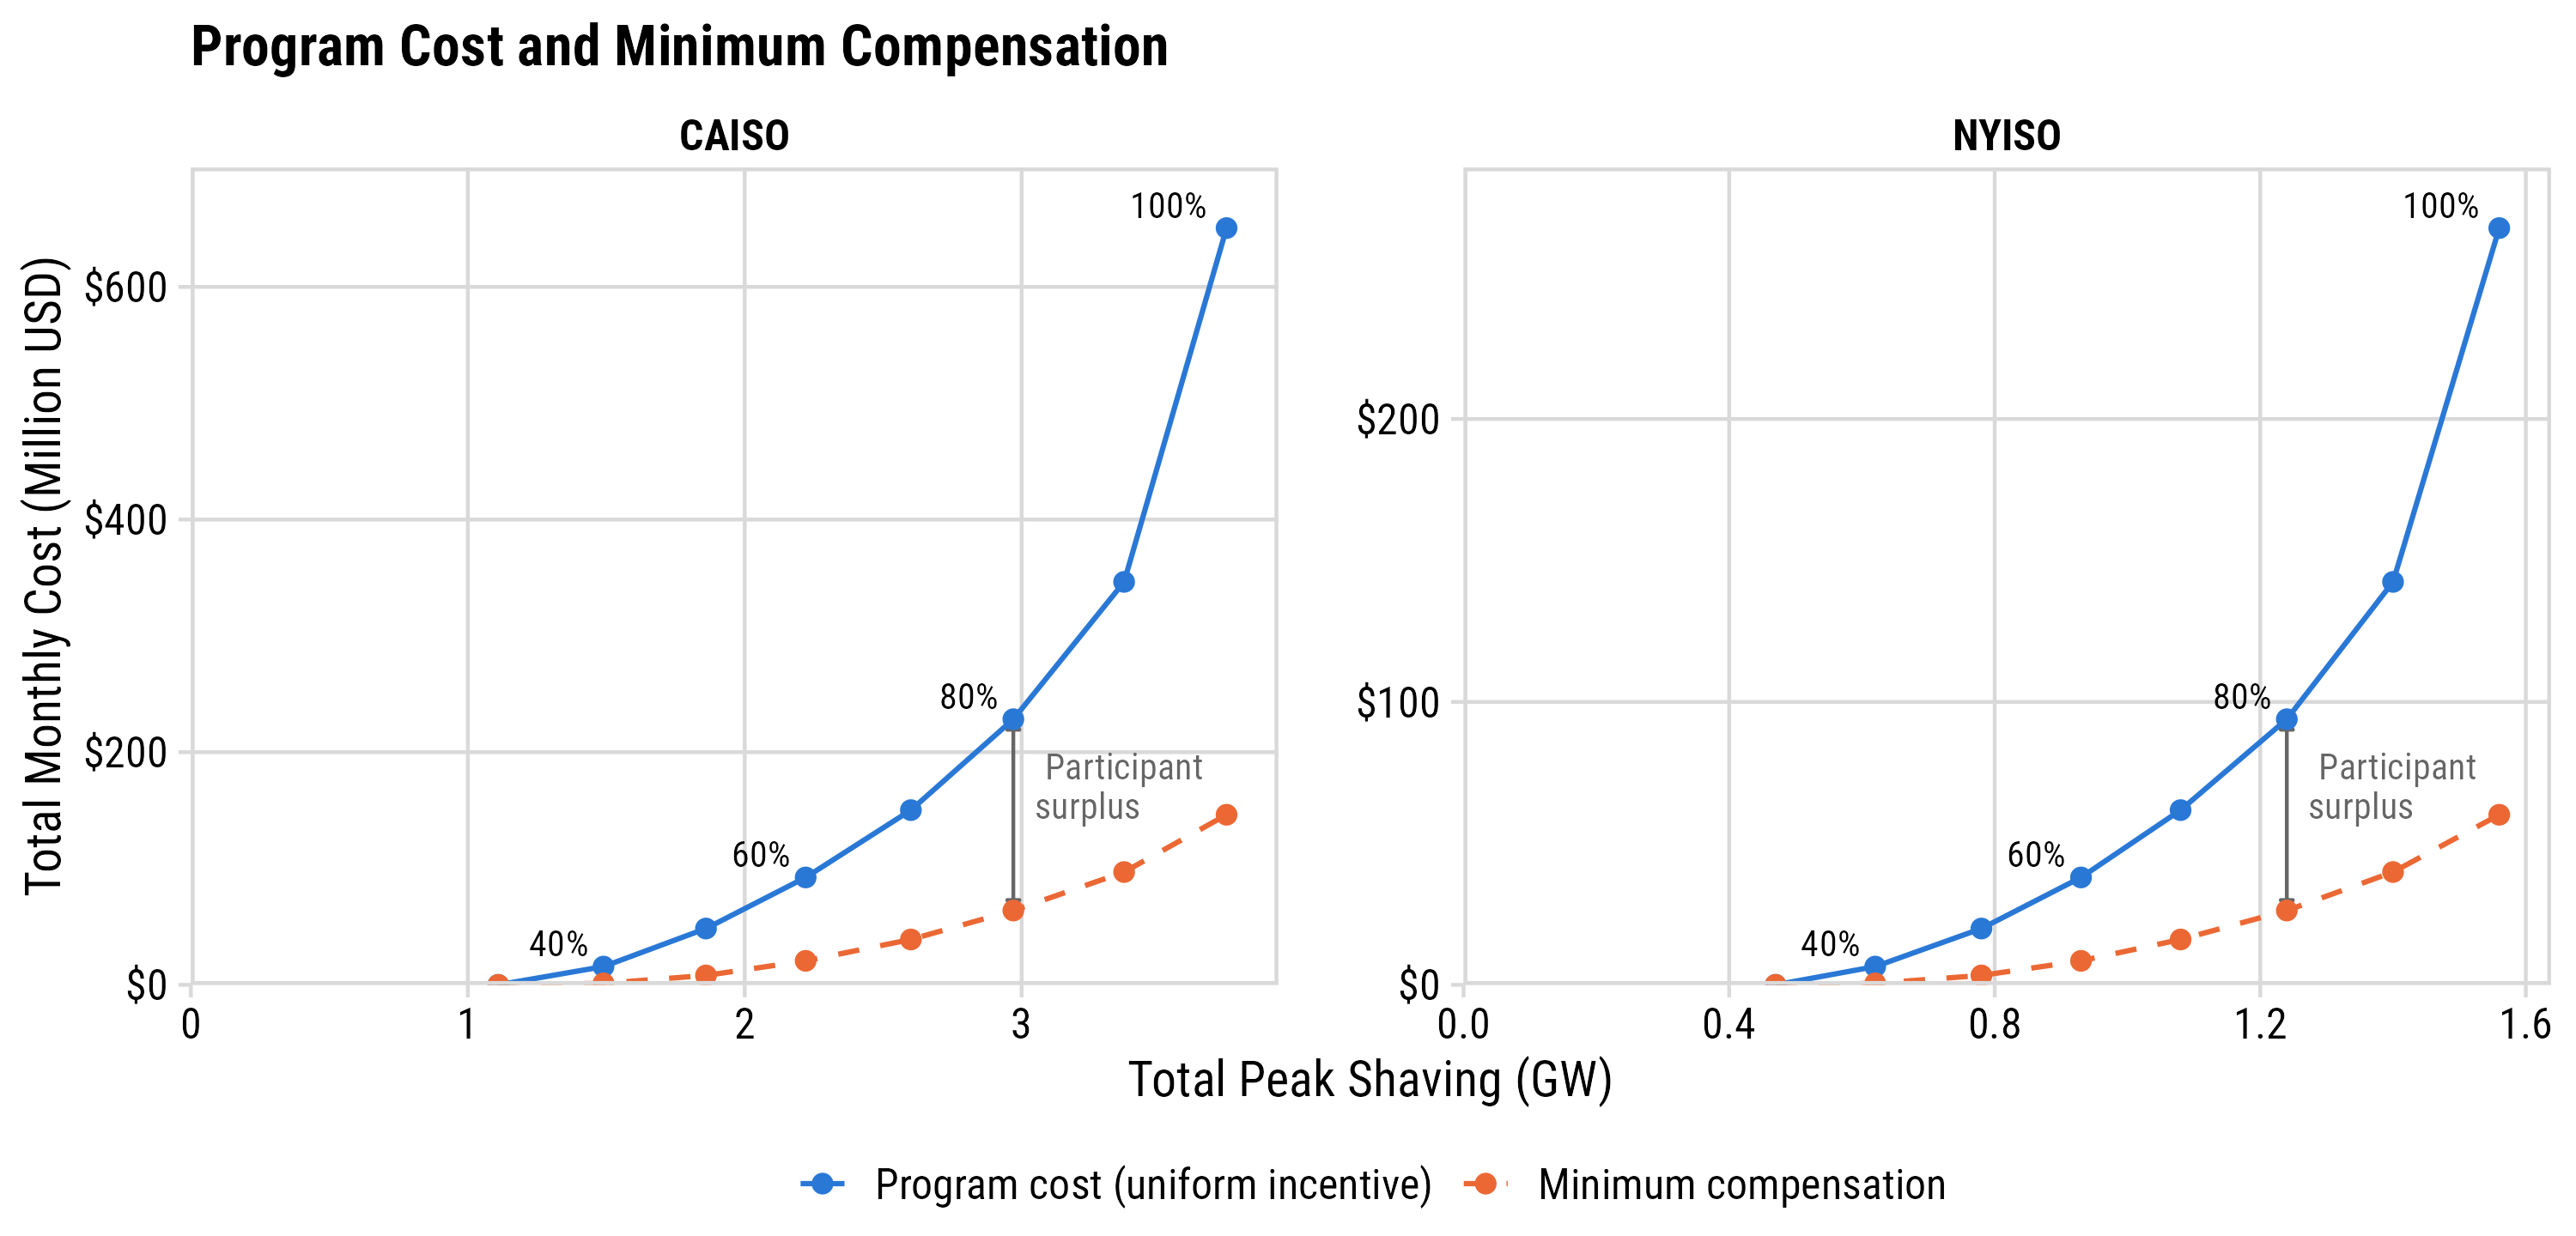
72–92% of uniform payments exceed what enrolled households would accept.
Acknowledgments
Co-authors
Brian Tarroja, Matthew Dean, Kate Forrest (UC Irvine) · Eric Hittinger (RIT) · Alan Jenn (UC Davis) · John Paul Helveston (GWU)
Funding
Alfred P. Sloan Foundation (grant G-2023-20976) · Helveston Lab, George Washington University
Utility partners
Southern California Edison · Pacific Gas & Electric · National Grid

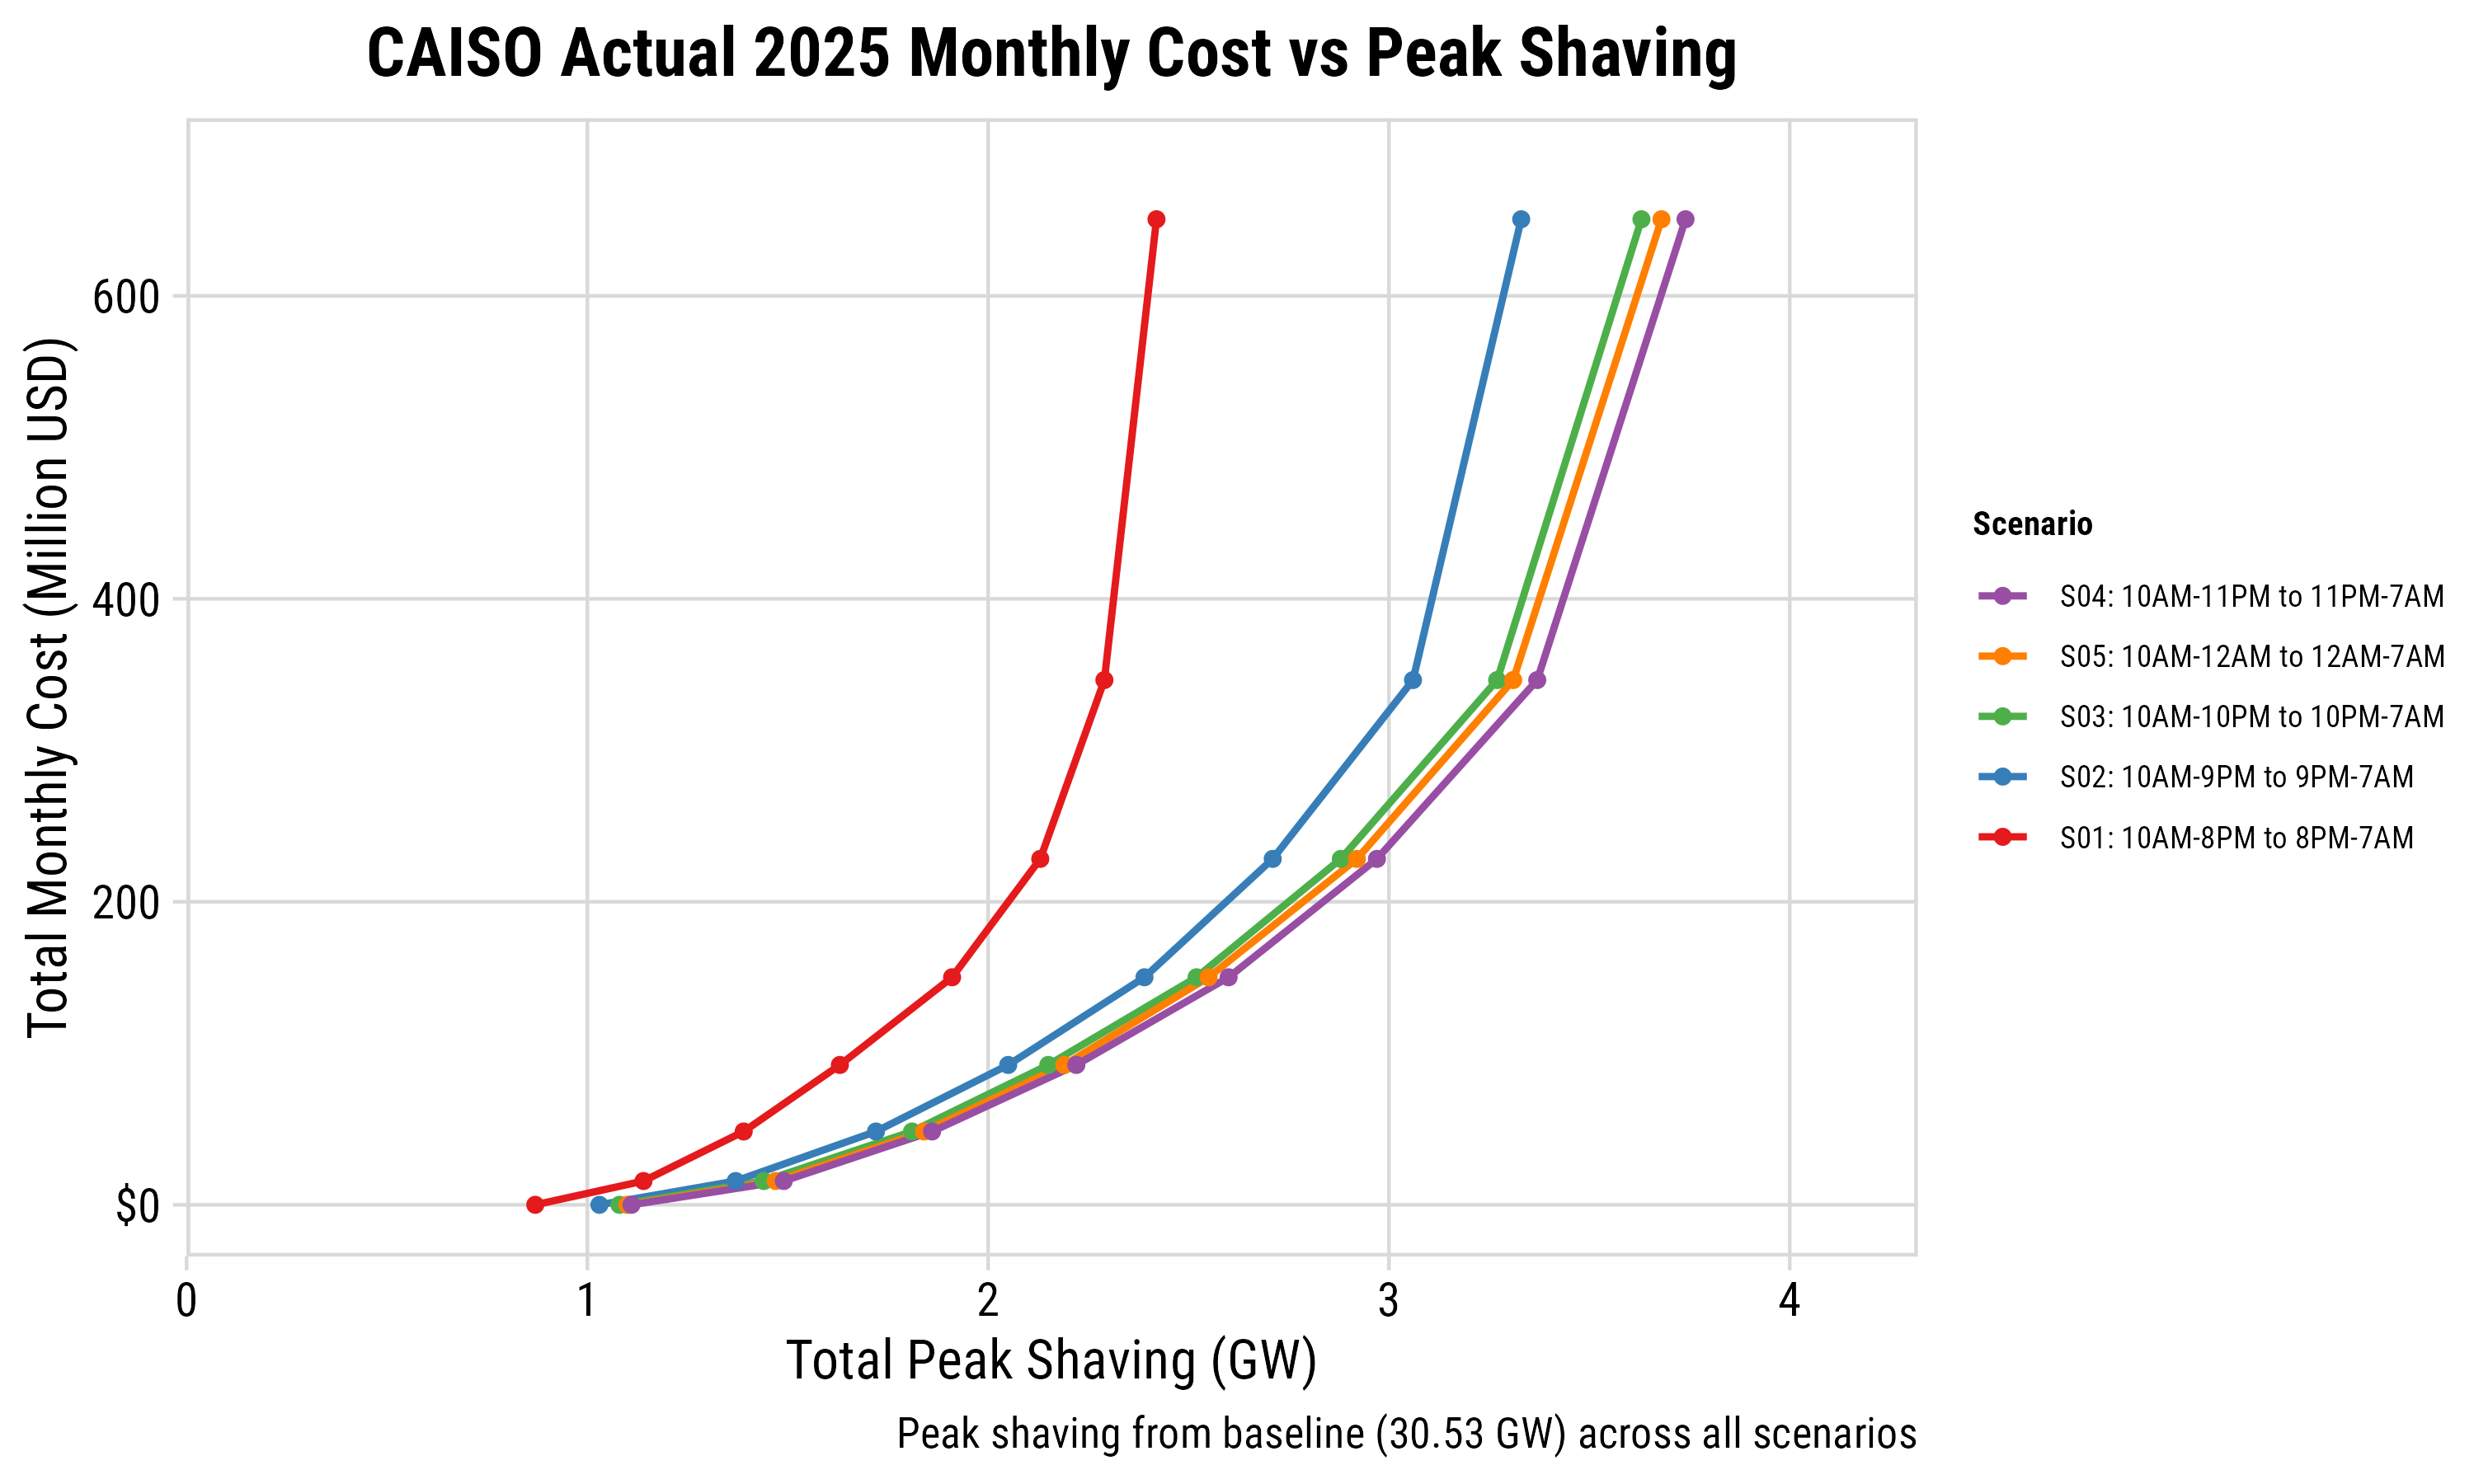
TOU window: 11 PM valley start performs best
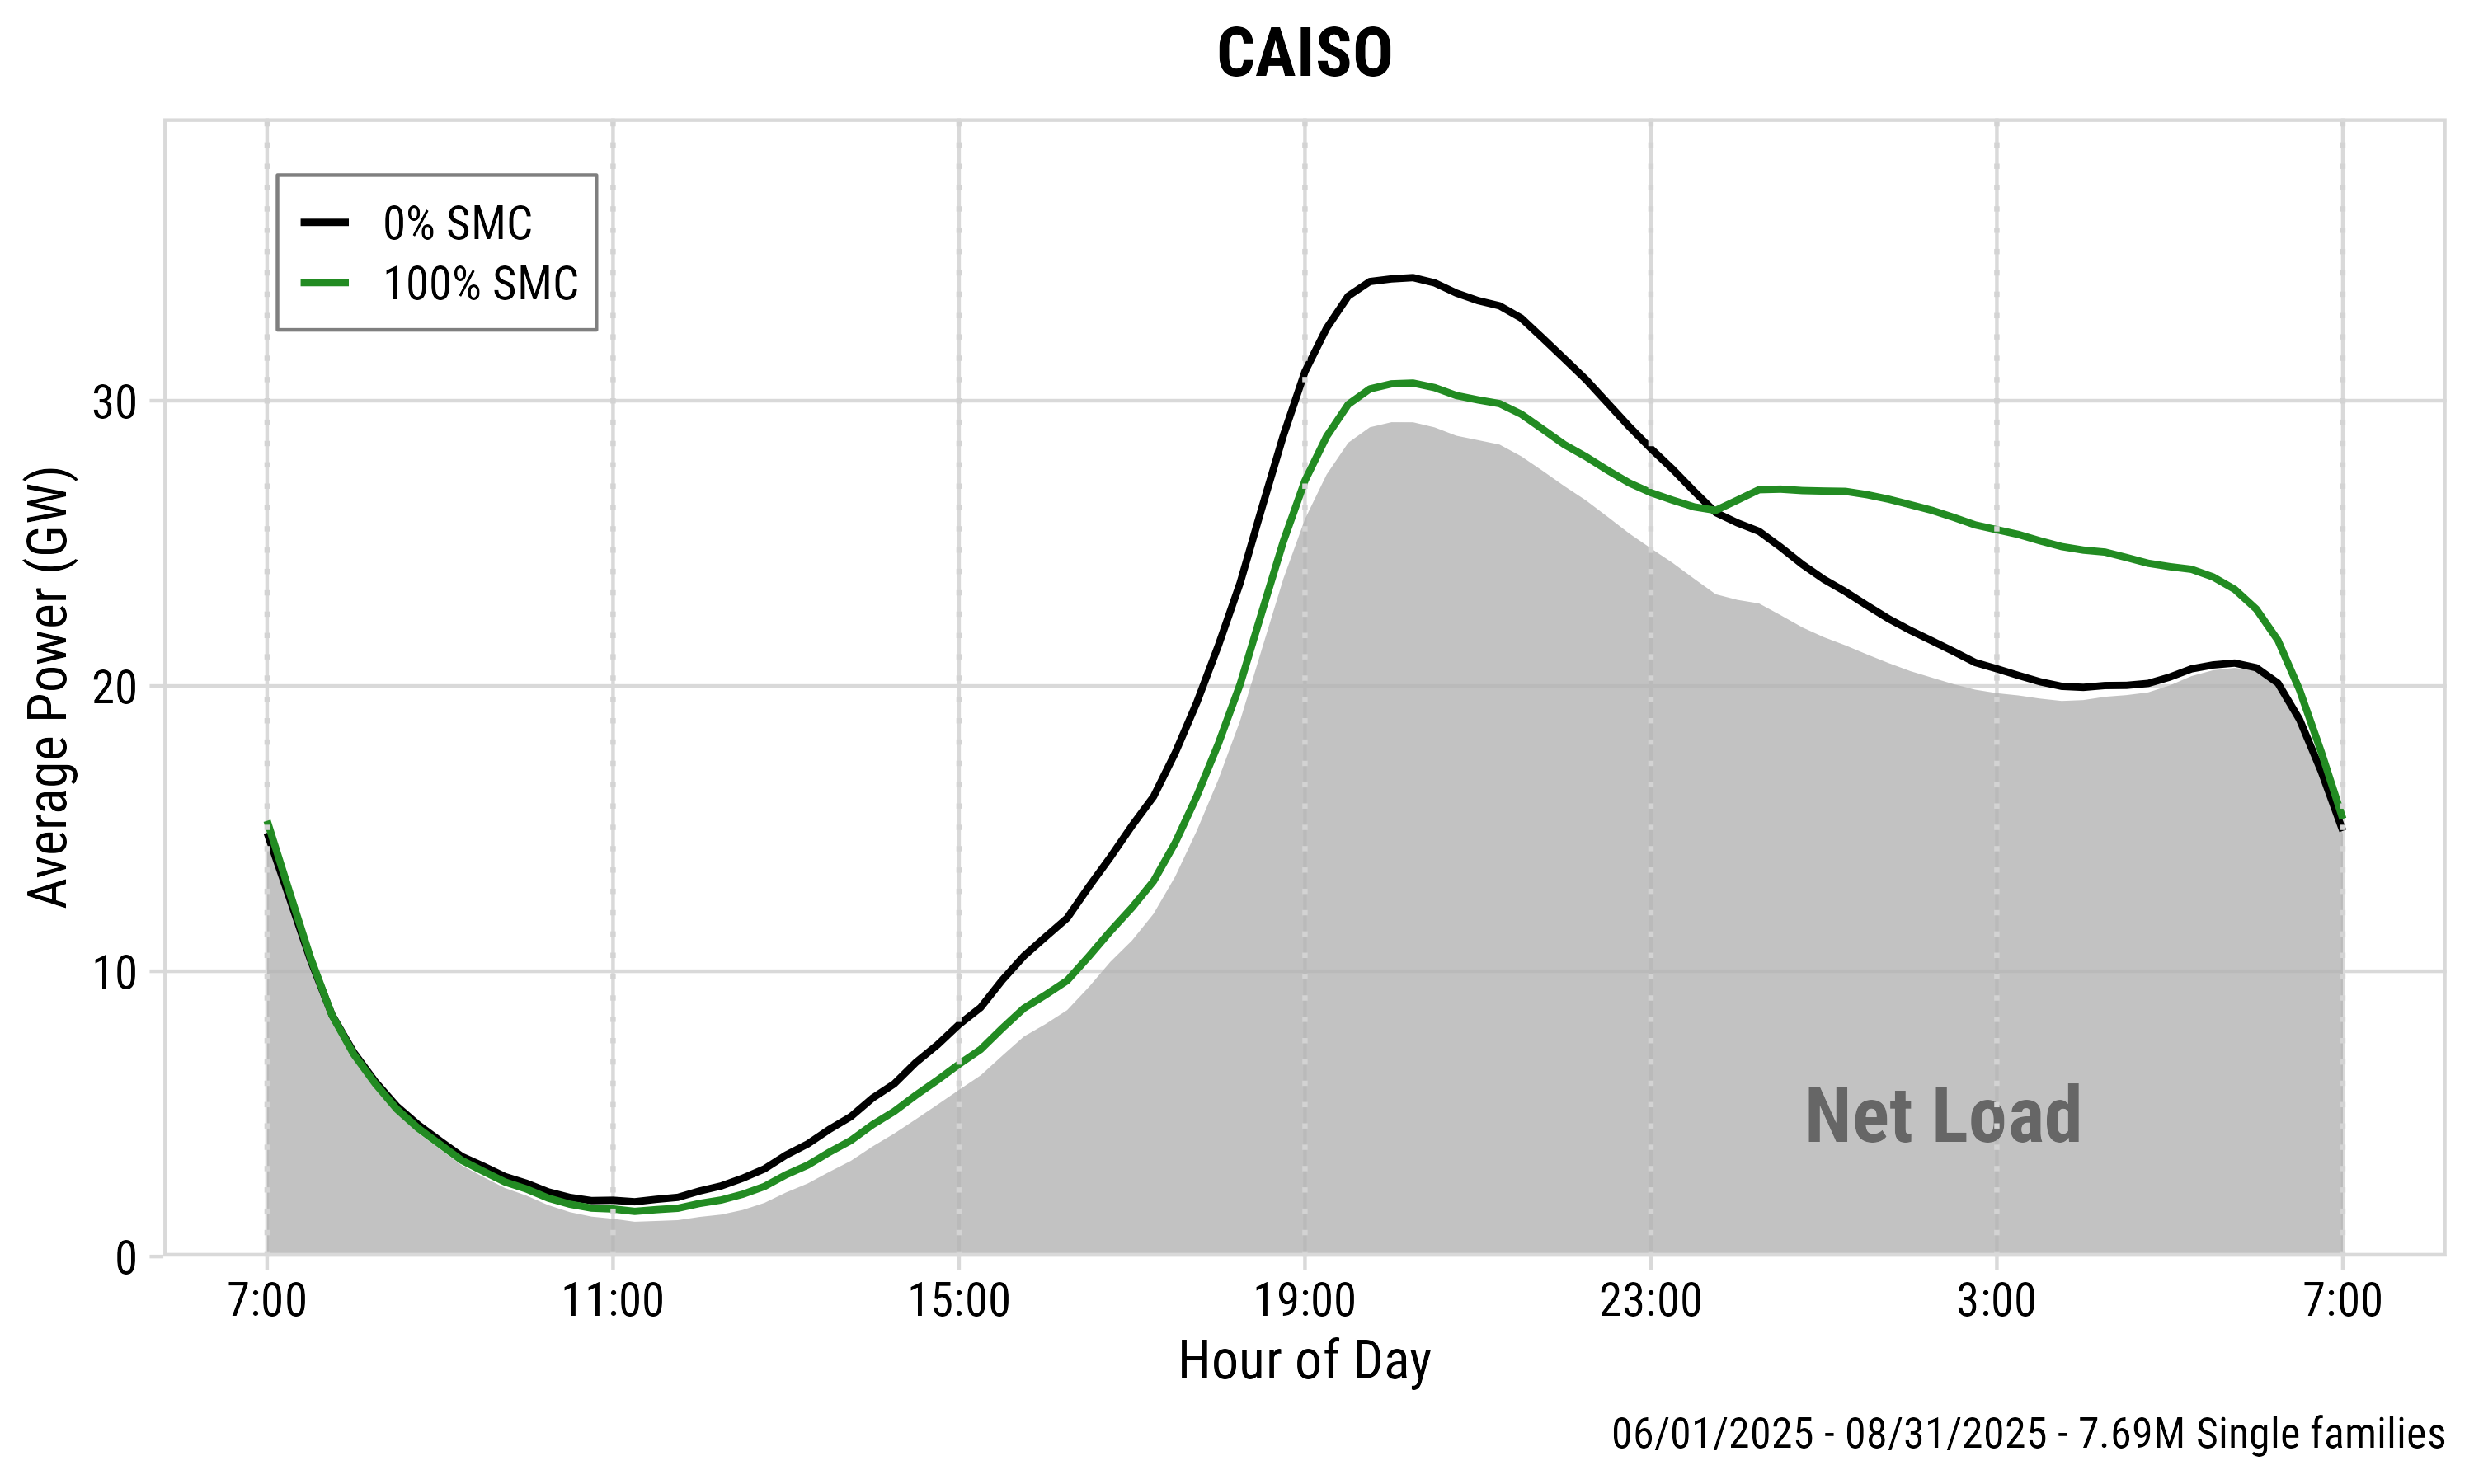
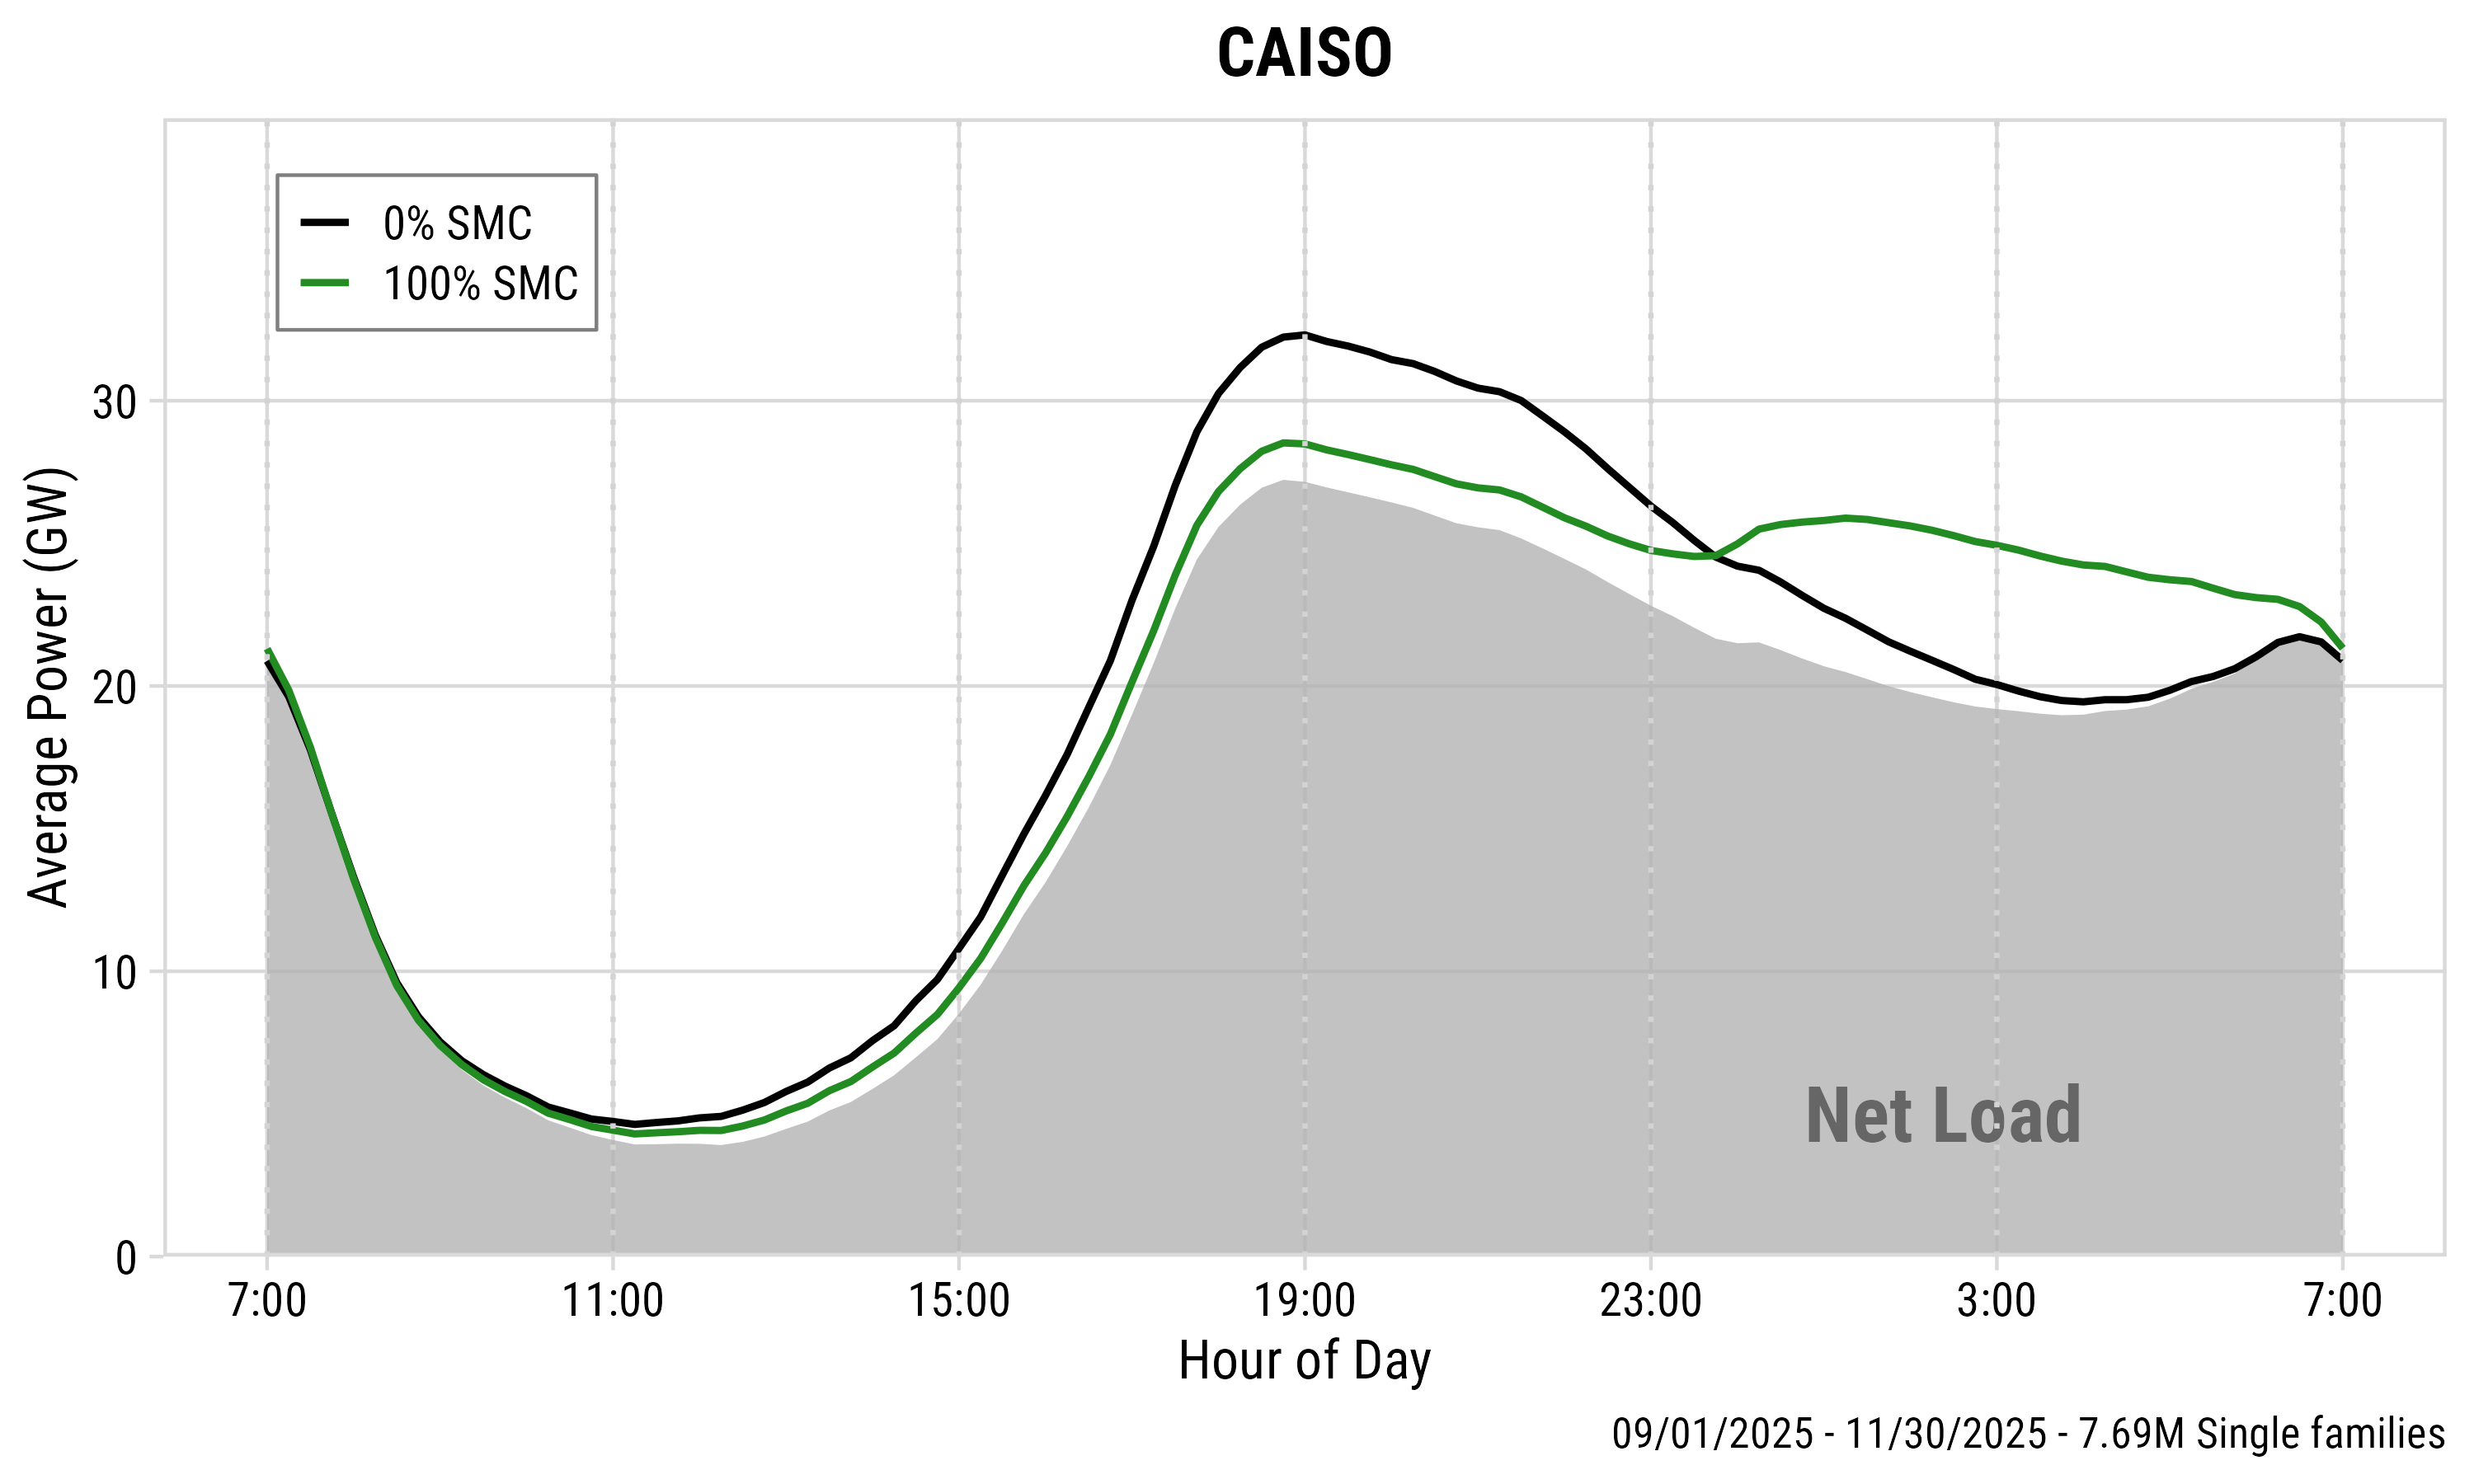
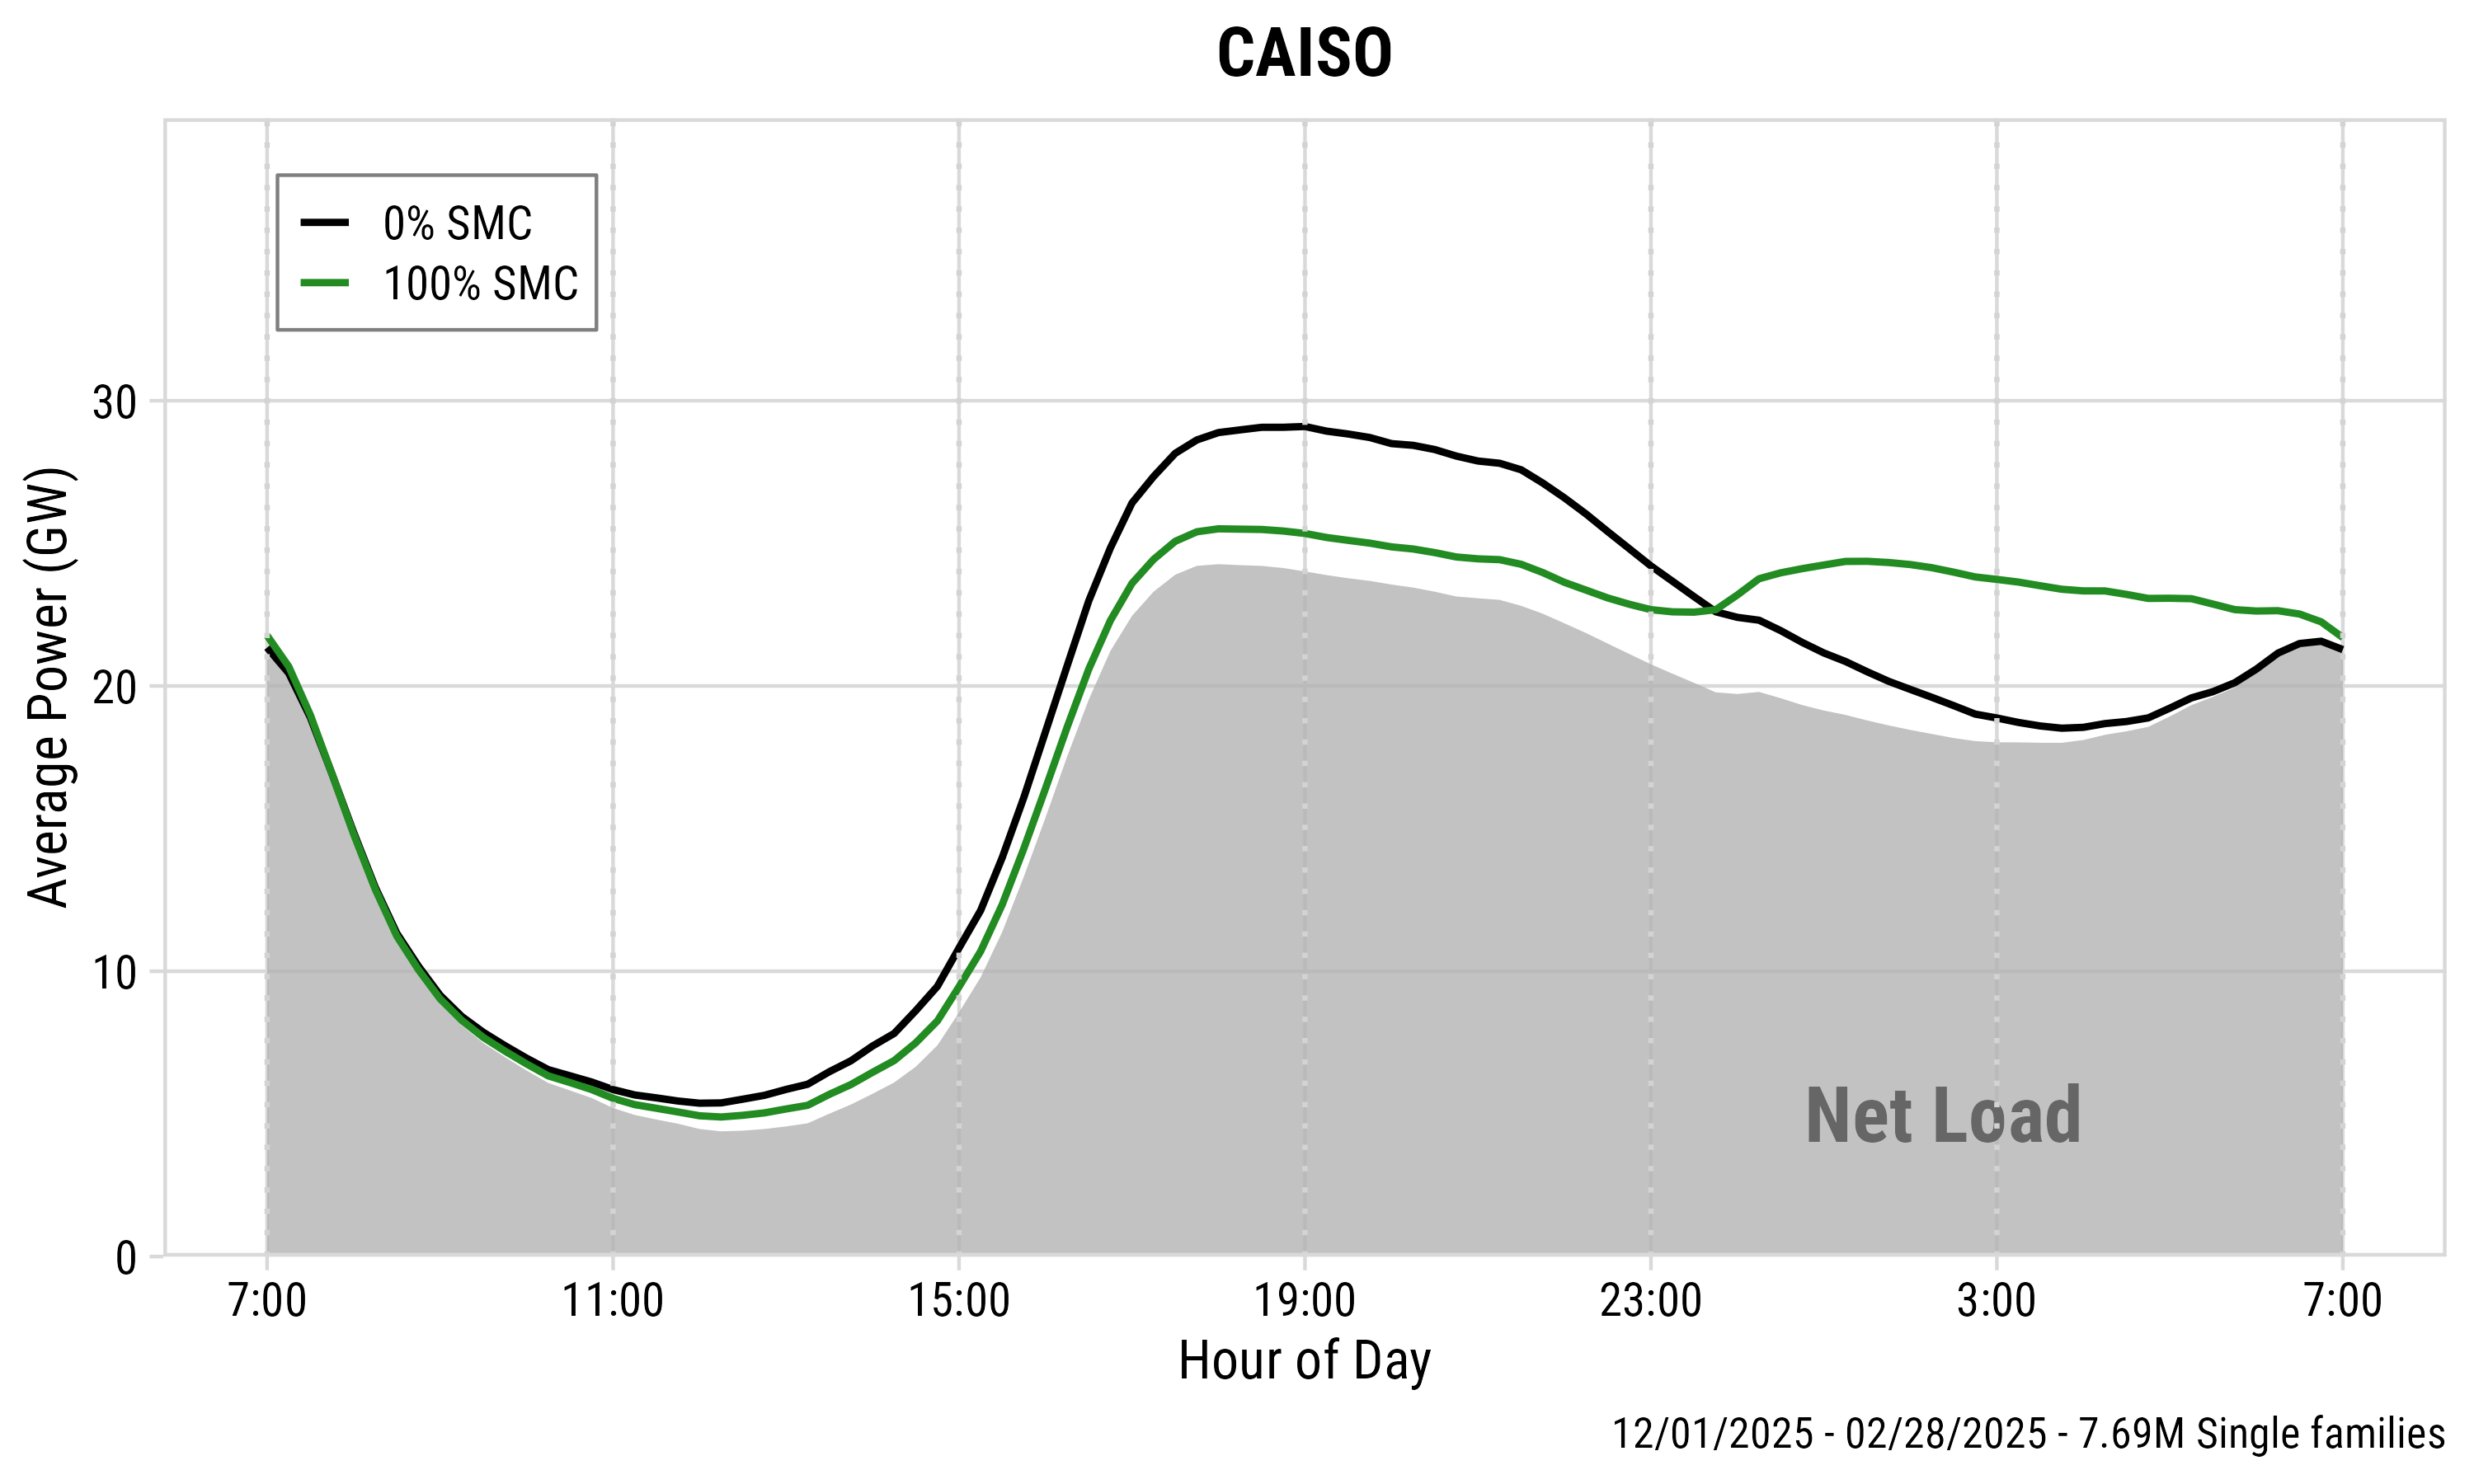
Seasonal Patterns: CAISO
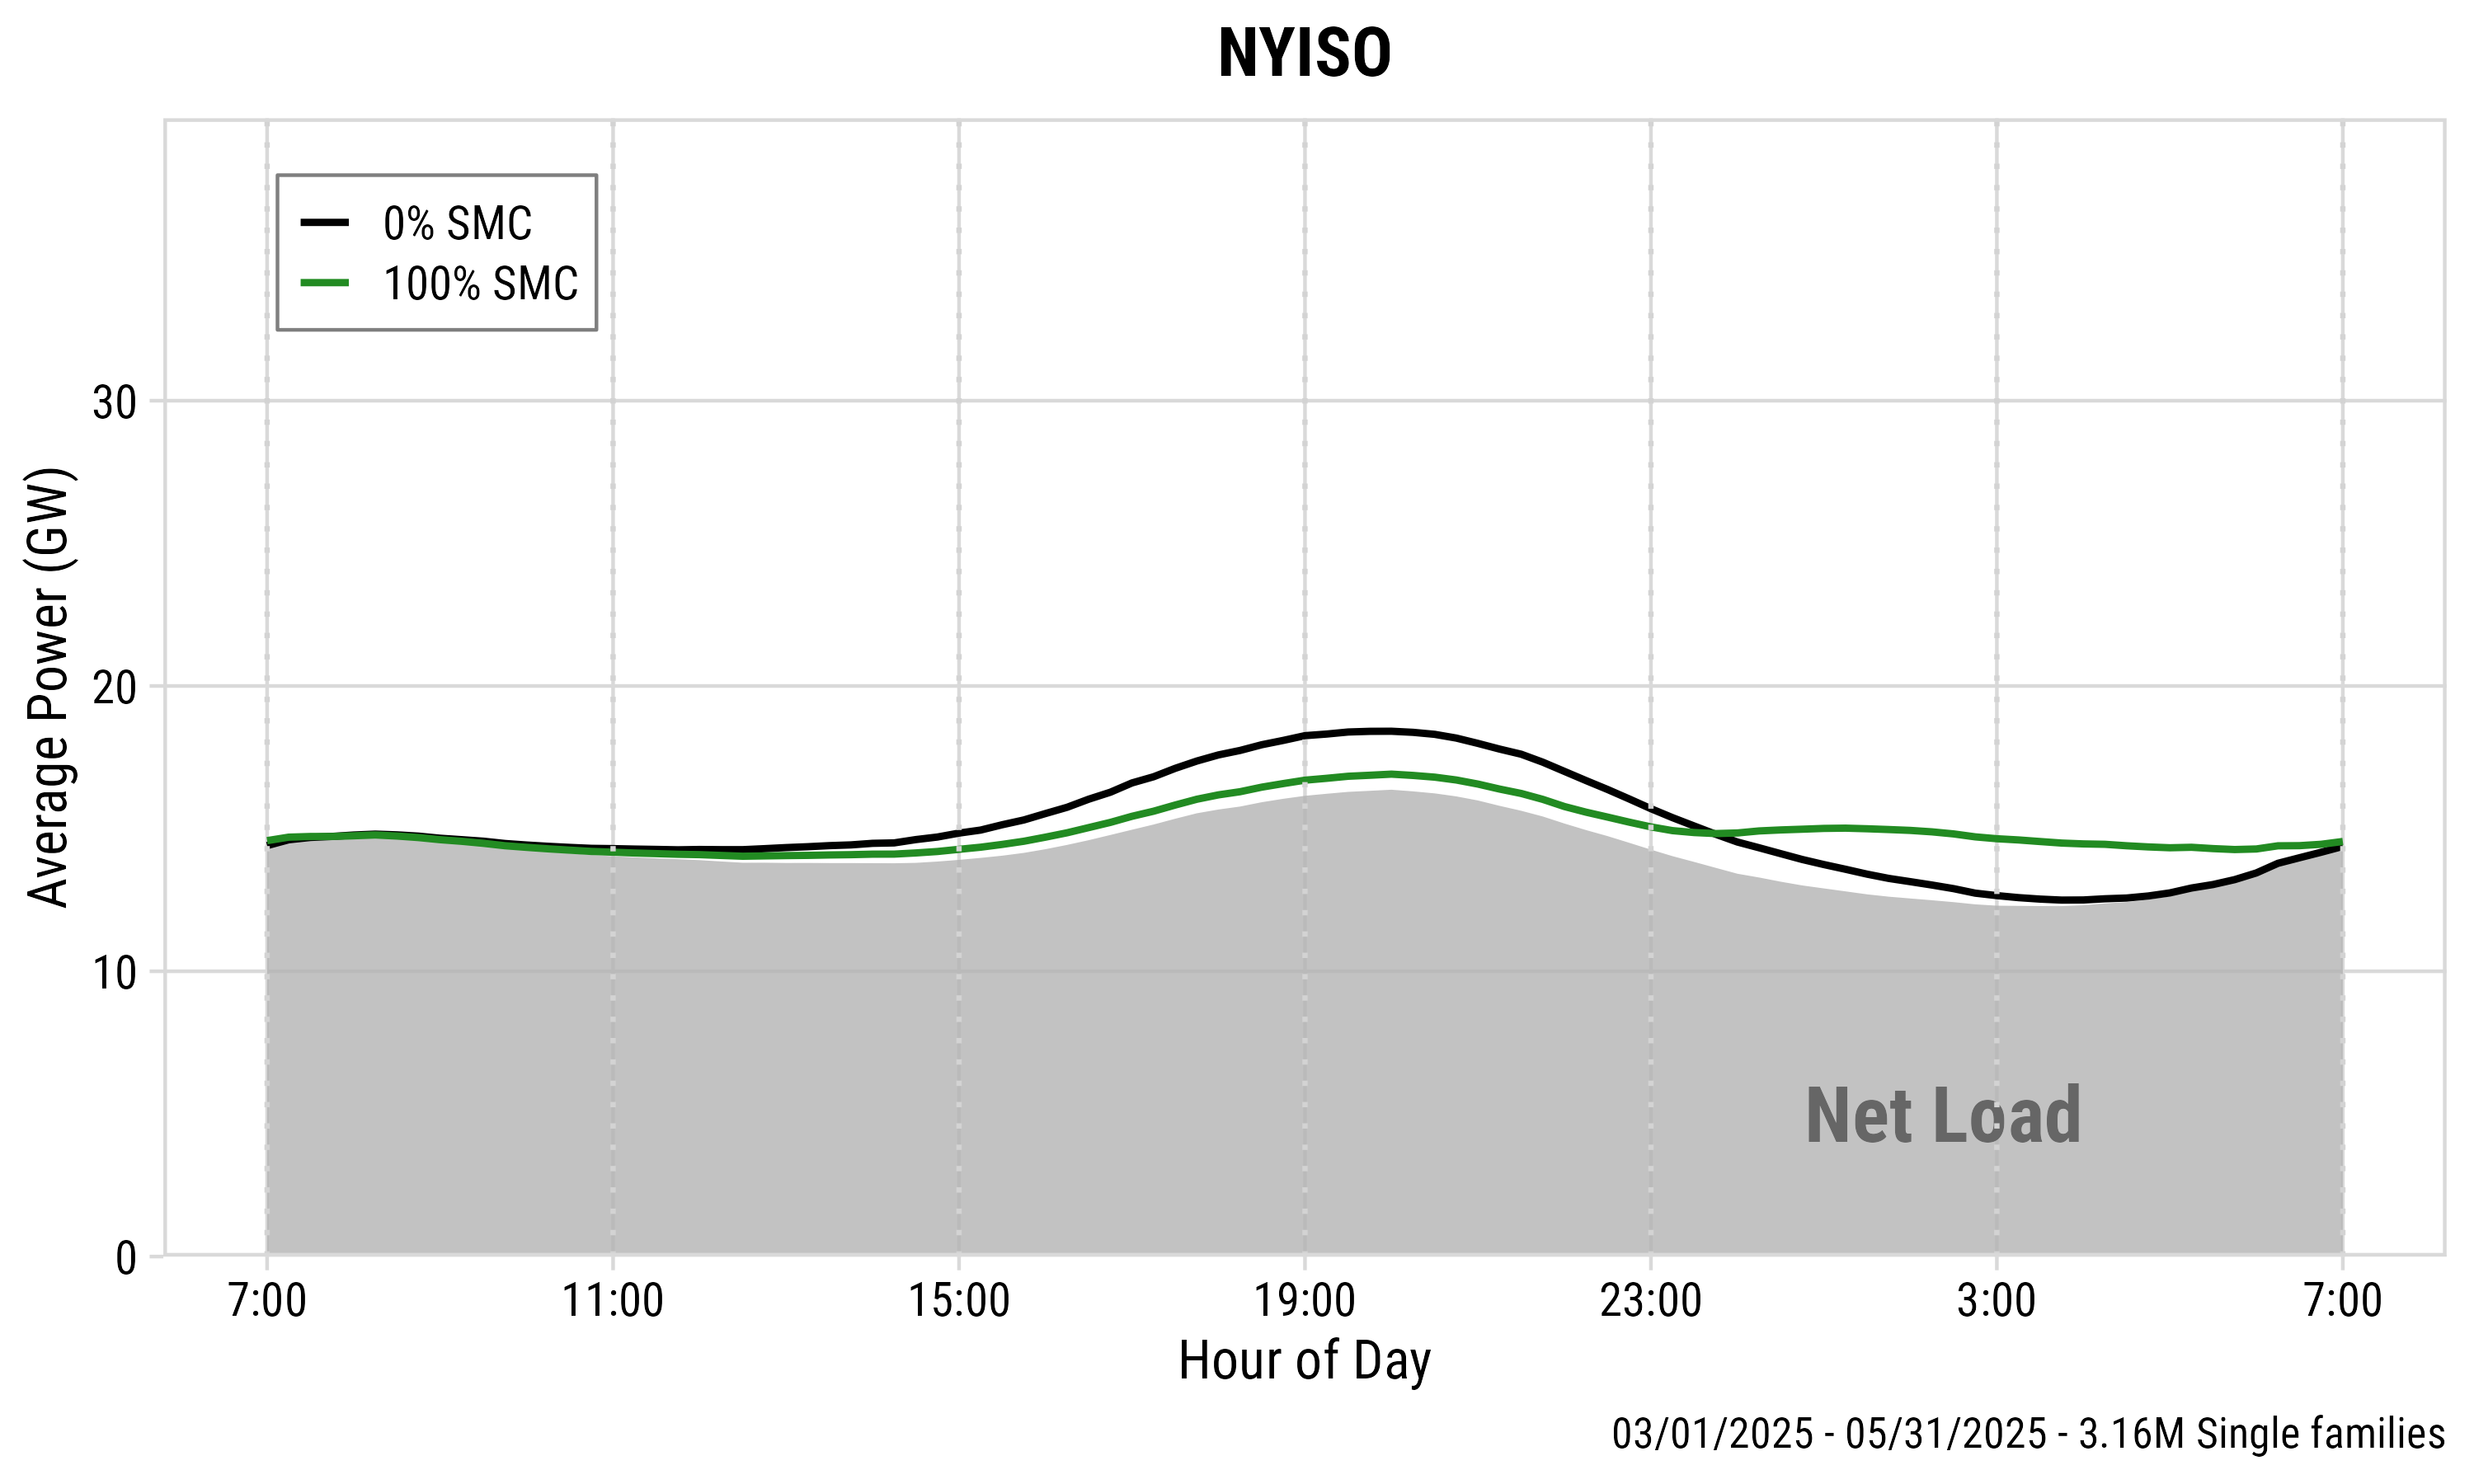
Seasonal Patterns: NYISO
Cost efficiency across BEV adoption rates