| No. | Attributes | Range |
|---|---|---|
| 1 | Enrollment Cash | $50 to $300 |
| 2 | Monthly Cash | $2 to $20 |
| 3 | Monthly Override | 0 to 5 |
| 4 | Min Battery | 20% to 40% |
| 5 | Guaranteed Battery | 60% to 80% |
Acknowledgments
Advisor
Dr. John Paul Helveston
Examining Committee
Dr. Caitlin Grady · Dr. Johan René van Dorp (presiding) · Dr. Eric Hittinger
Research Teams
Smart charging team (GWU · UC Davis · UC Irvine · RIT) & the surveydown team
Family
Mr. Sixiang Hu (father) · Ms. Chunzhi Ping (mother) · Ms. Yangyang Li (wife)


EV sales in US reaching ~10% of sales
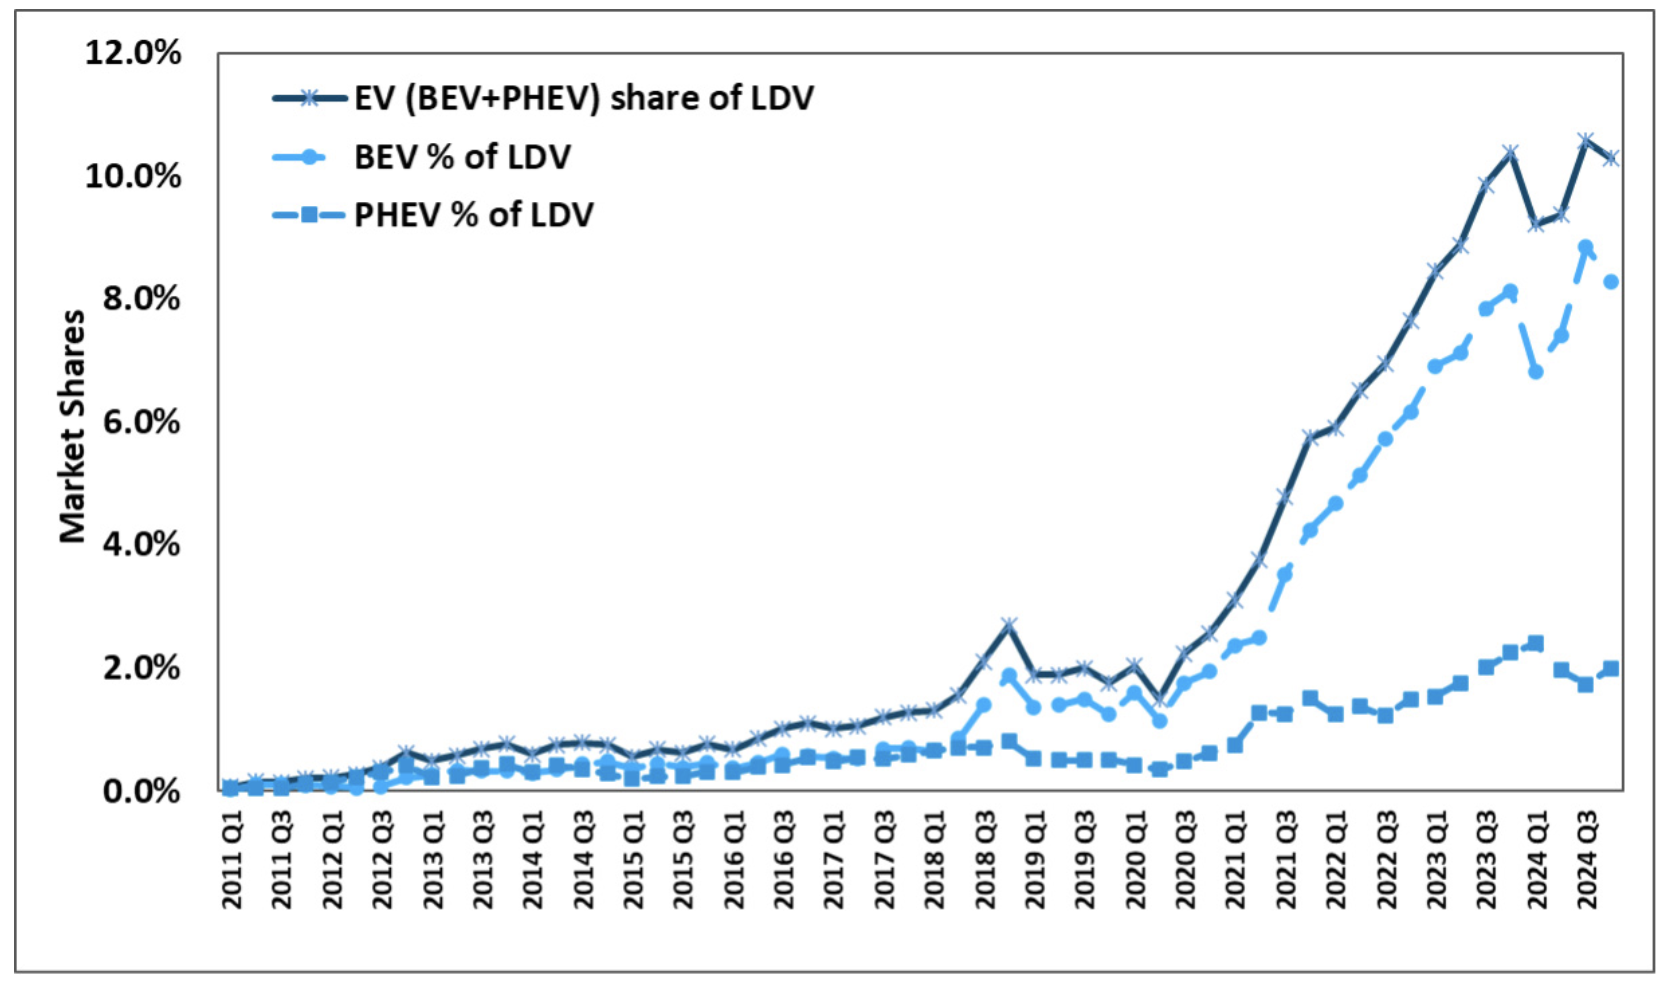
Source: Argonne National Lab, www.anl.gov/ev-facts/model-sales
Introduction
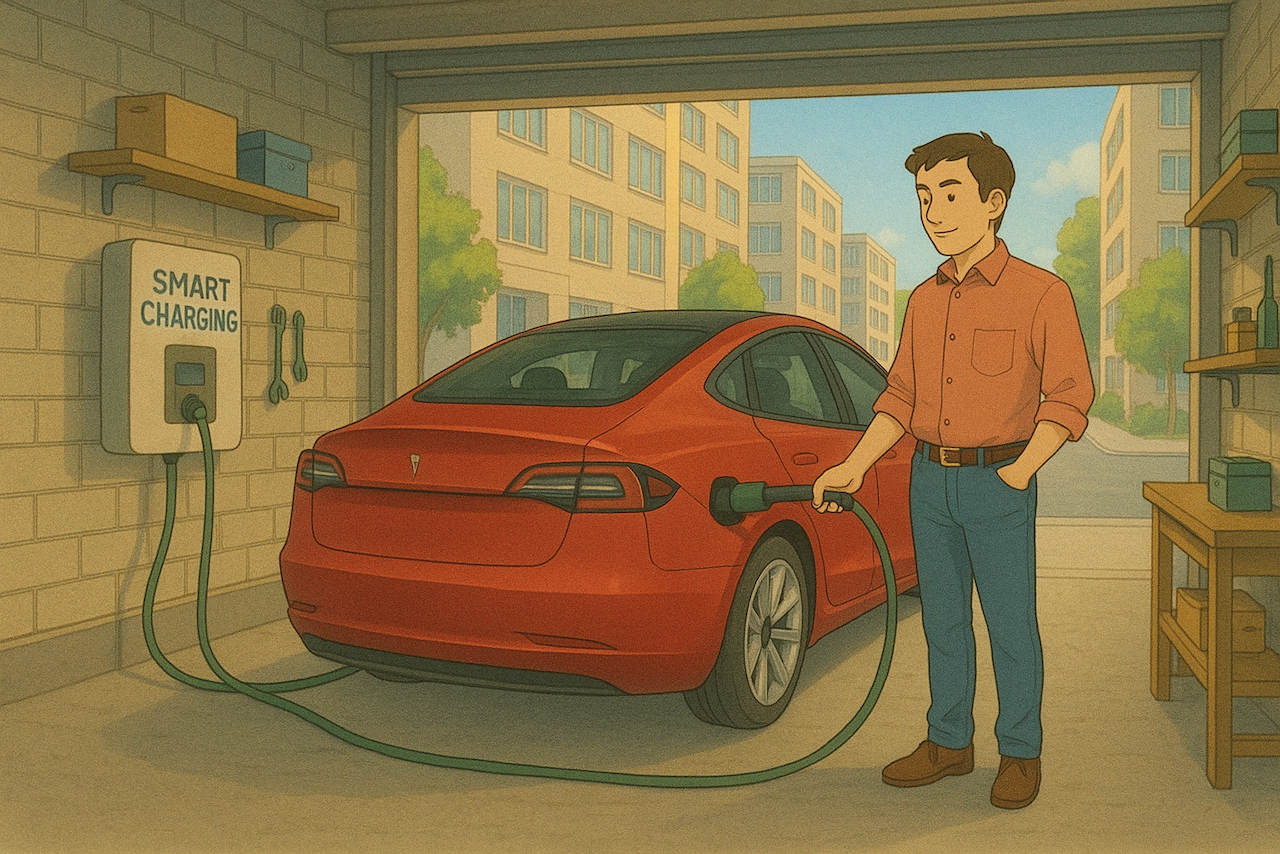
- Unmanaged BEV charging is becoming a problem to the grid.
- Managed charging is cheaper and smooths out the grid load.
- Smart charging: Supplier-Managed Charging (SMC) and Vehicle-to-Grid (V2G).
SMC - Supplier Managed Charging
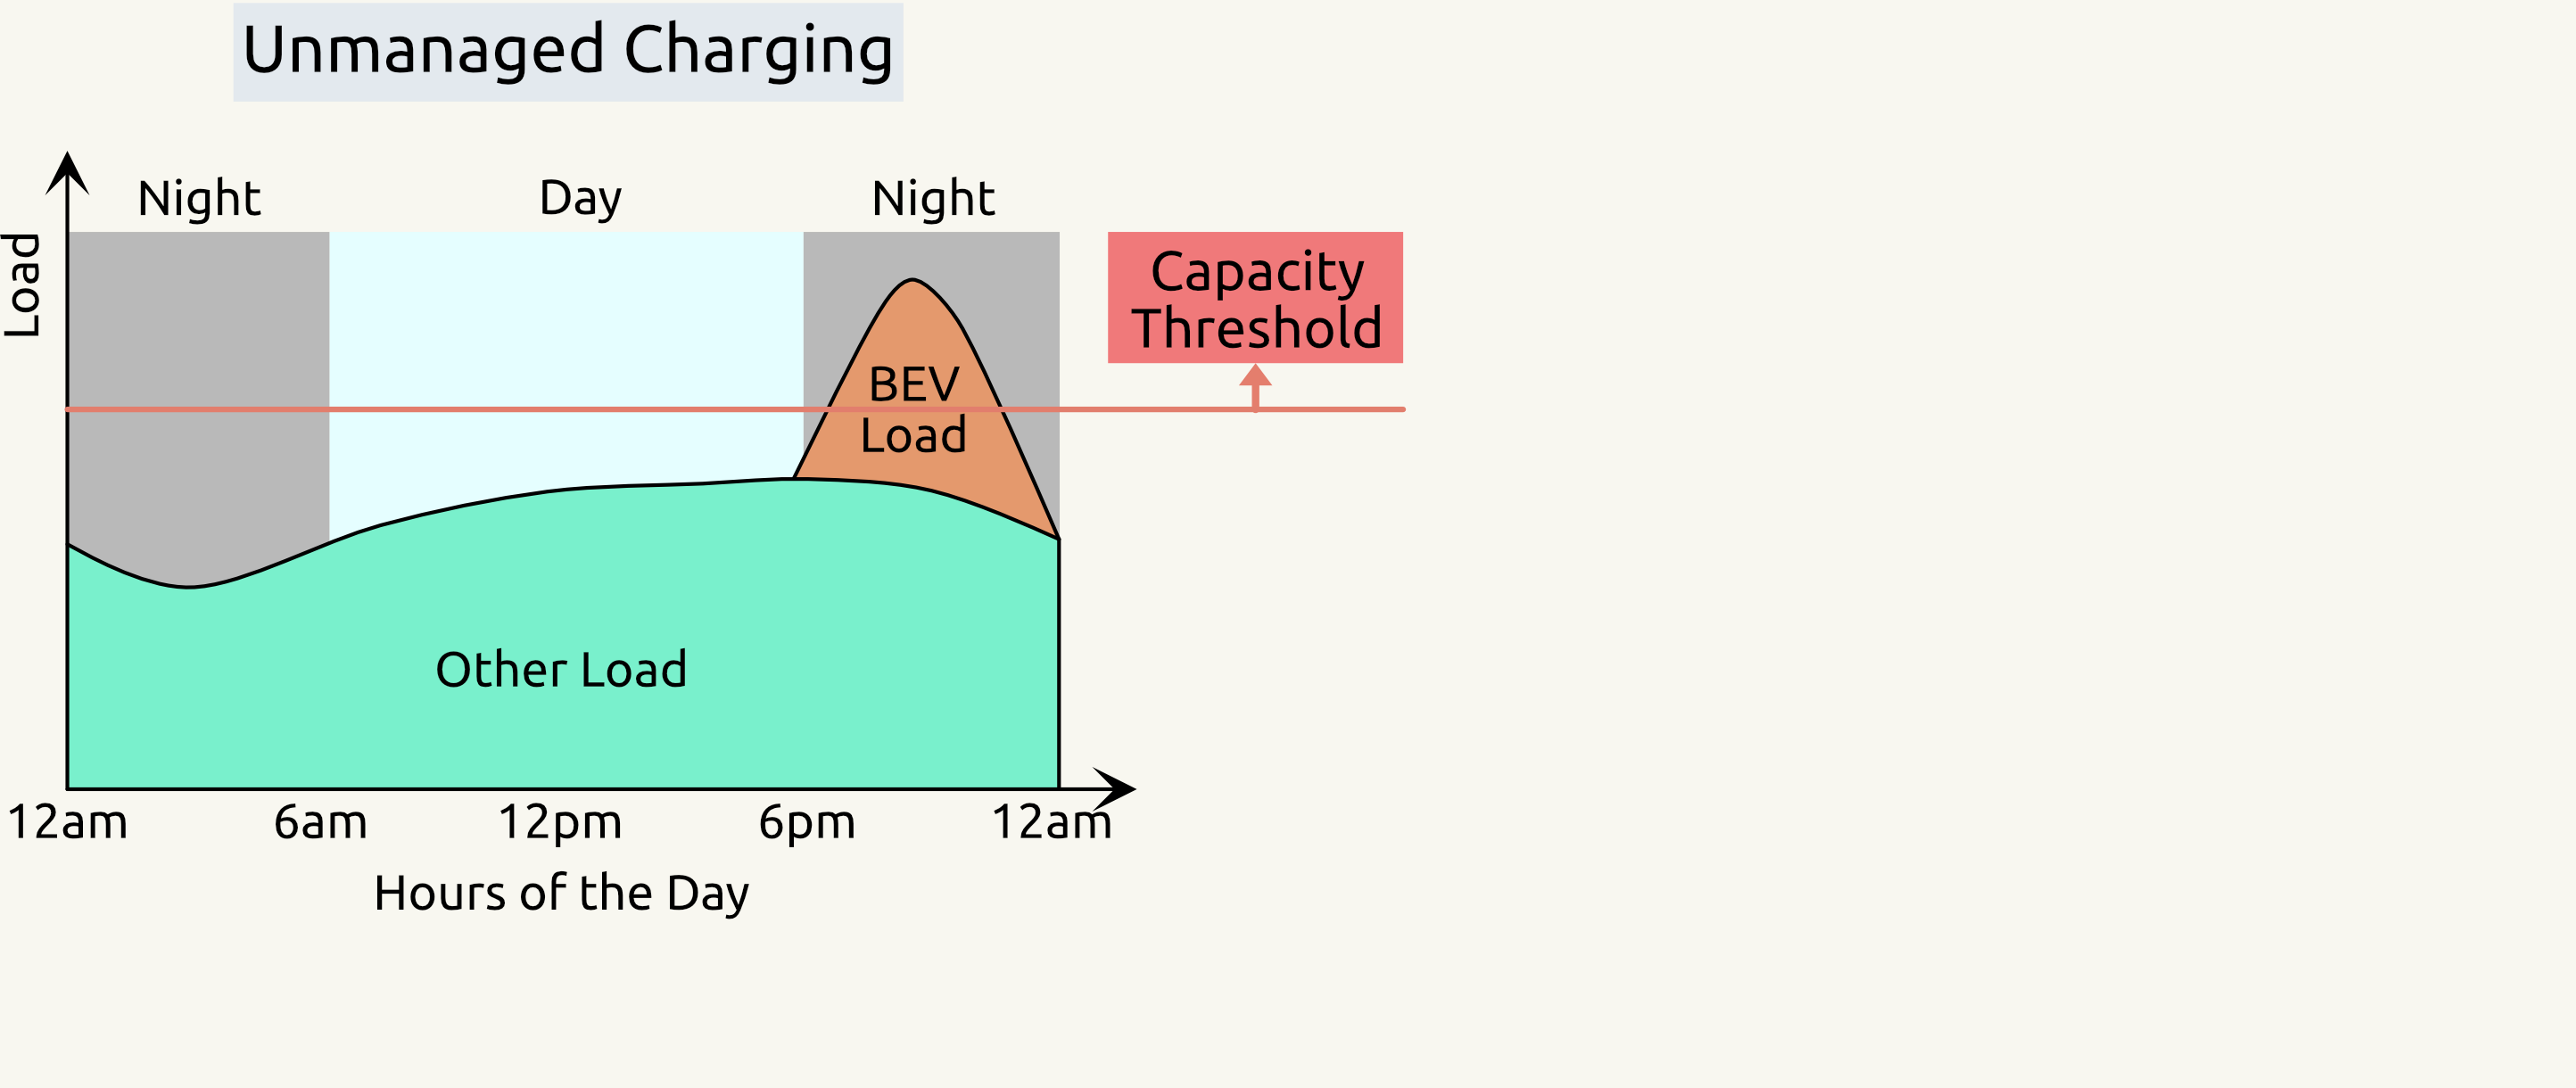
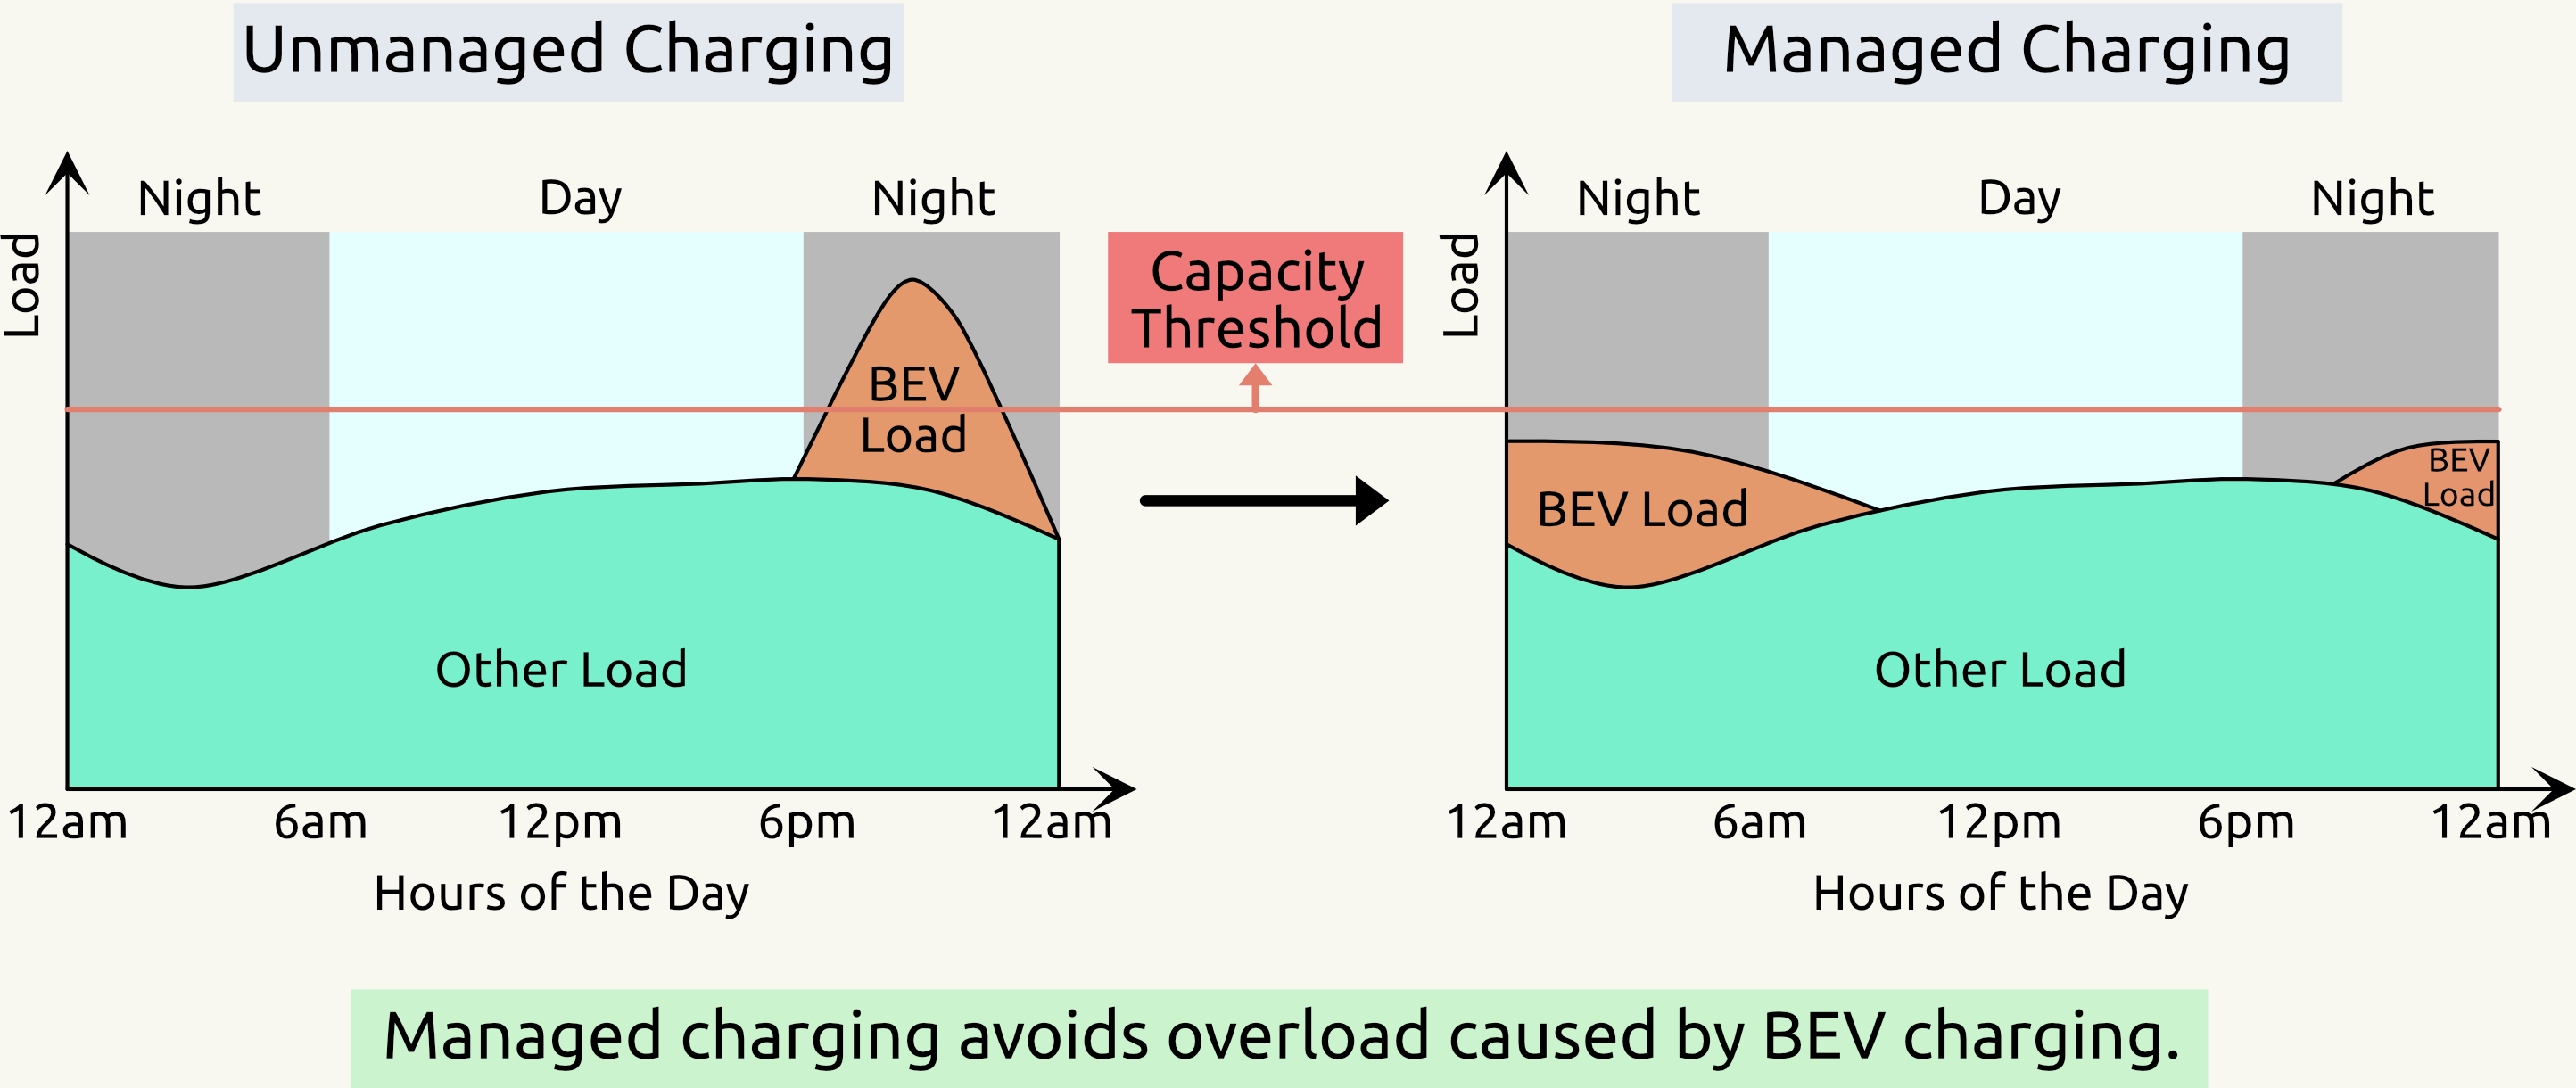
- SMC smooths out the BEV charging spike (called “Peak-shaving”).
- Electricity demand is controlled below the capacity threshold.
- It saves money and reduces pollution.
SMC - Supplier Managed Charging
- SMC smooths out the BEV charging spike (called “Peak-shaving”).
- Electricity demand is controlled below the capacity threshold.
- It saves money and reduces pollution.
V2G - Vehicle-to-Grid
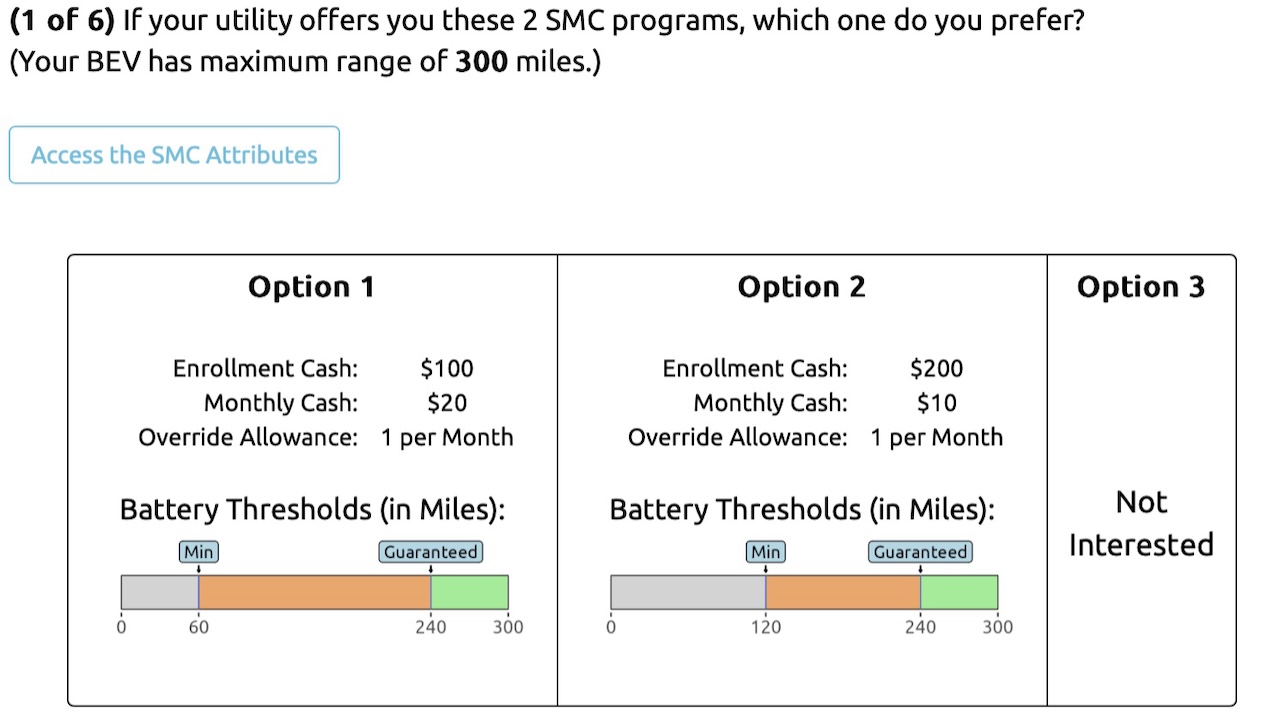
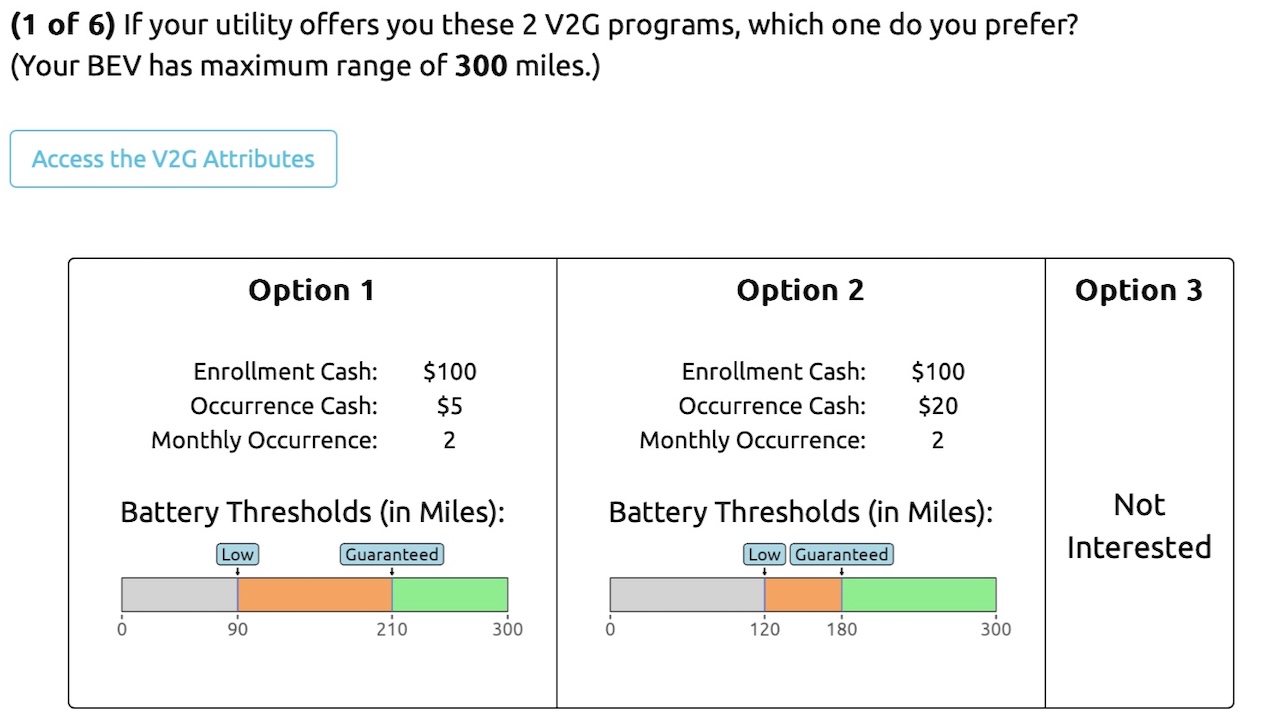
Conjoint Question Explained
A Sample Conjoint Question
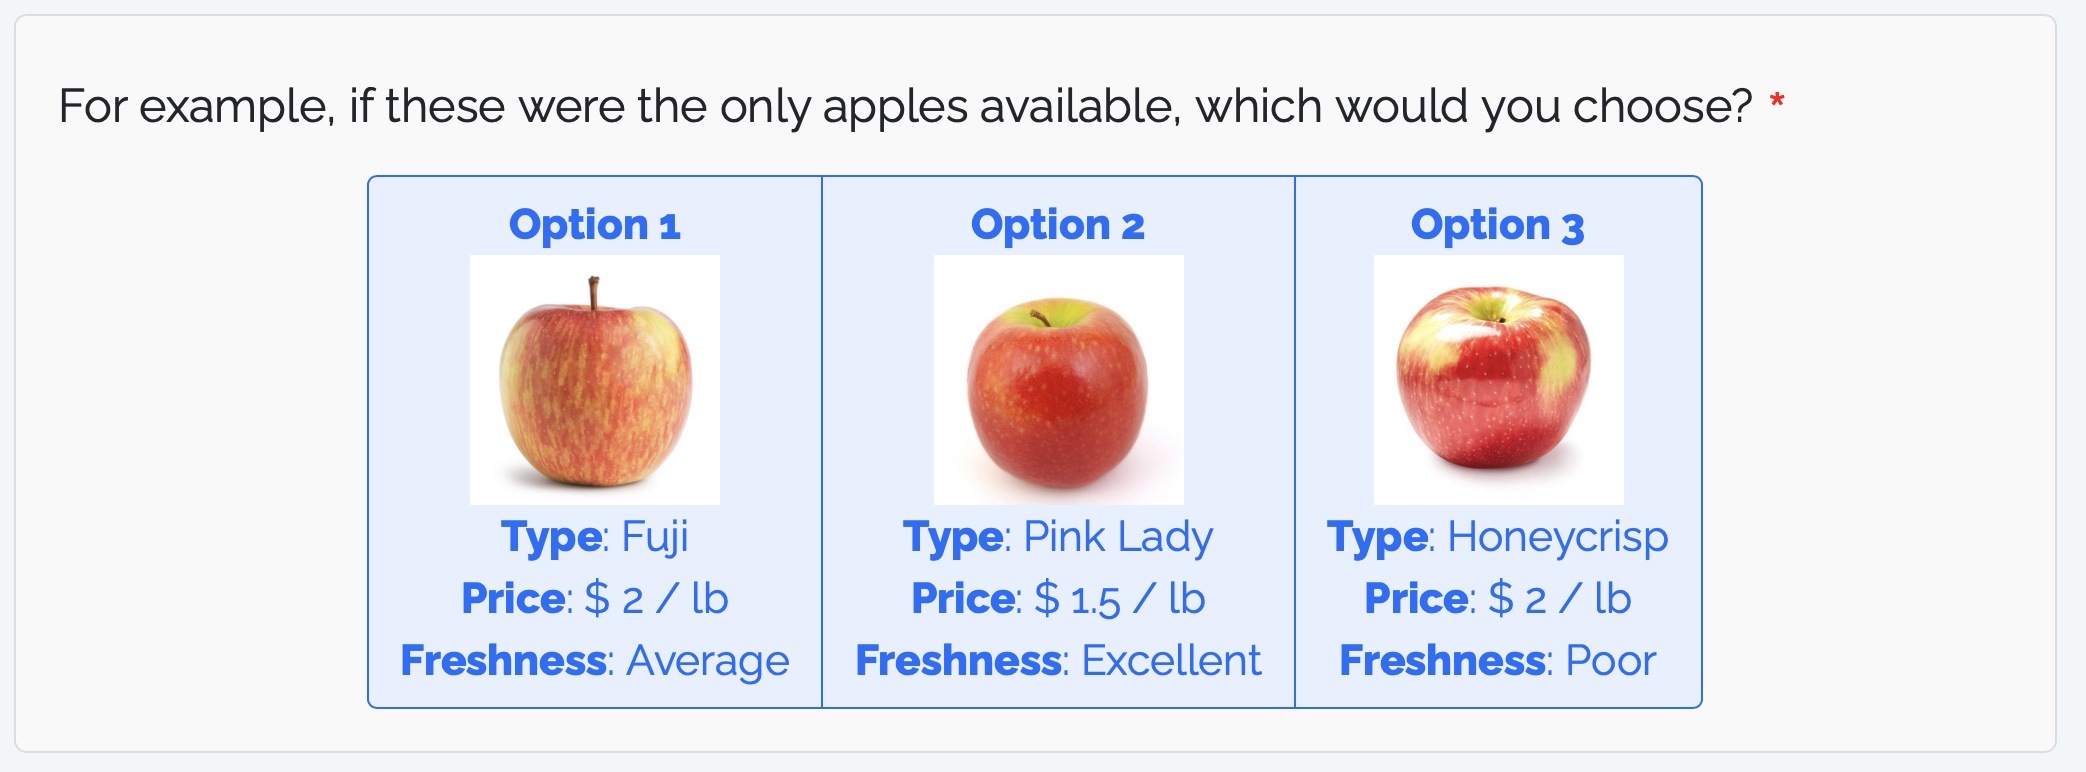
- Provide respondents with different sets of attributes.
- Observe choices across random sets.
- Estimate utility of each attribute.
SMC Programs
Attributes
Sample Program
| Attributes | Values |
|---|---|
| Enrollment Cash | $300 |
| Monthly Cash | $20 |
| Override Allowance | 5 |
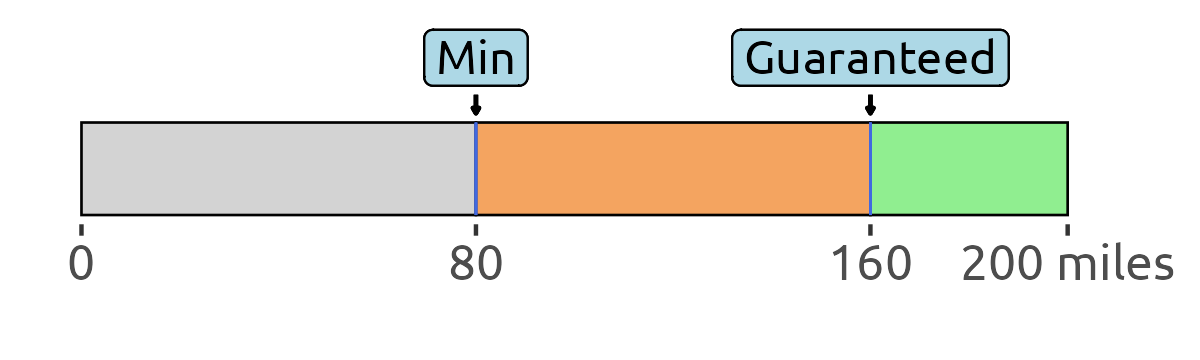
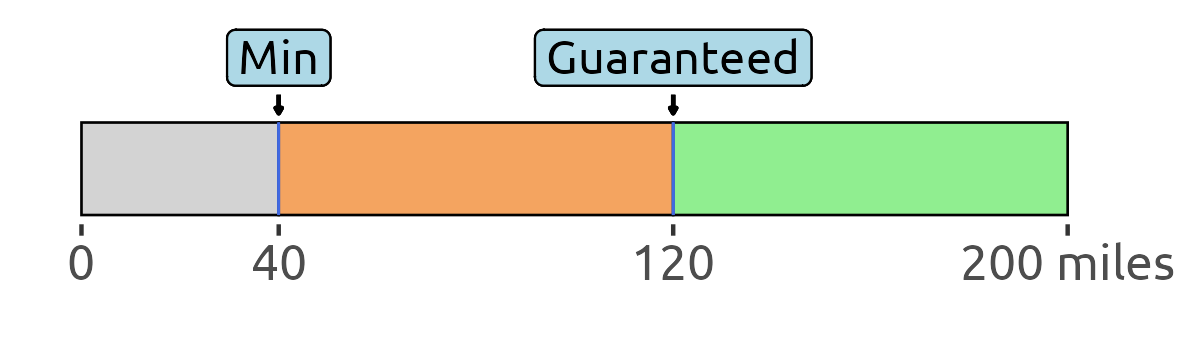
(Range determined by stated vehicle they own)
V2G Programs
Attributes
| No. | Attributes | Range |
|---|---|---|
| 1 | Enrollment Cash | $50 to $300 |
| 2 | Occurrence Cash | $2 to $20 |
| 3 | Monthly Occurrence | 1 to 4 |
| 4 | Lower Bound | 20% to 40% |
| 5 | Guaranteed Battery | 60% to 80% |
Sample Program
| Attributes | Values |
|---|---|
| Enrollment Cash | $300 |
| Occurrence Cash | $20 |
| Monthly Occurrence | 1 |
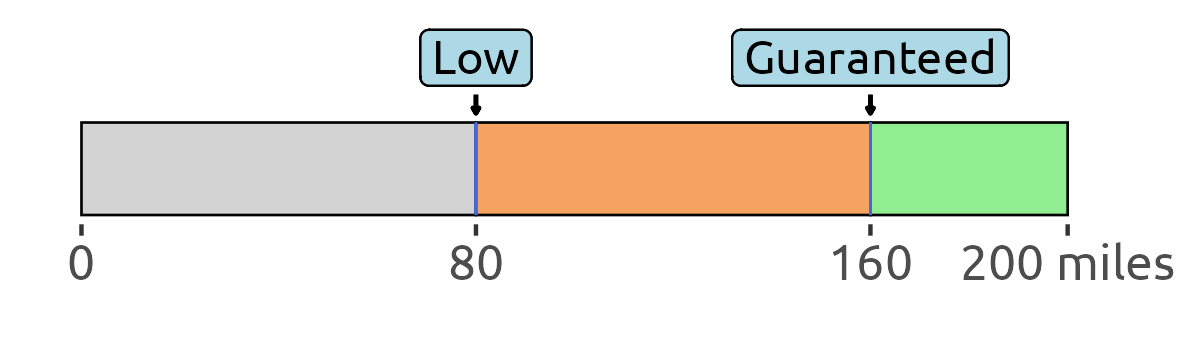
(Range determined by stated vehicle they own)
Sample SMC Question
Sample V2G Question
Survey Fielding - 1,356 in Total

Meta Ads: Voluntary participants
- 803 responses
- March to July in 2024
Dynata Recruitment: Paid survey
- 553 responses
- September to November in 2024
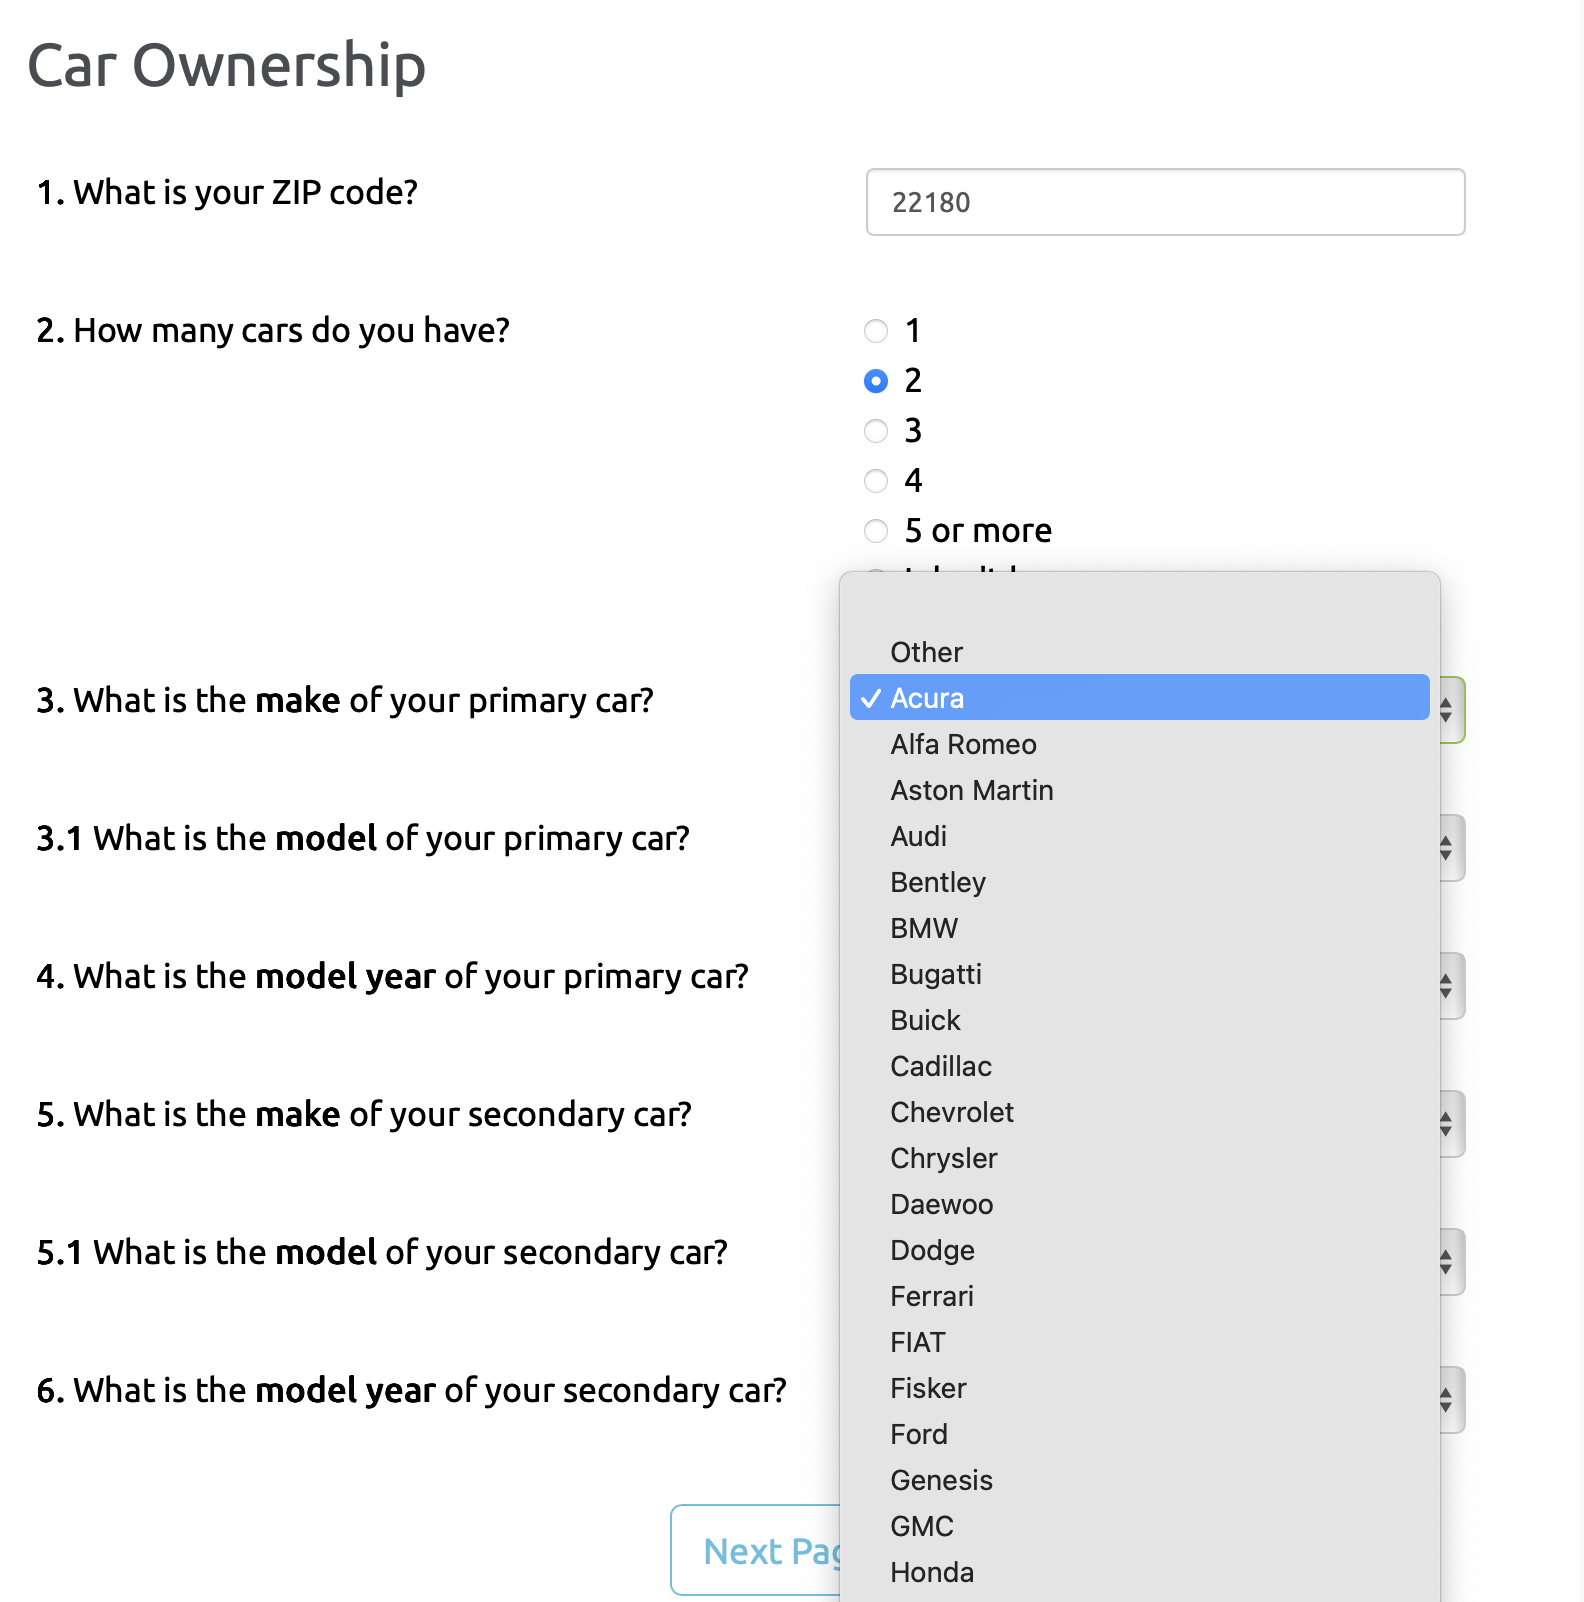
Survey Question - Car Ownership
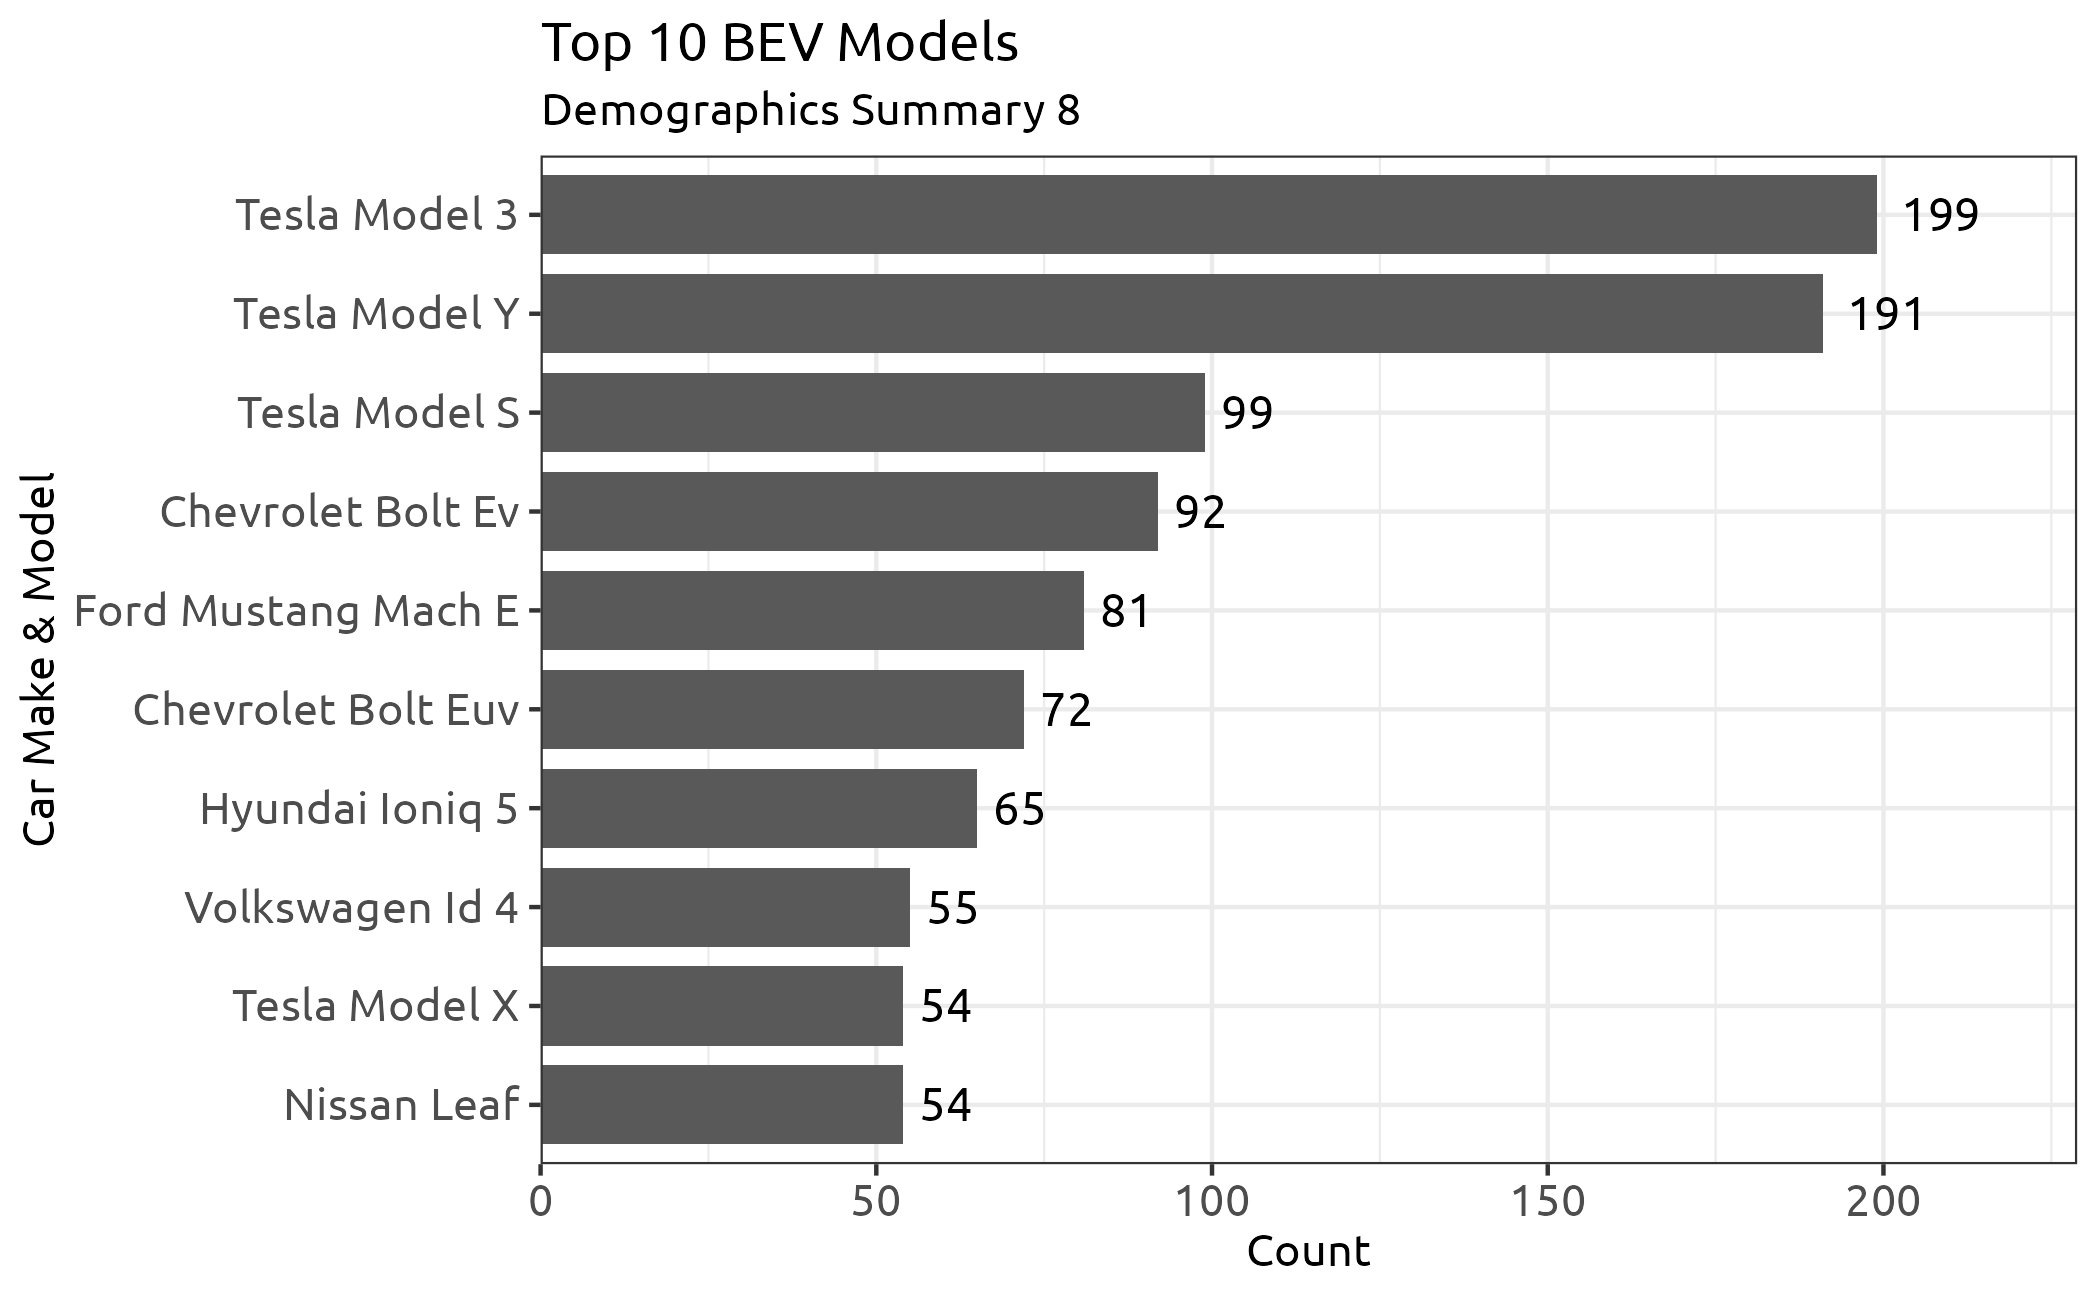
Survey Results - Top 10 BEV
Survey Results - Demographics



Survey Results - Willingness to Participate
Mixed Logit Models
\[ \small \begin{align*} u_j = v_j + \epsilon_j = \beta' x + \epsilon_j \qquad P_j = \frac{e^{v_j}}{\sum_{k=1}^{J} e^{v_k}} \end{align*} \]
Utility estimated using maximum likelihood estimation (MLE).
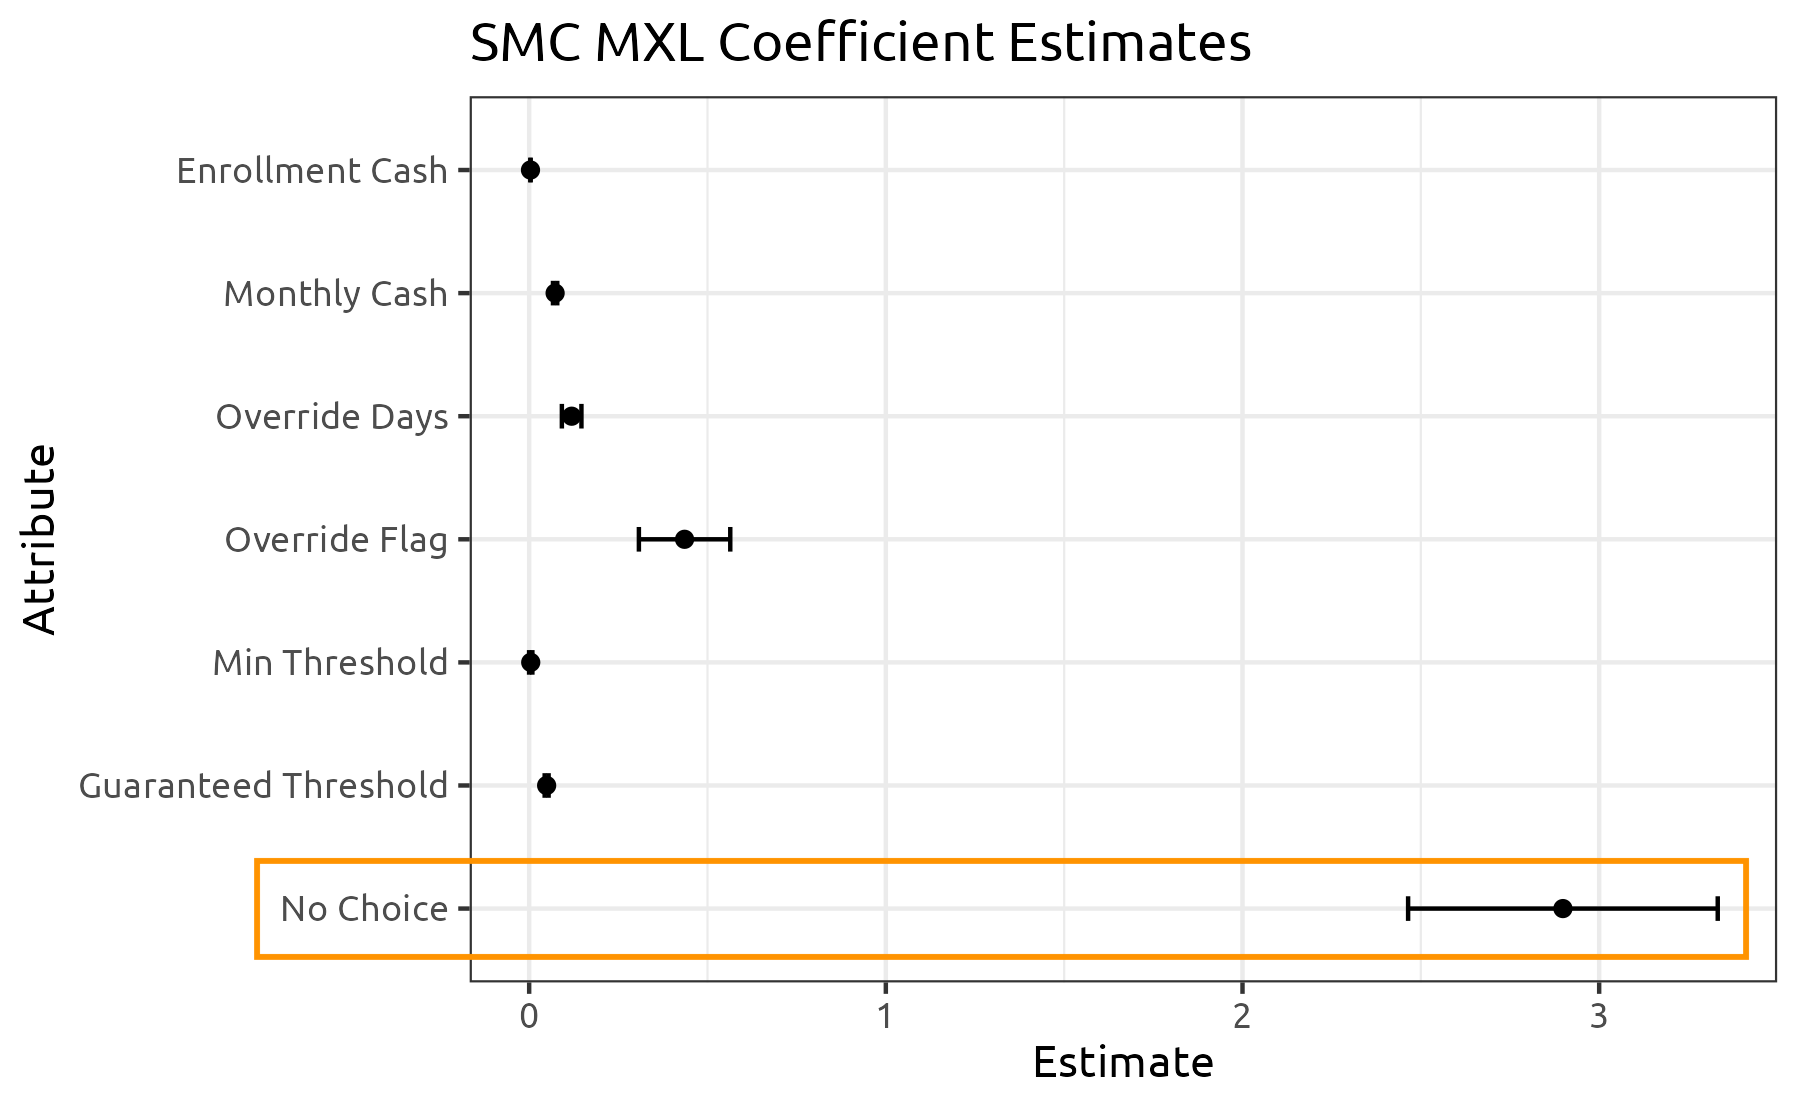
SMC Estimates
V2G Estimates
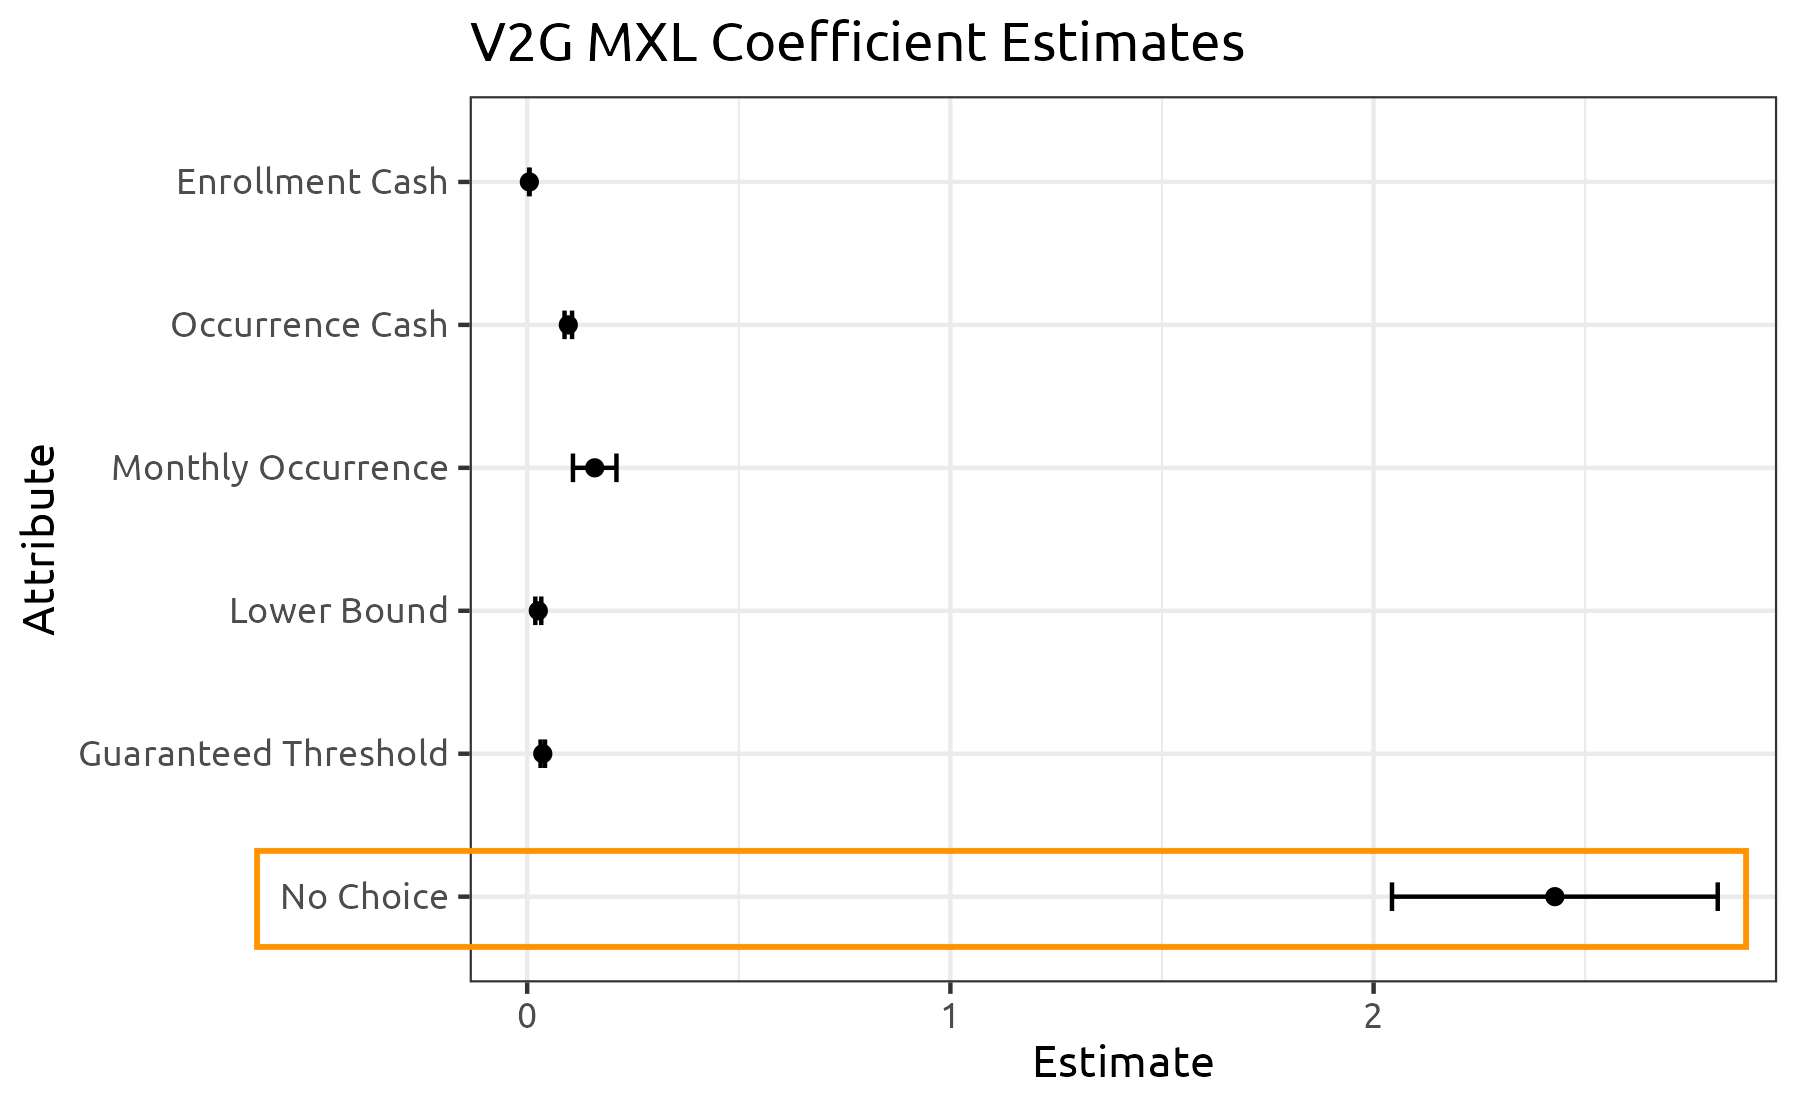
Without compensation, users will not participate.
Enrollment Sensitivity
Baseline Simulation
Choice between “None” and this program:
| Attributes | Values |
|---|---|
| Enrollment Cash | $0 |
| Monthly Cash | $0 - $20 |
| Monthly Override | 0 |
Sensitivity Plot
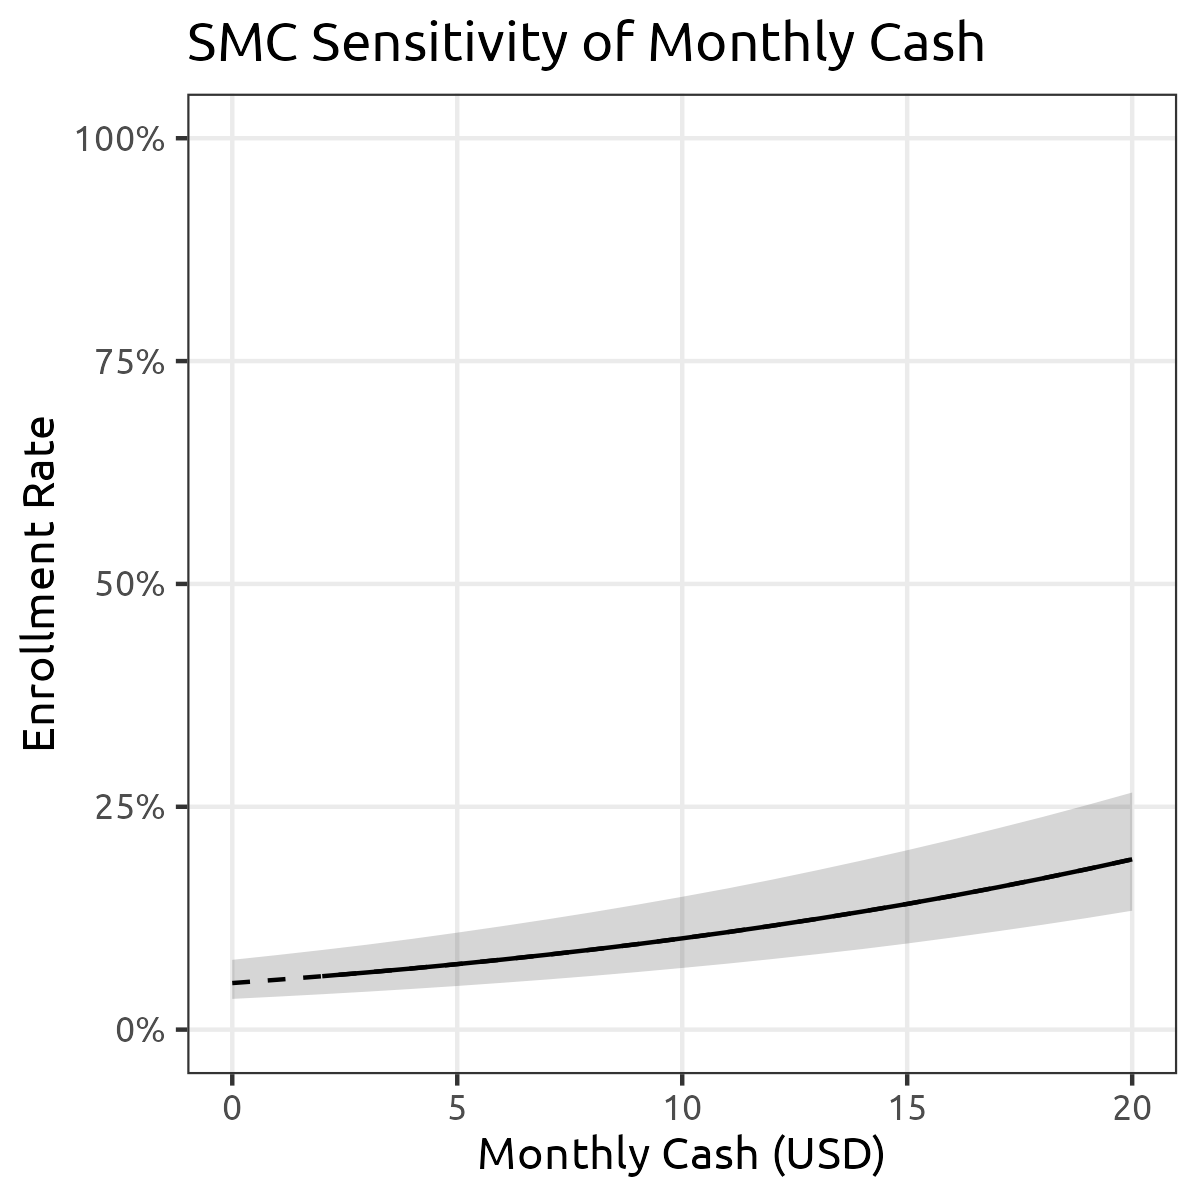
Enrollment Sensitivity
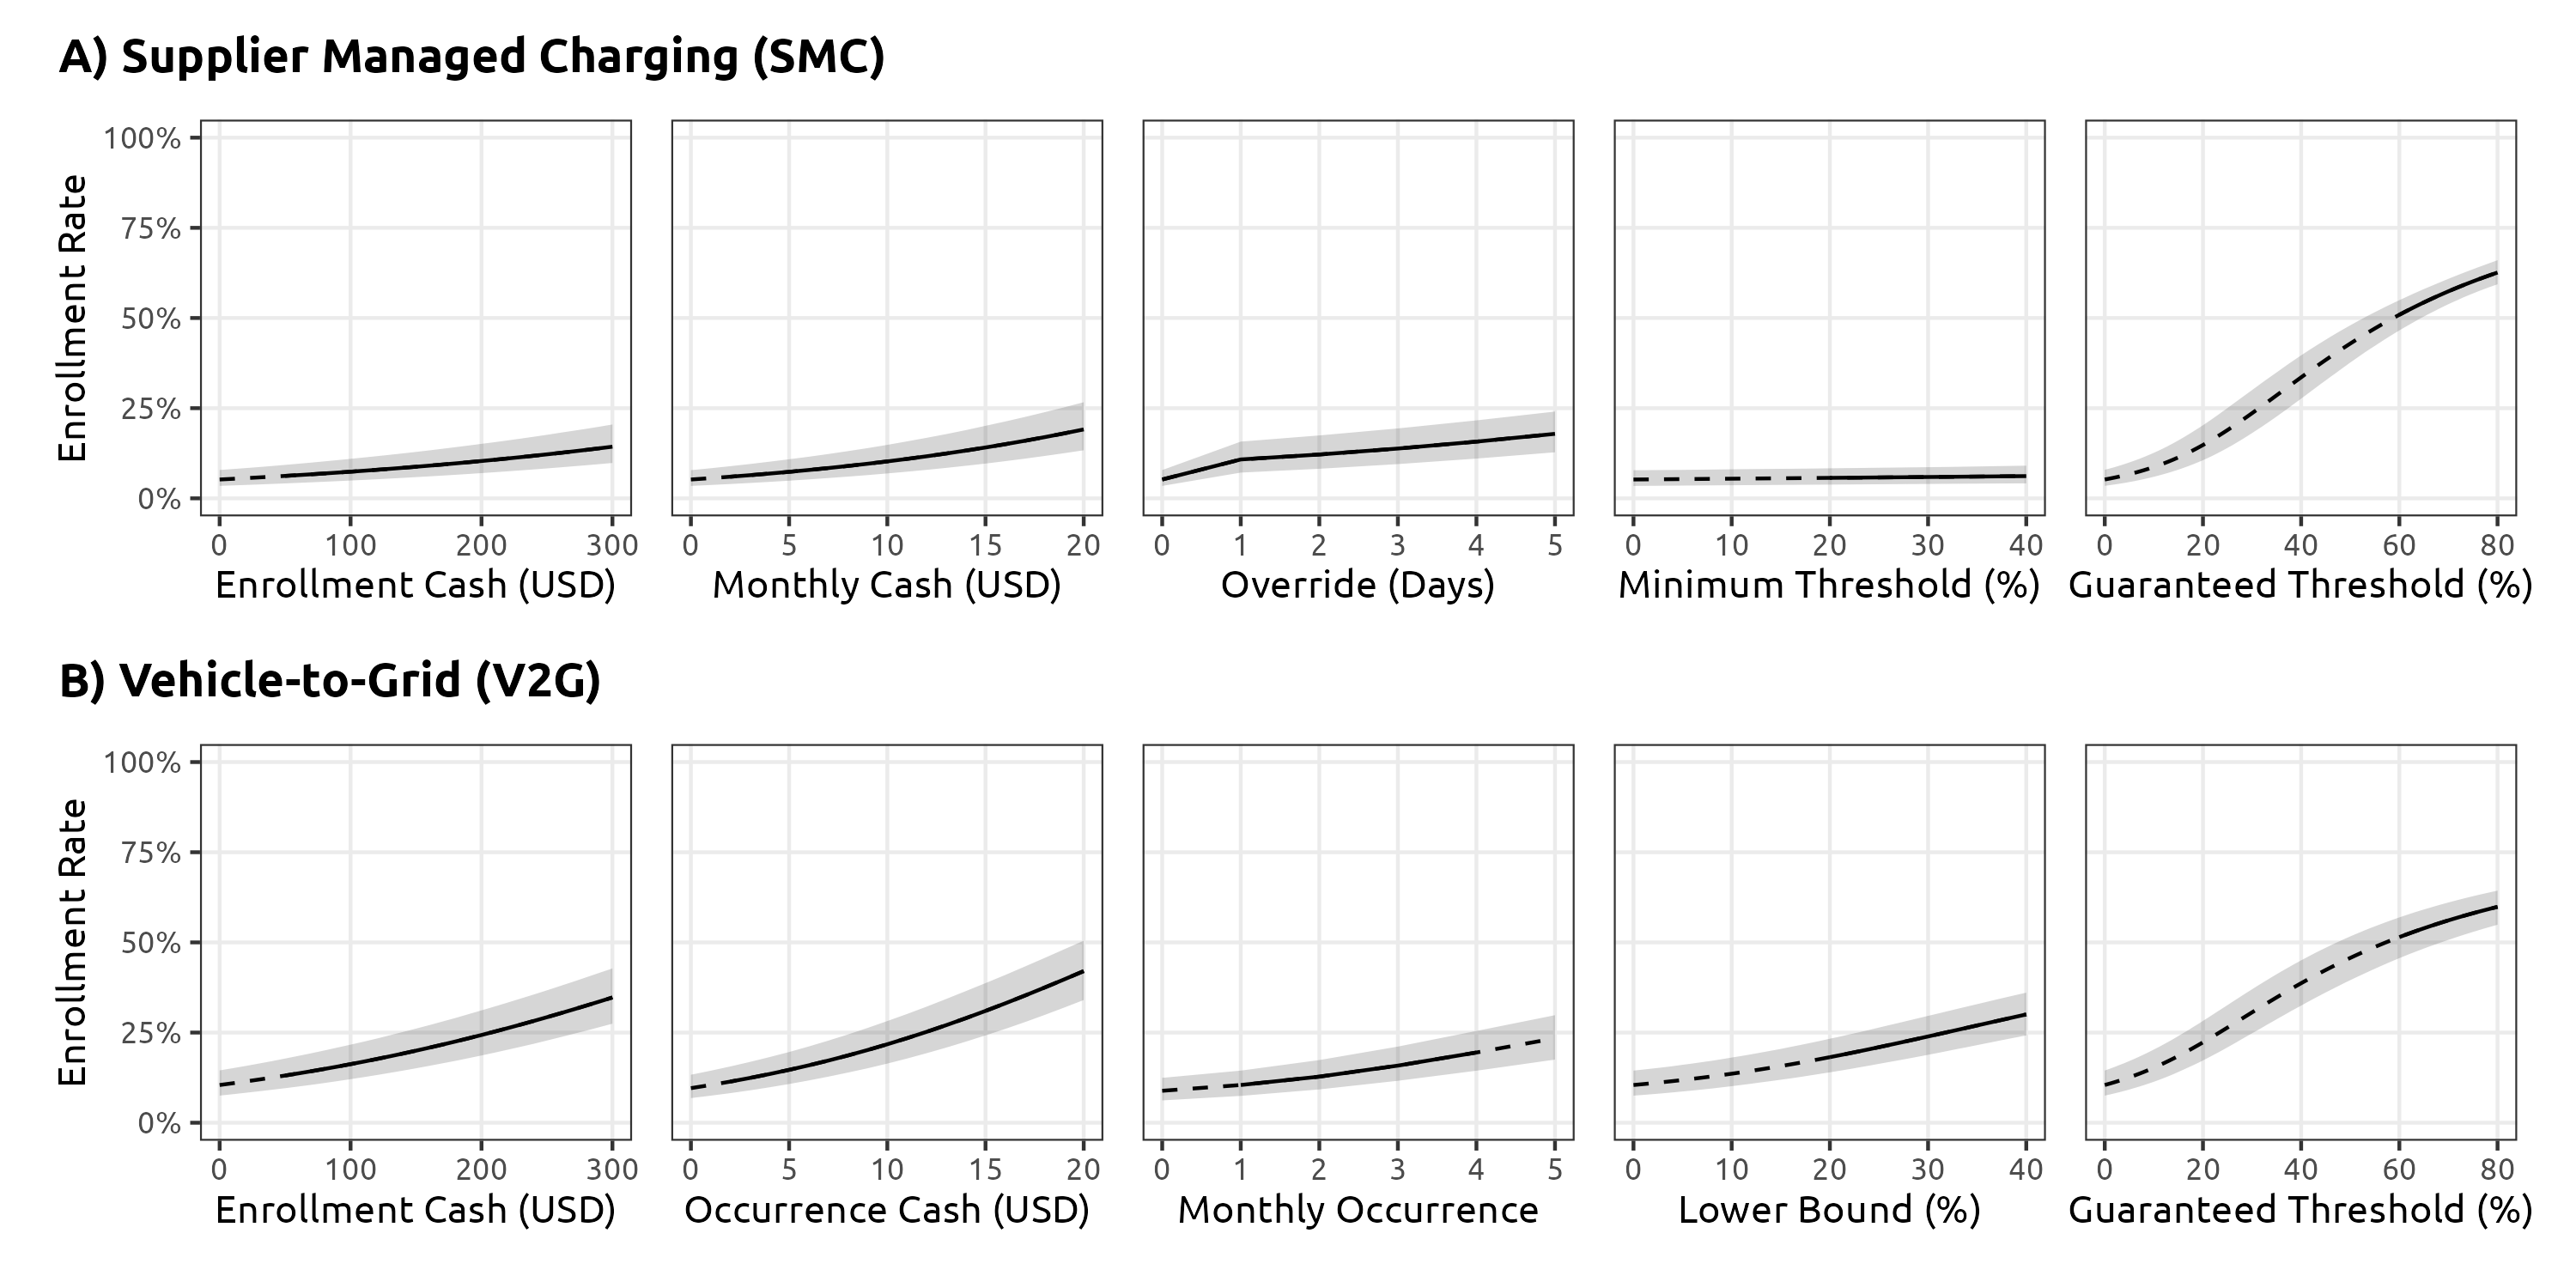
- Steeper slope indicates higher sensitivity.
- Diminishing returns exist.
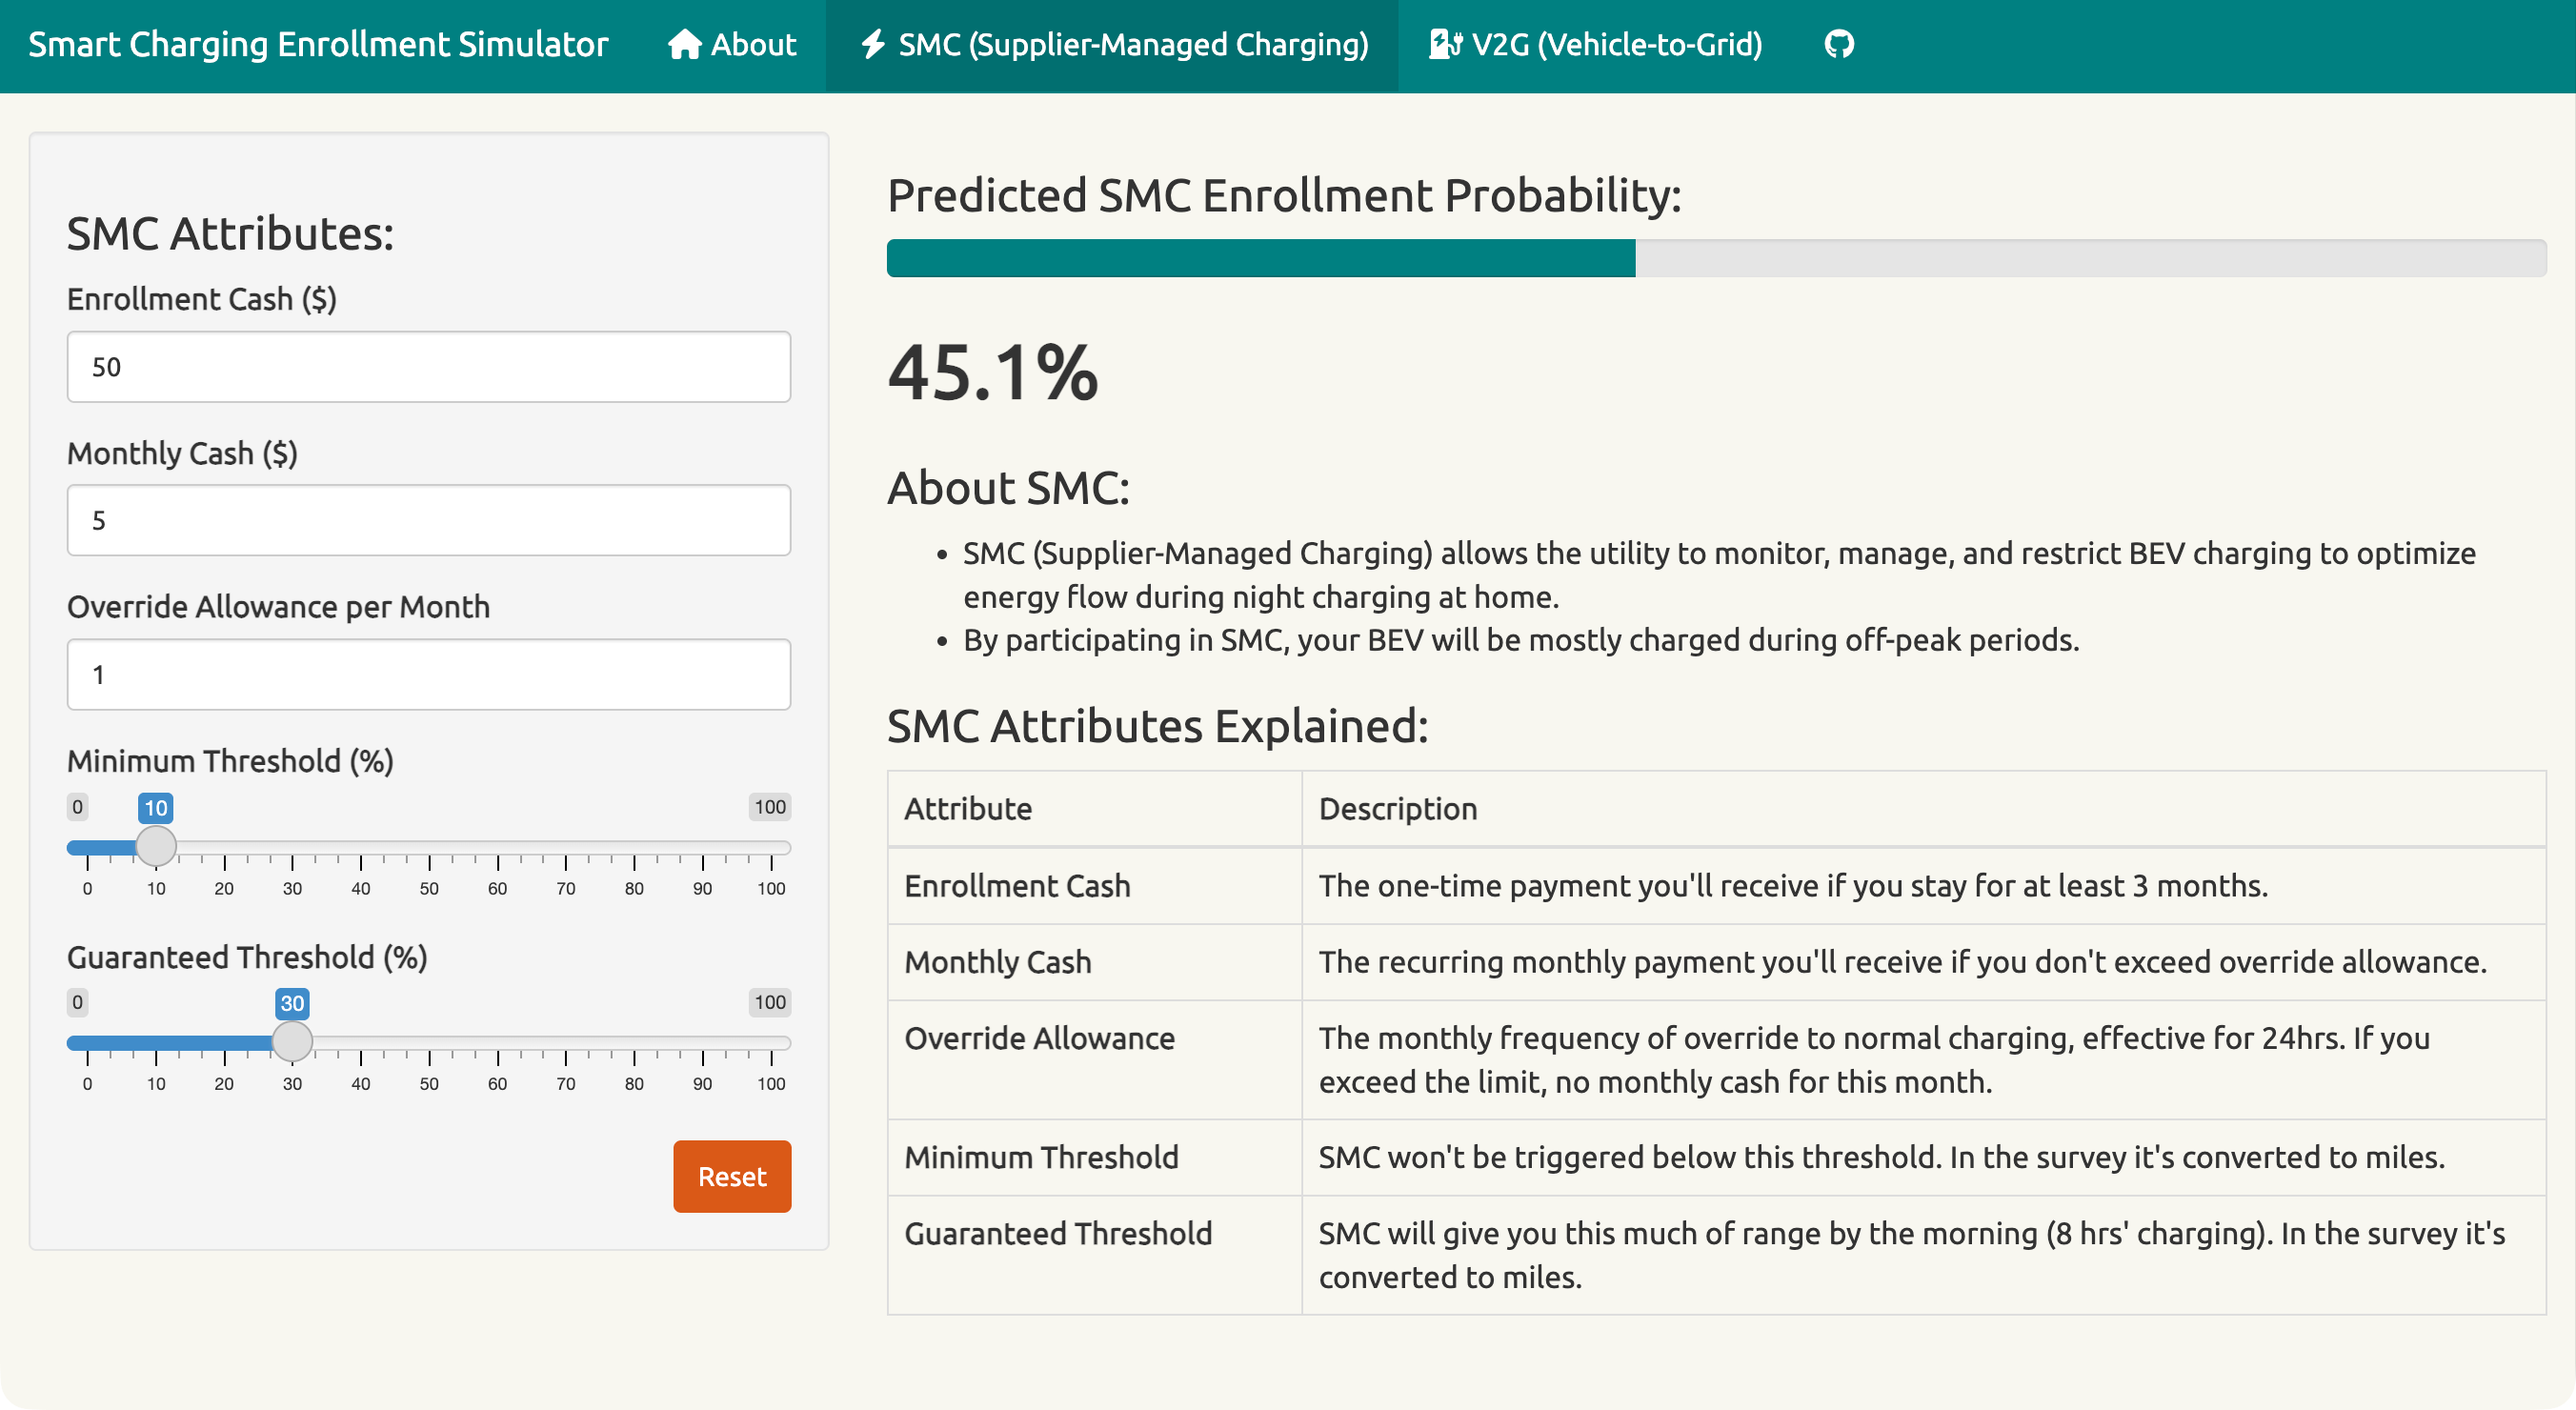
Smart Charging Enrollment Simulator
Recall the SMC Peak-shaving
- SMC smooths out the BEV charging spike (called “Peak-shaving”).
- Electricity demand is controlled below the capacity threshold.
- It saves money and reduces pollution.
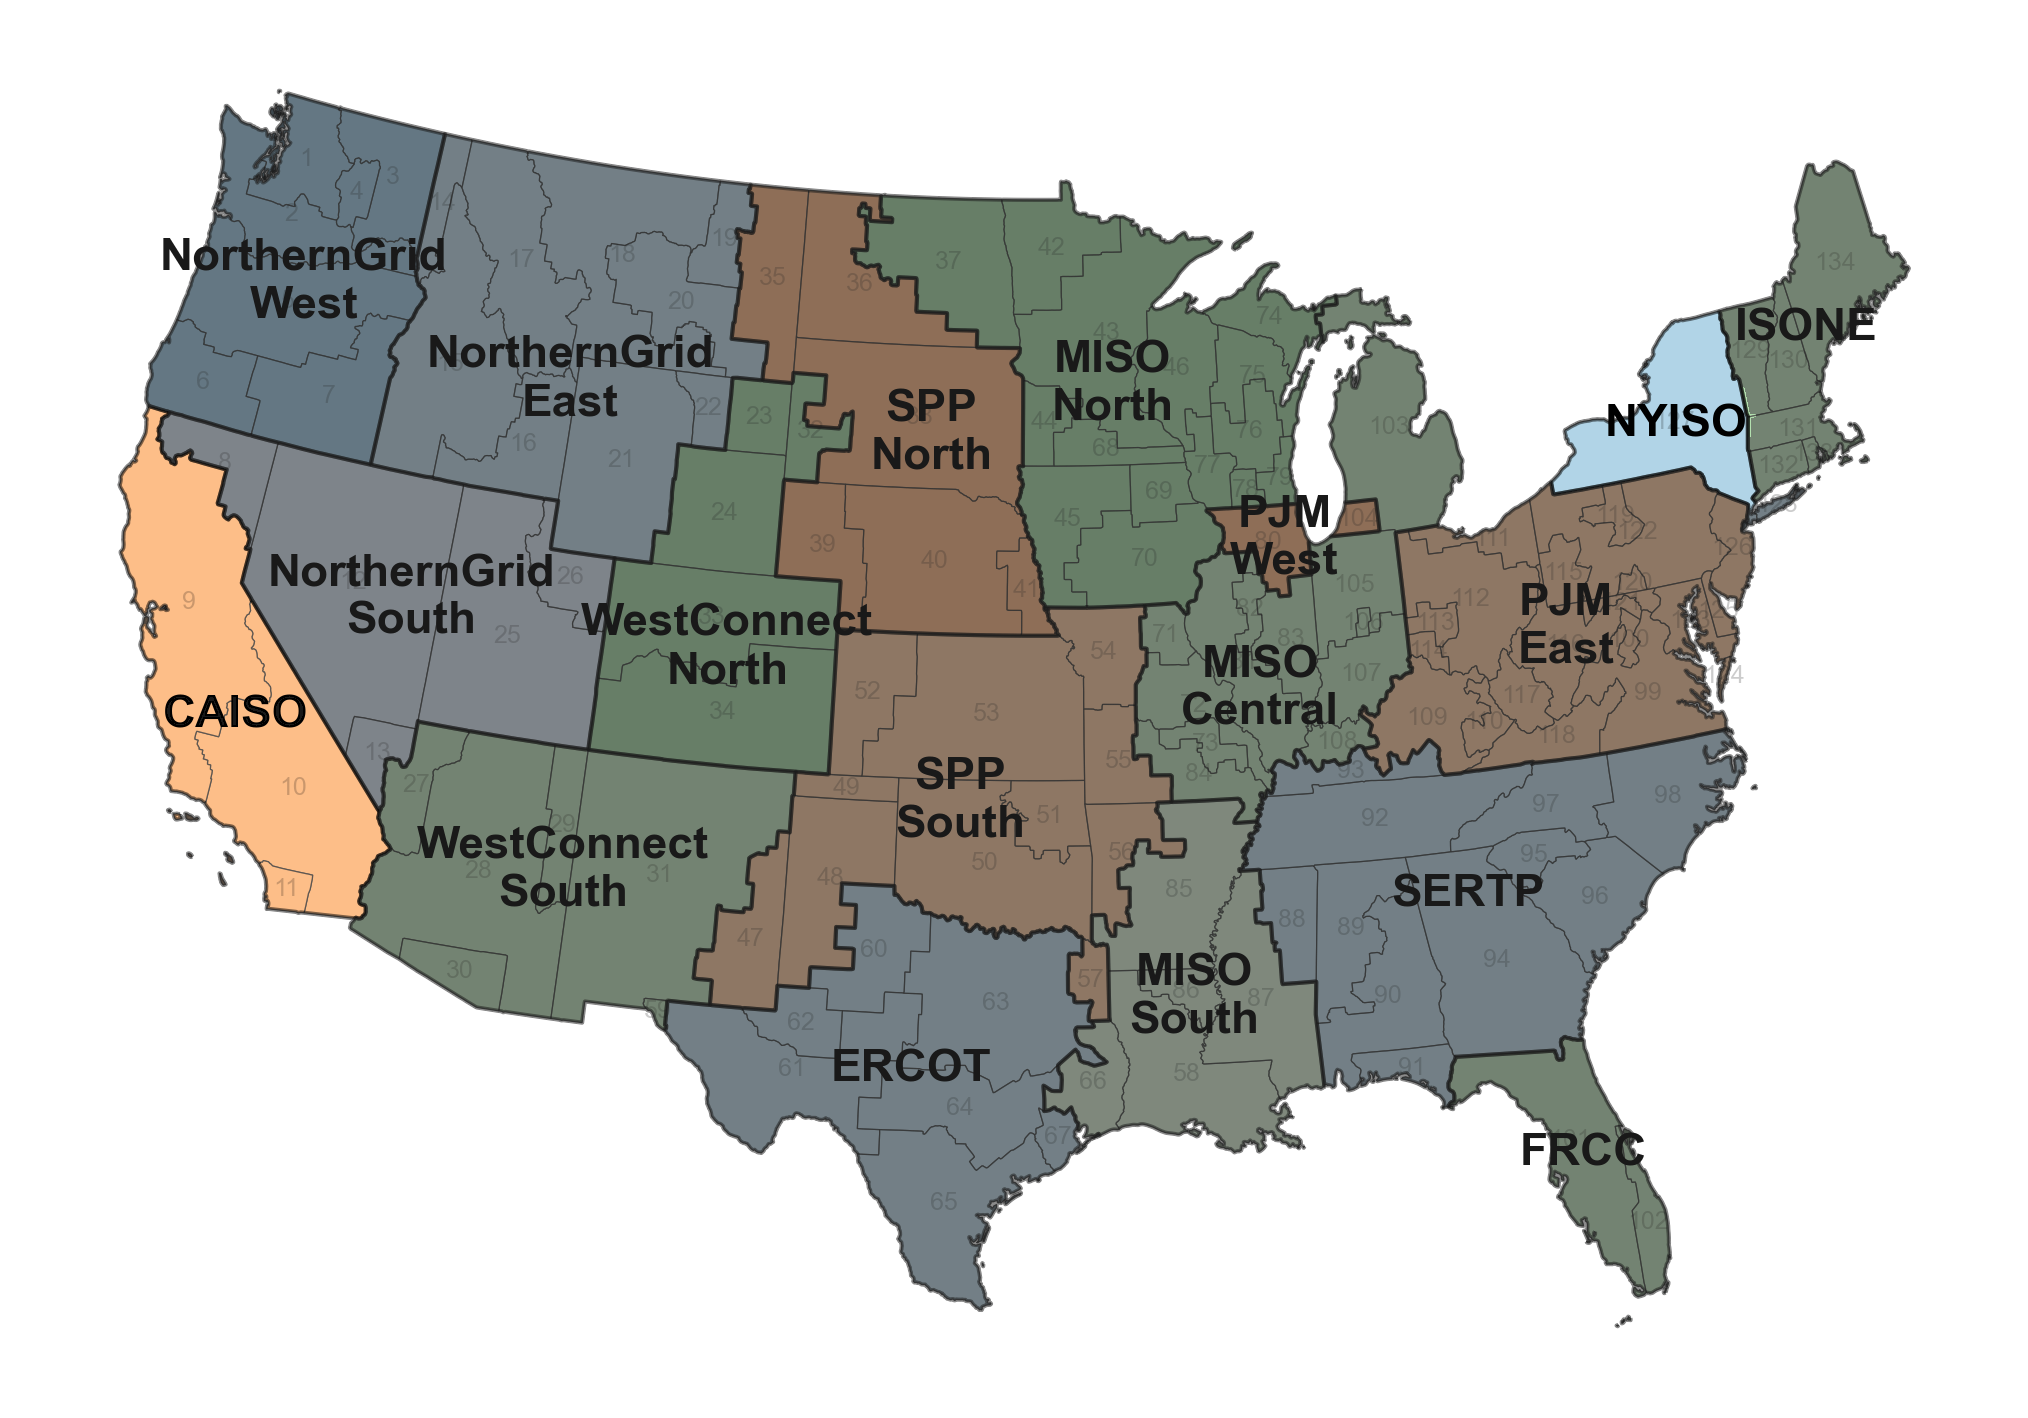
18 GEA regions in the USA
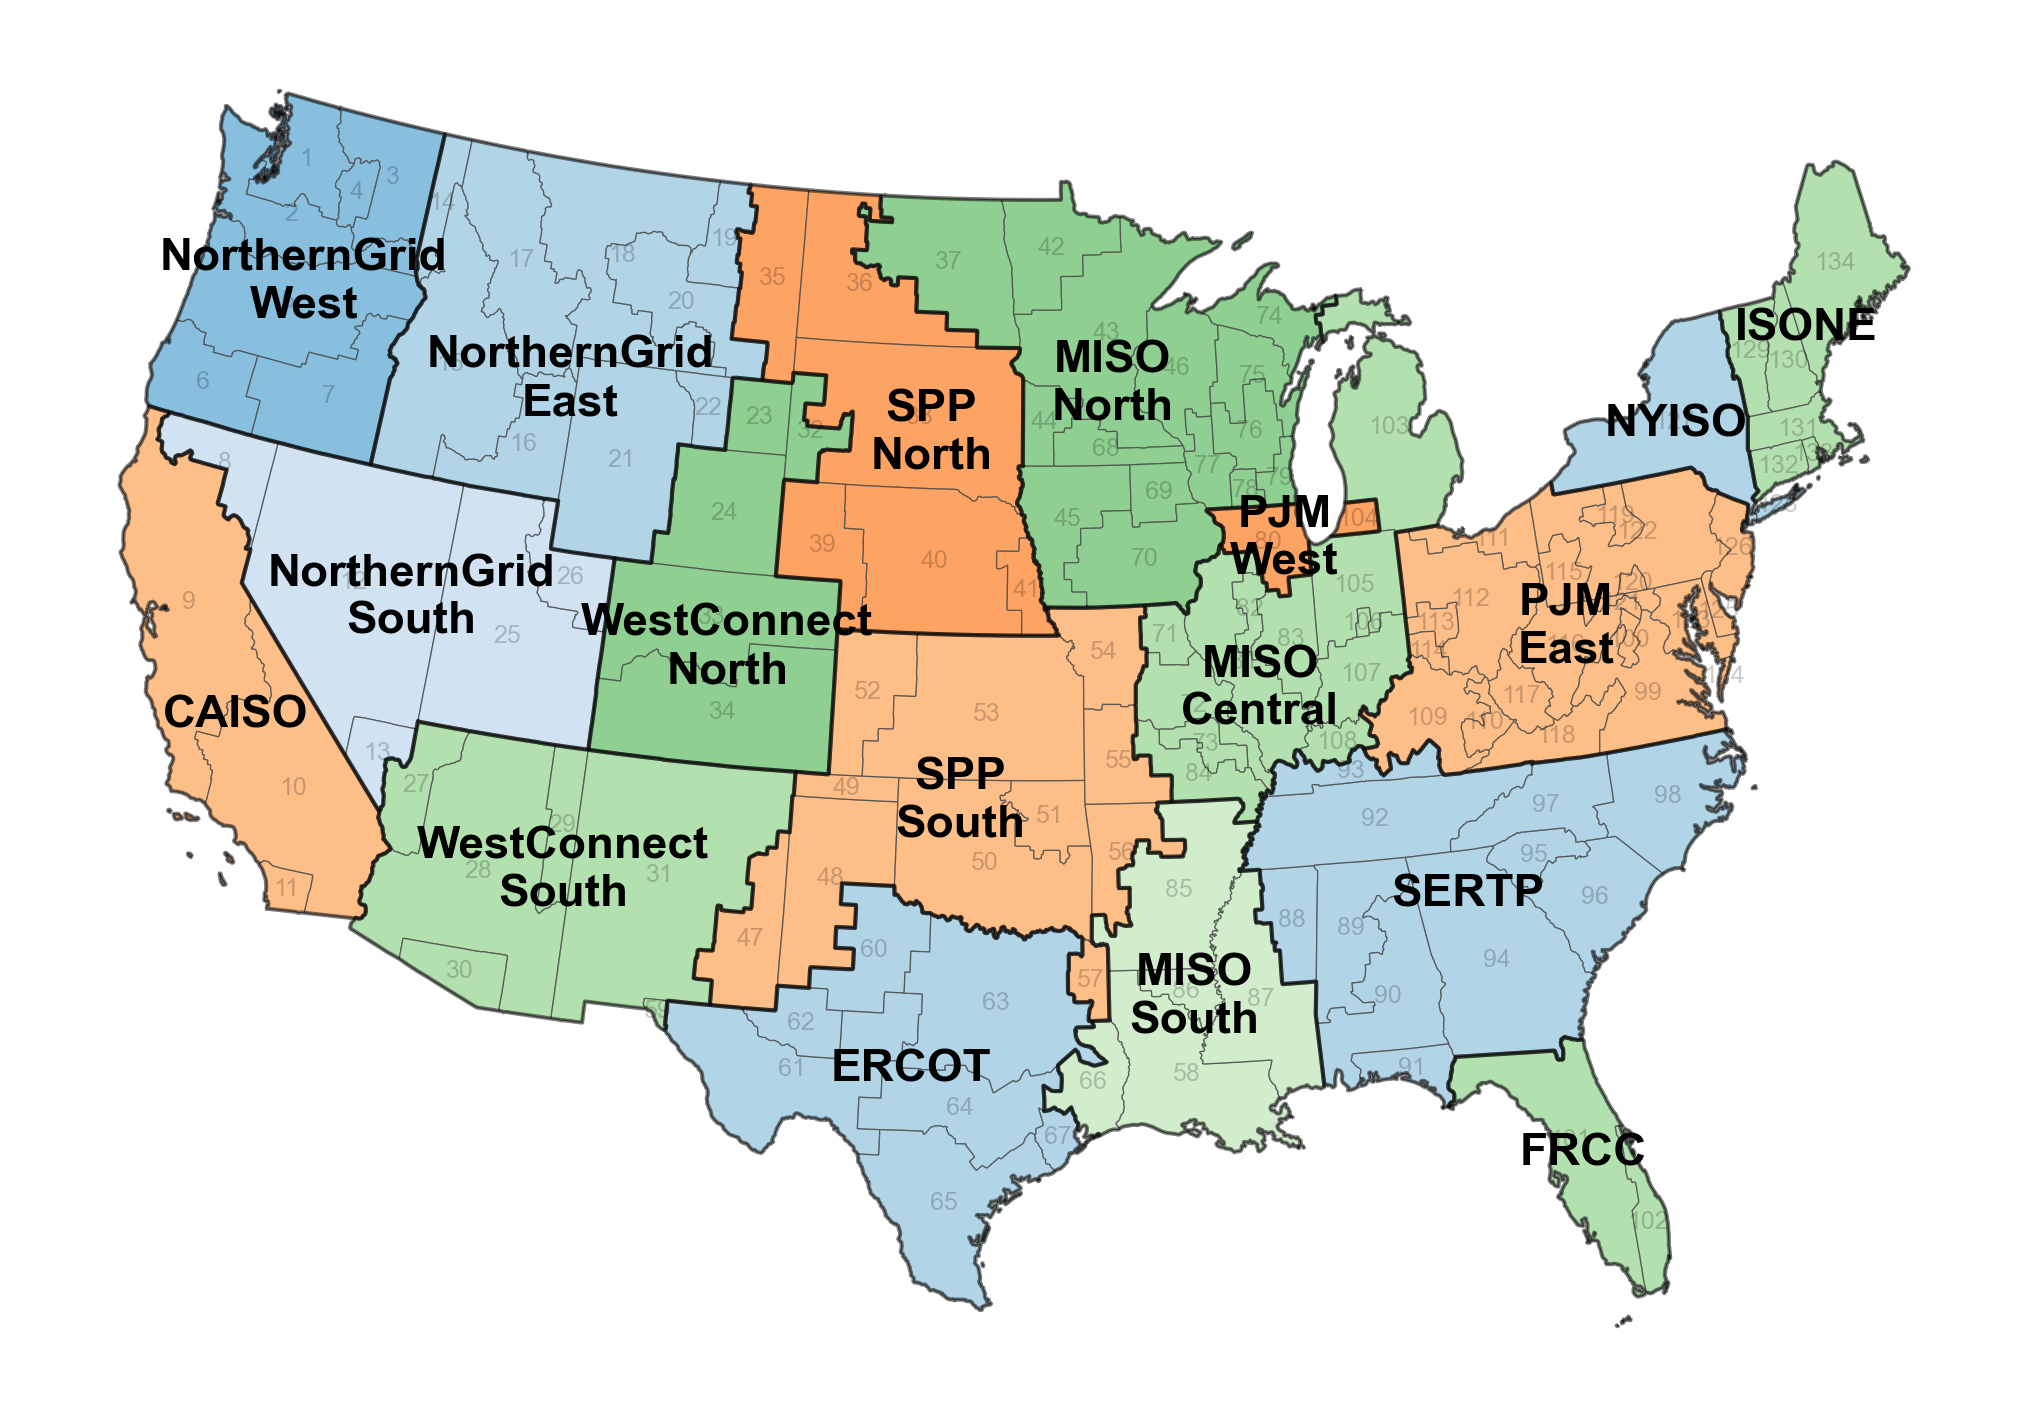
18 GEA regions in the USA
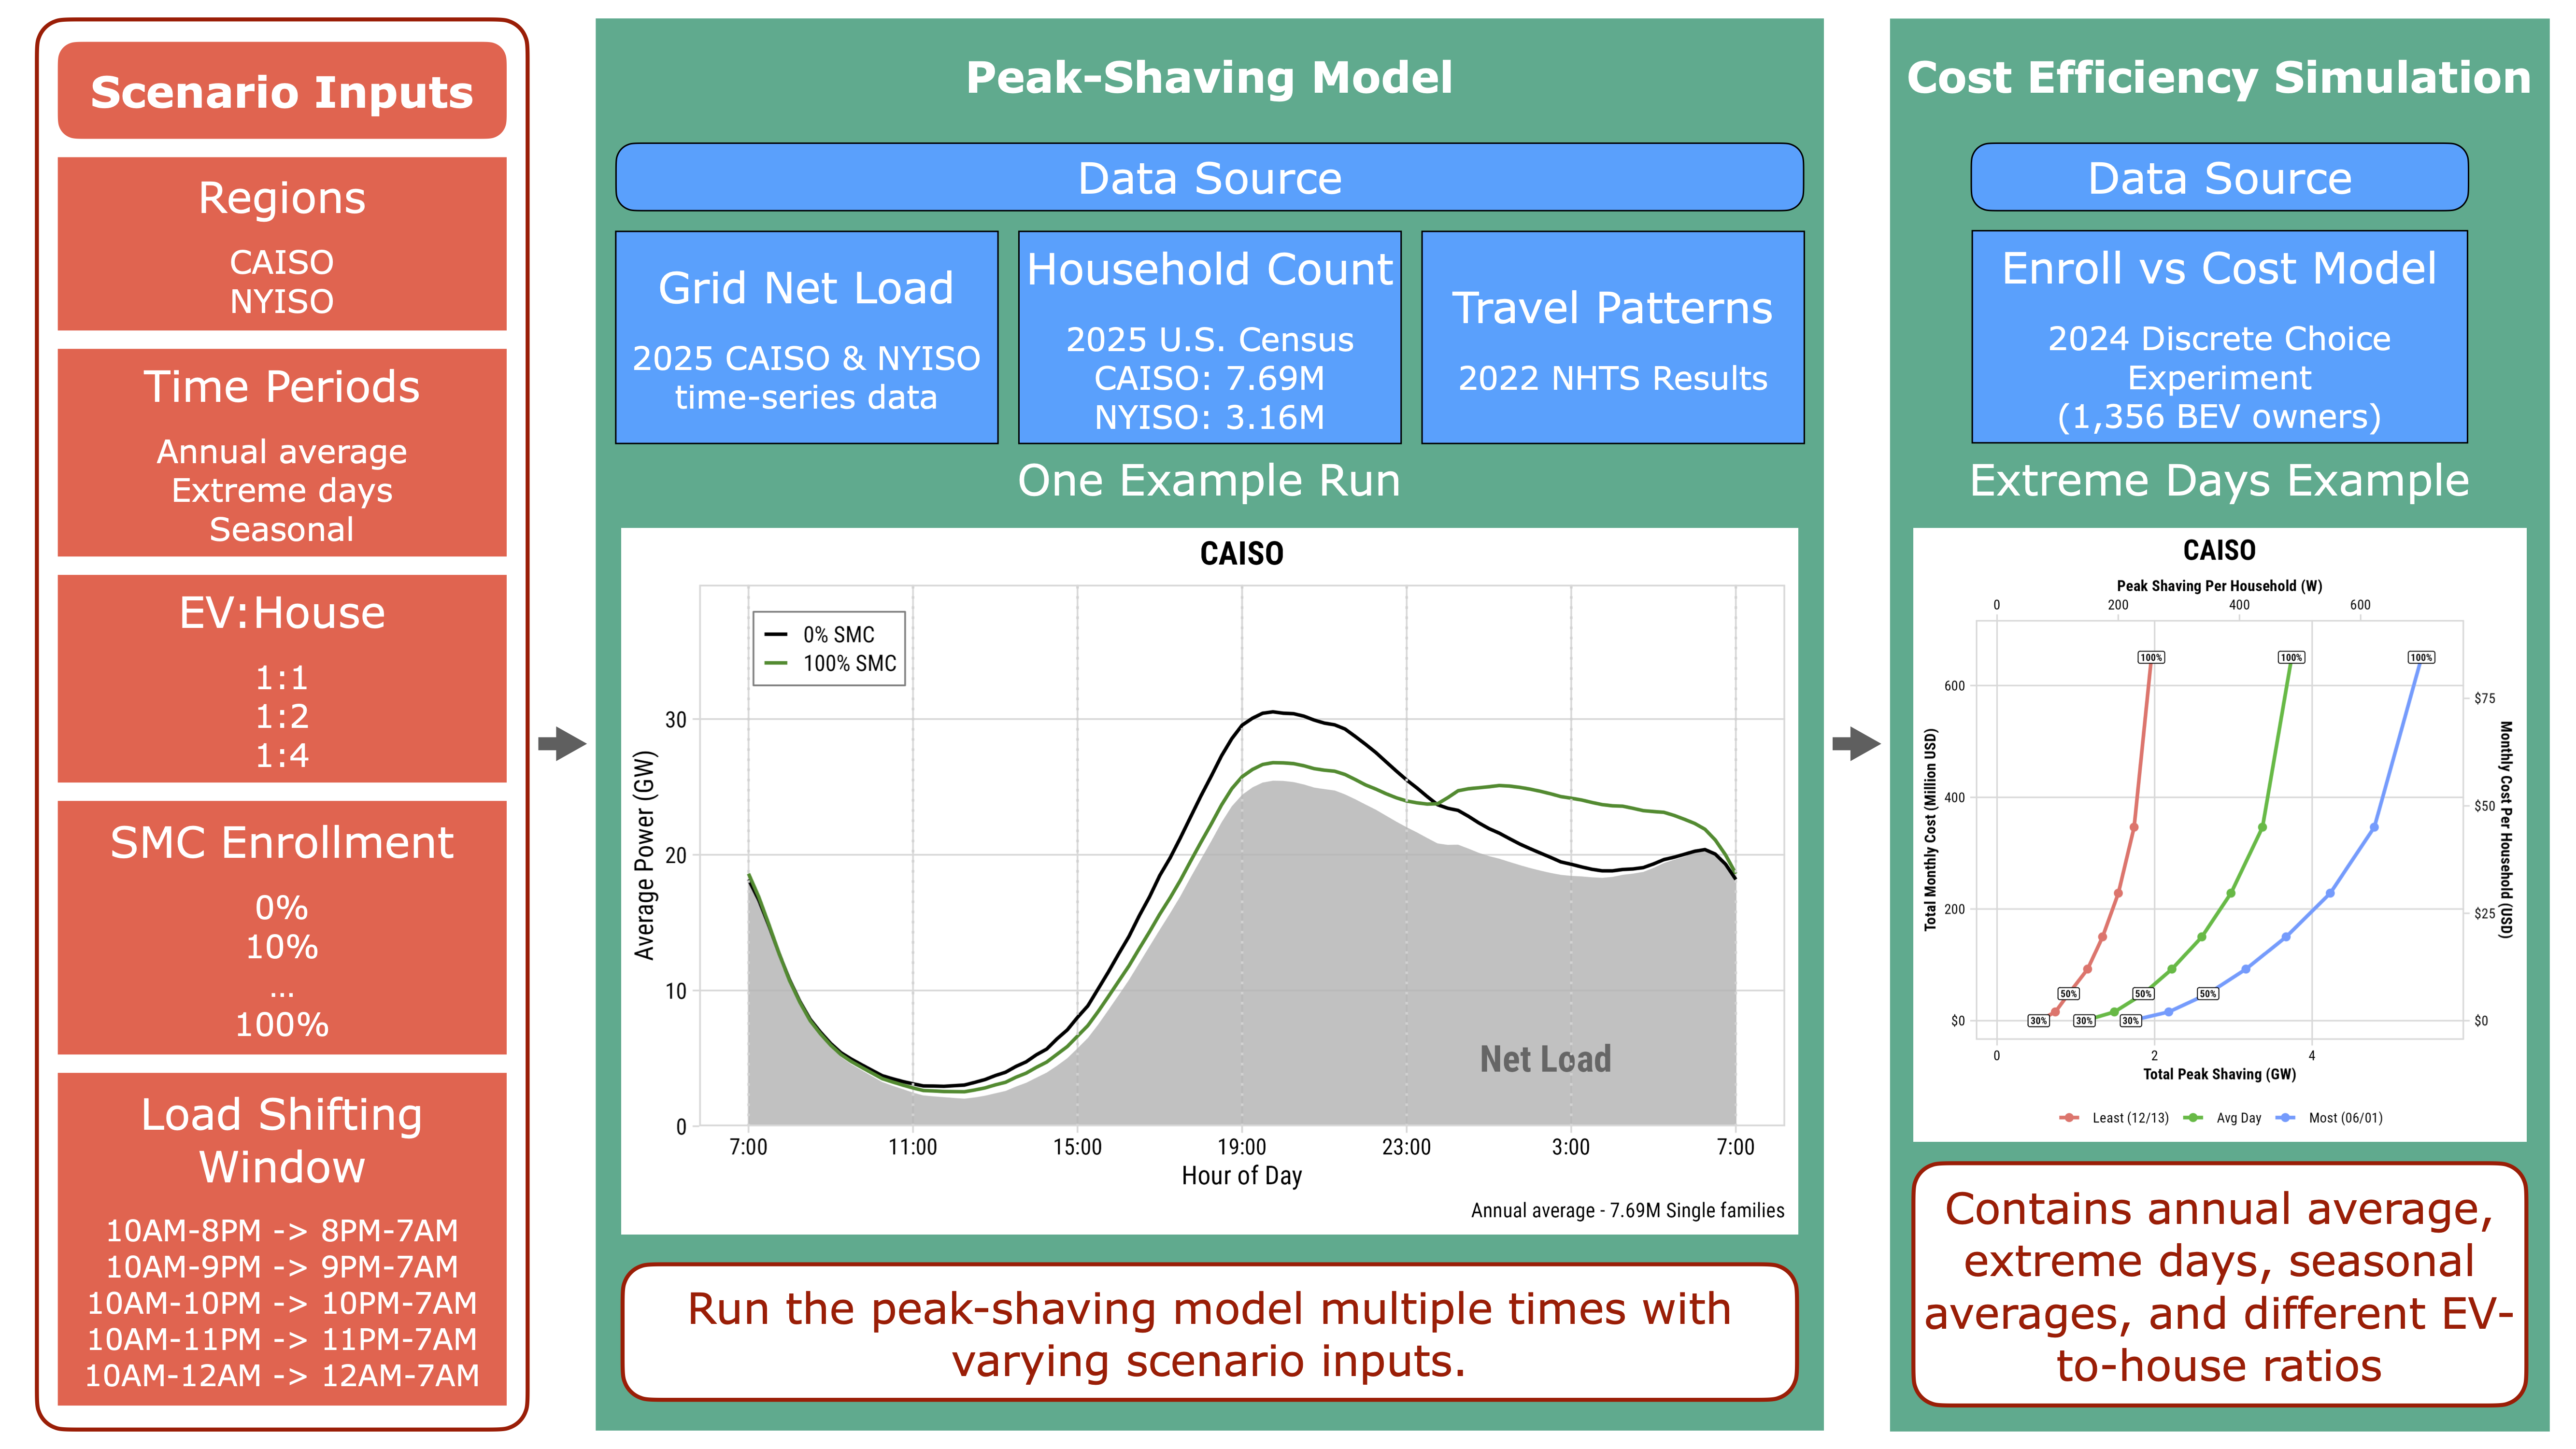
Simulation Overview
Step 1: BEV Charging Load Profile
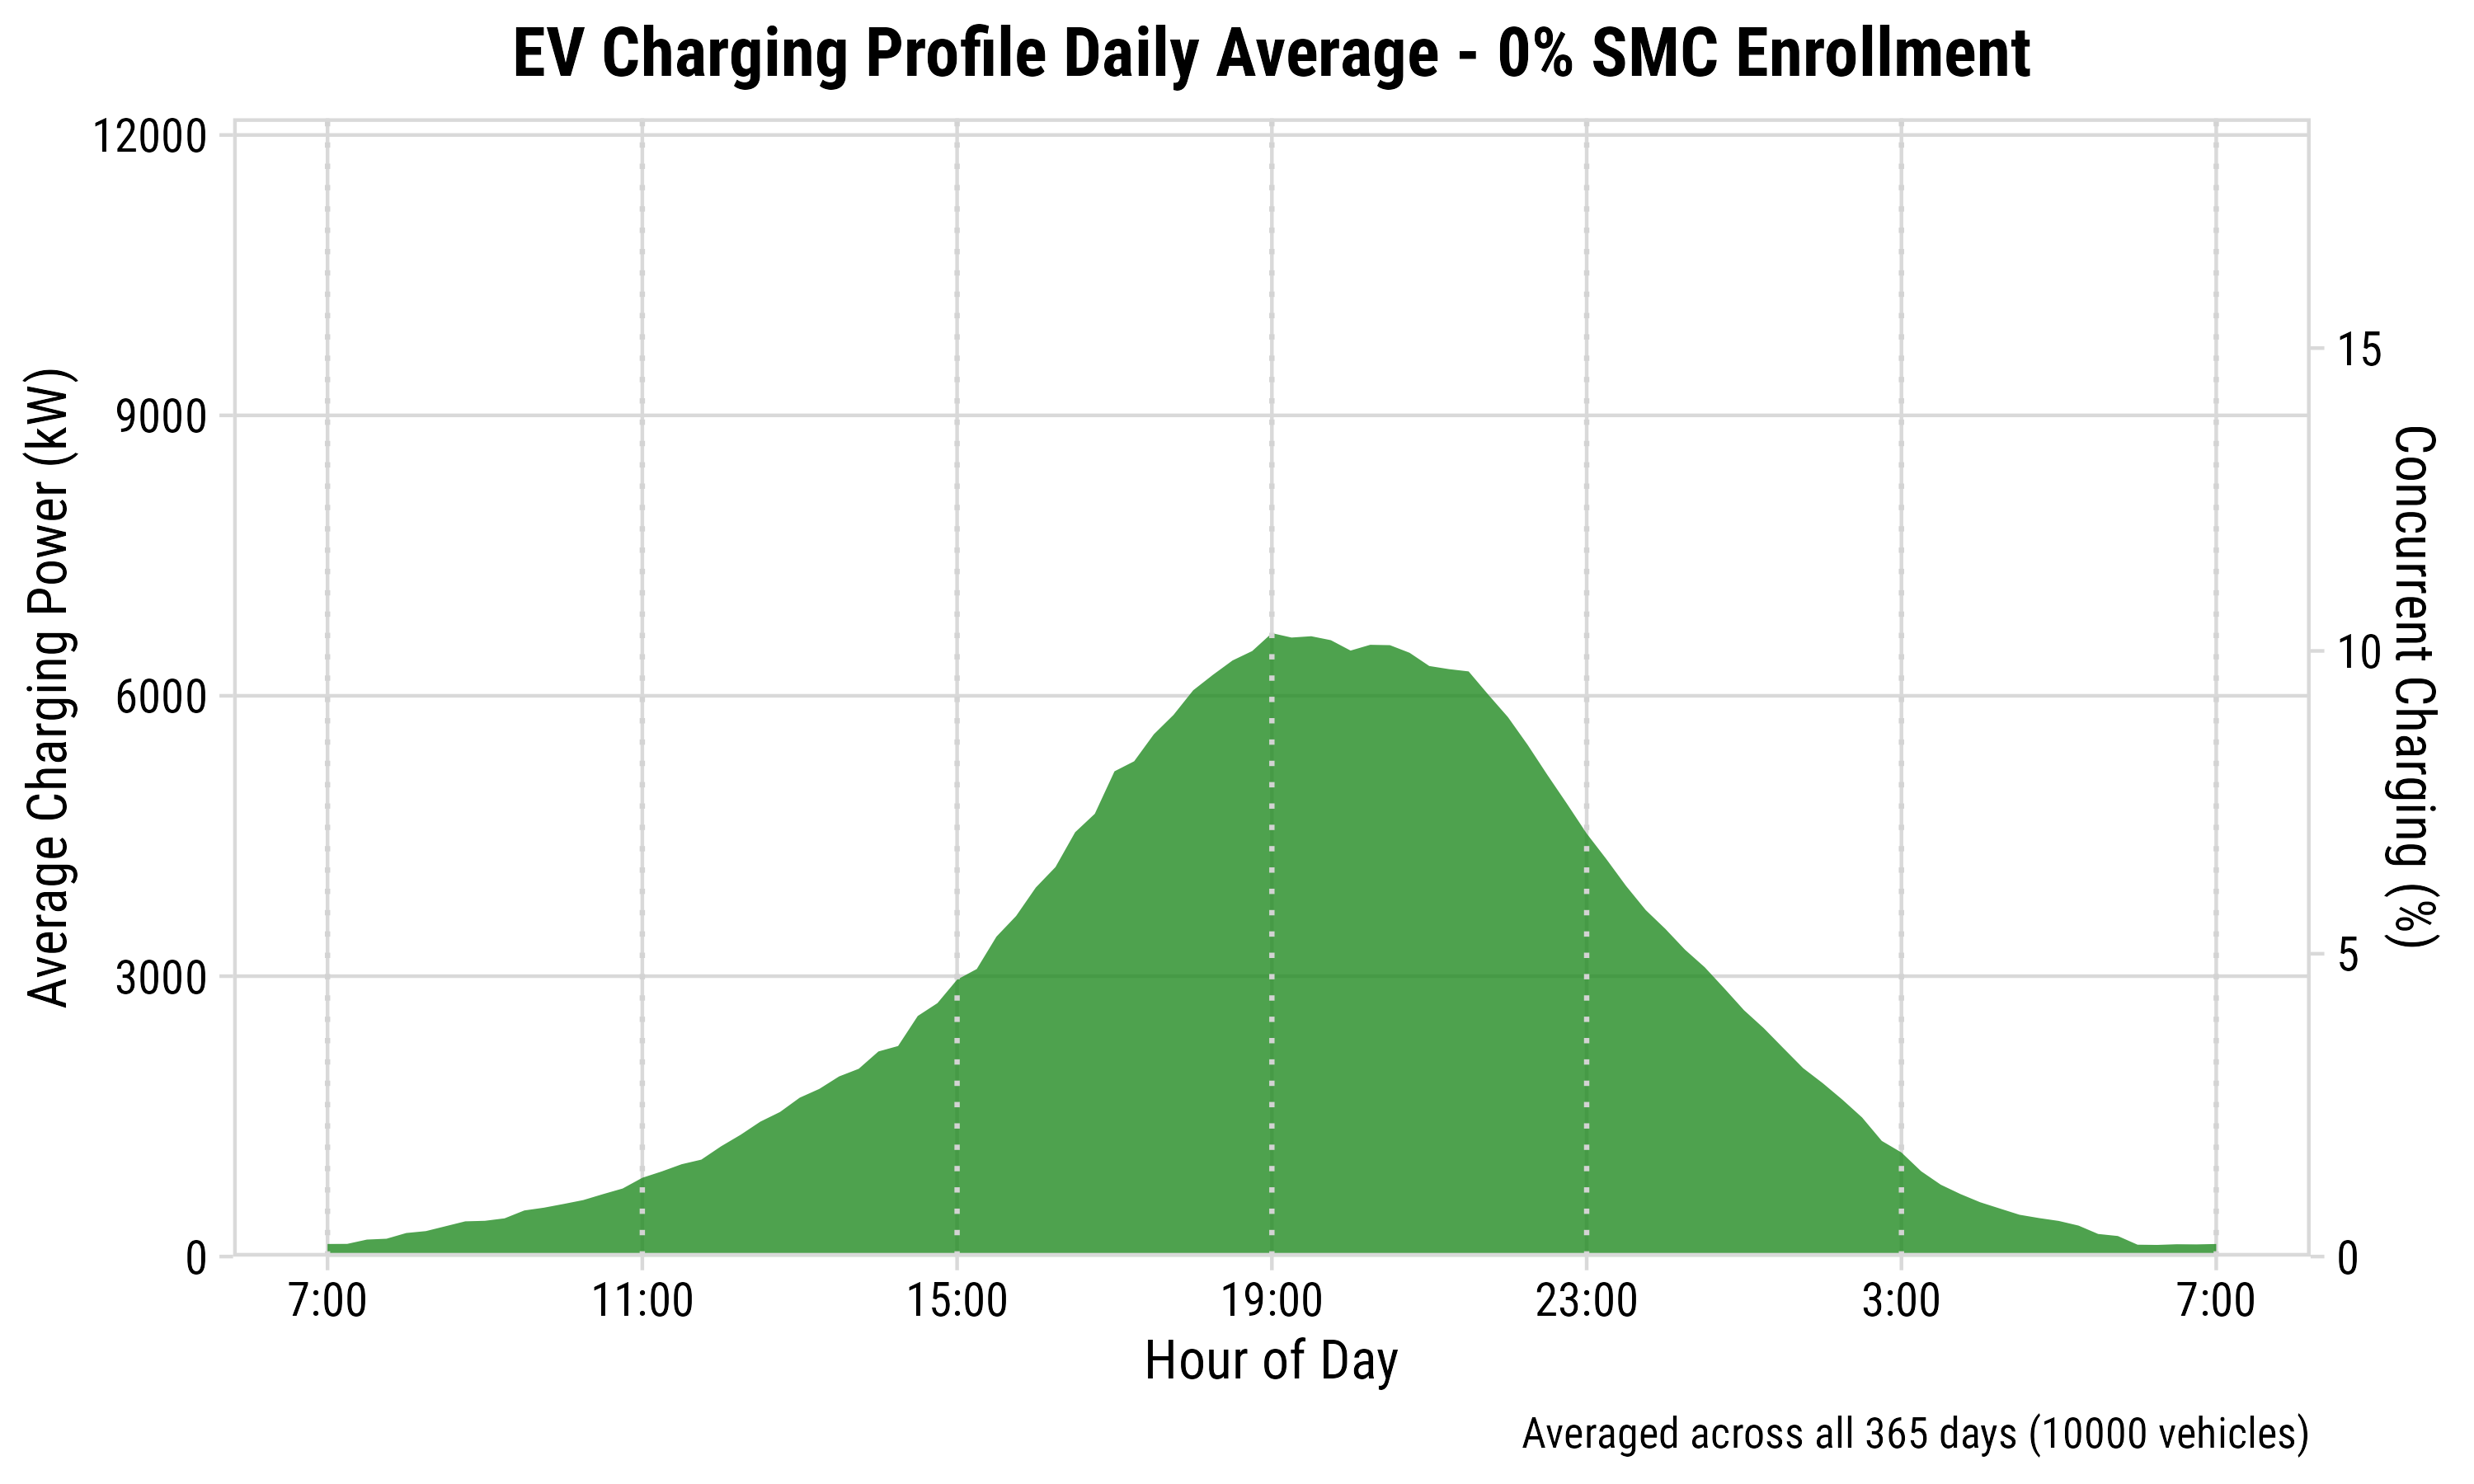
Simulation results based on ~26,000 survey responses from 2022 NHTS.
Step 2: Grid Net Load Profile
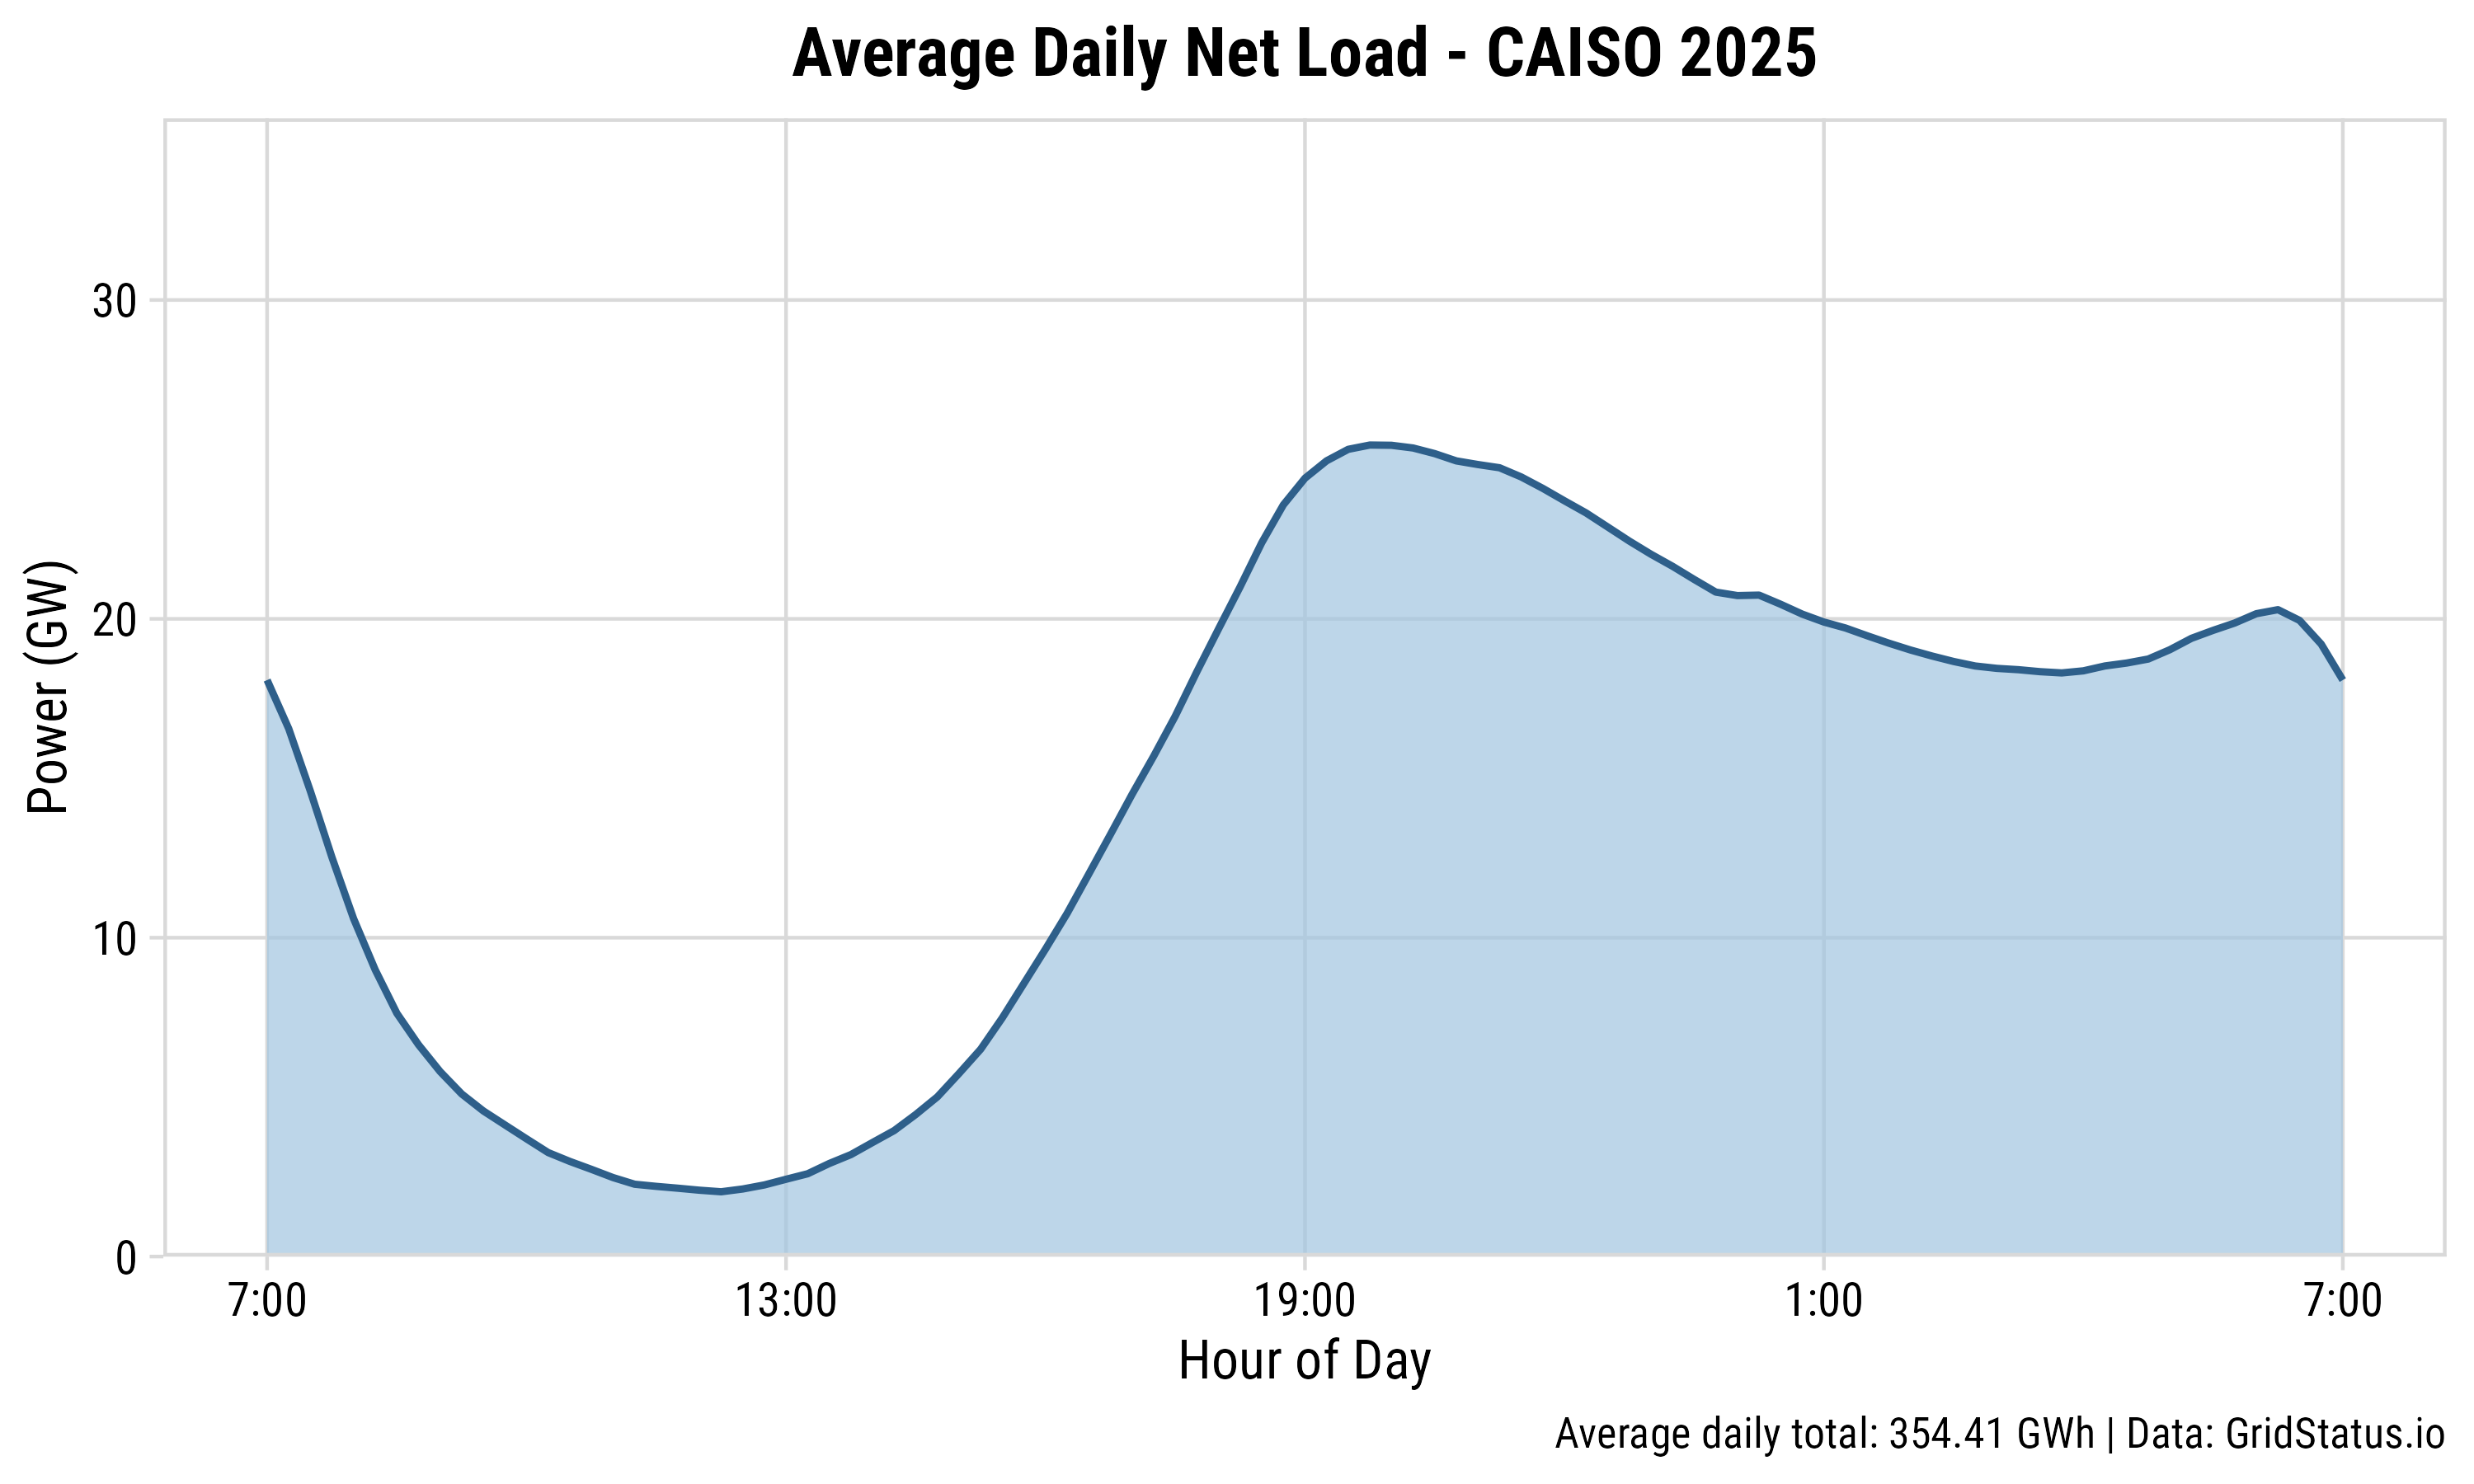
Net Load = Grid Supply - Variable Sources
Step 3: BEV Load Peak Shaving
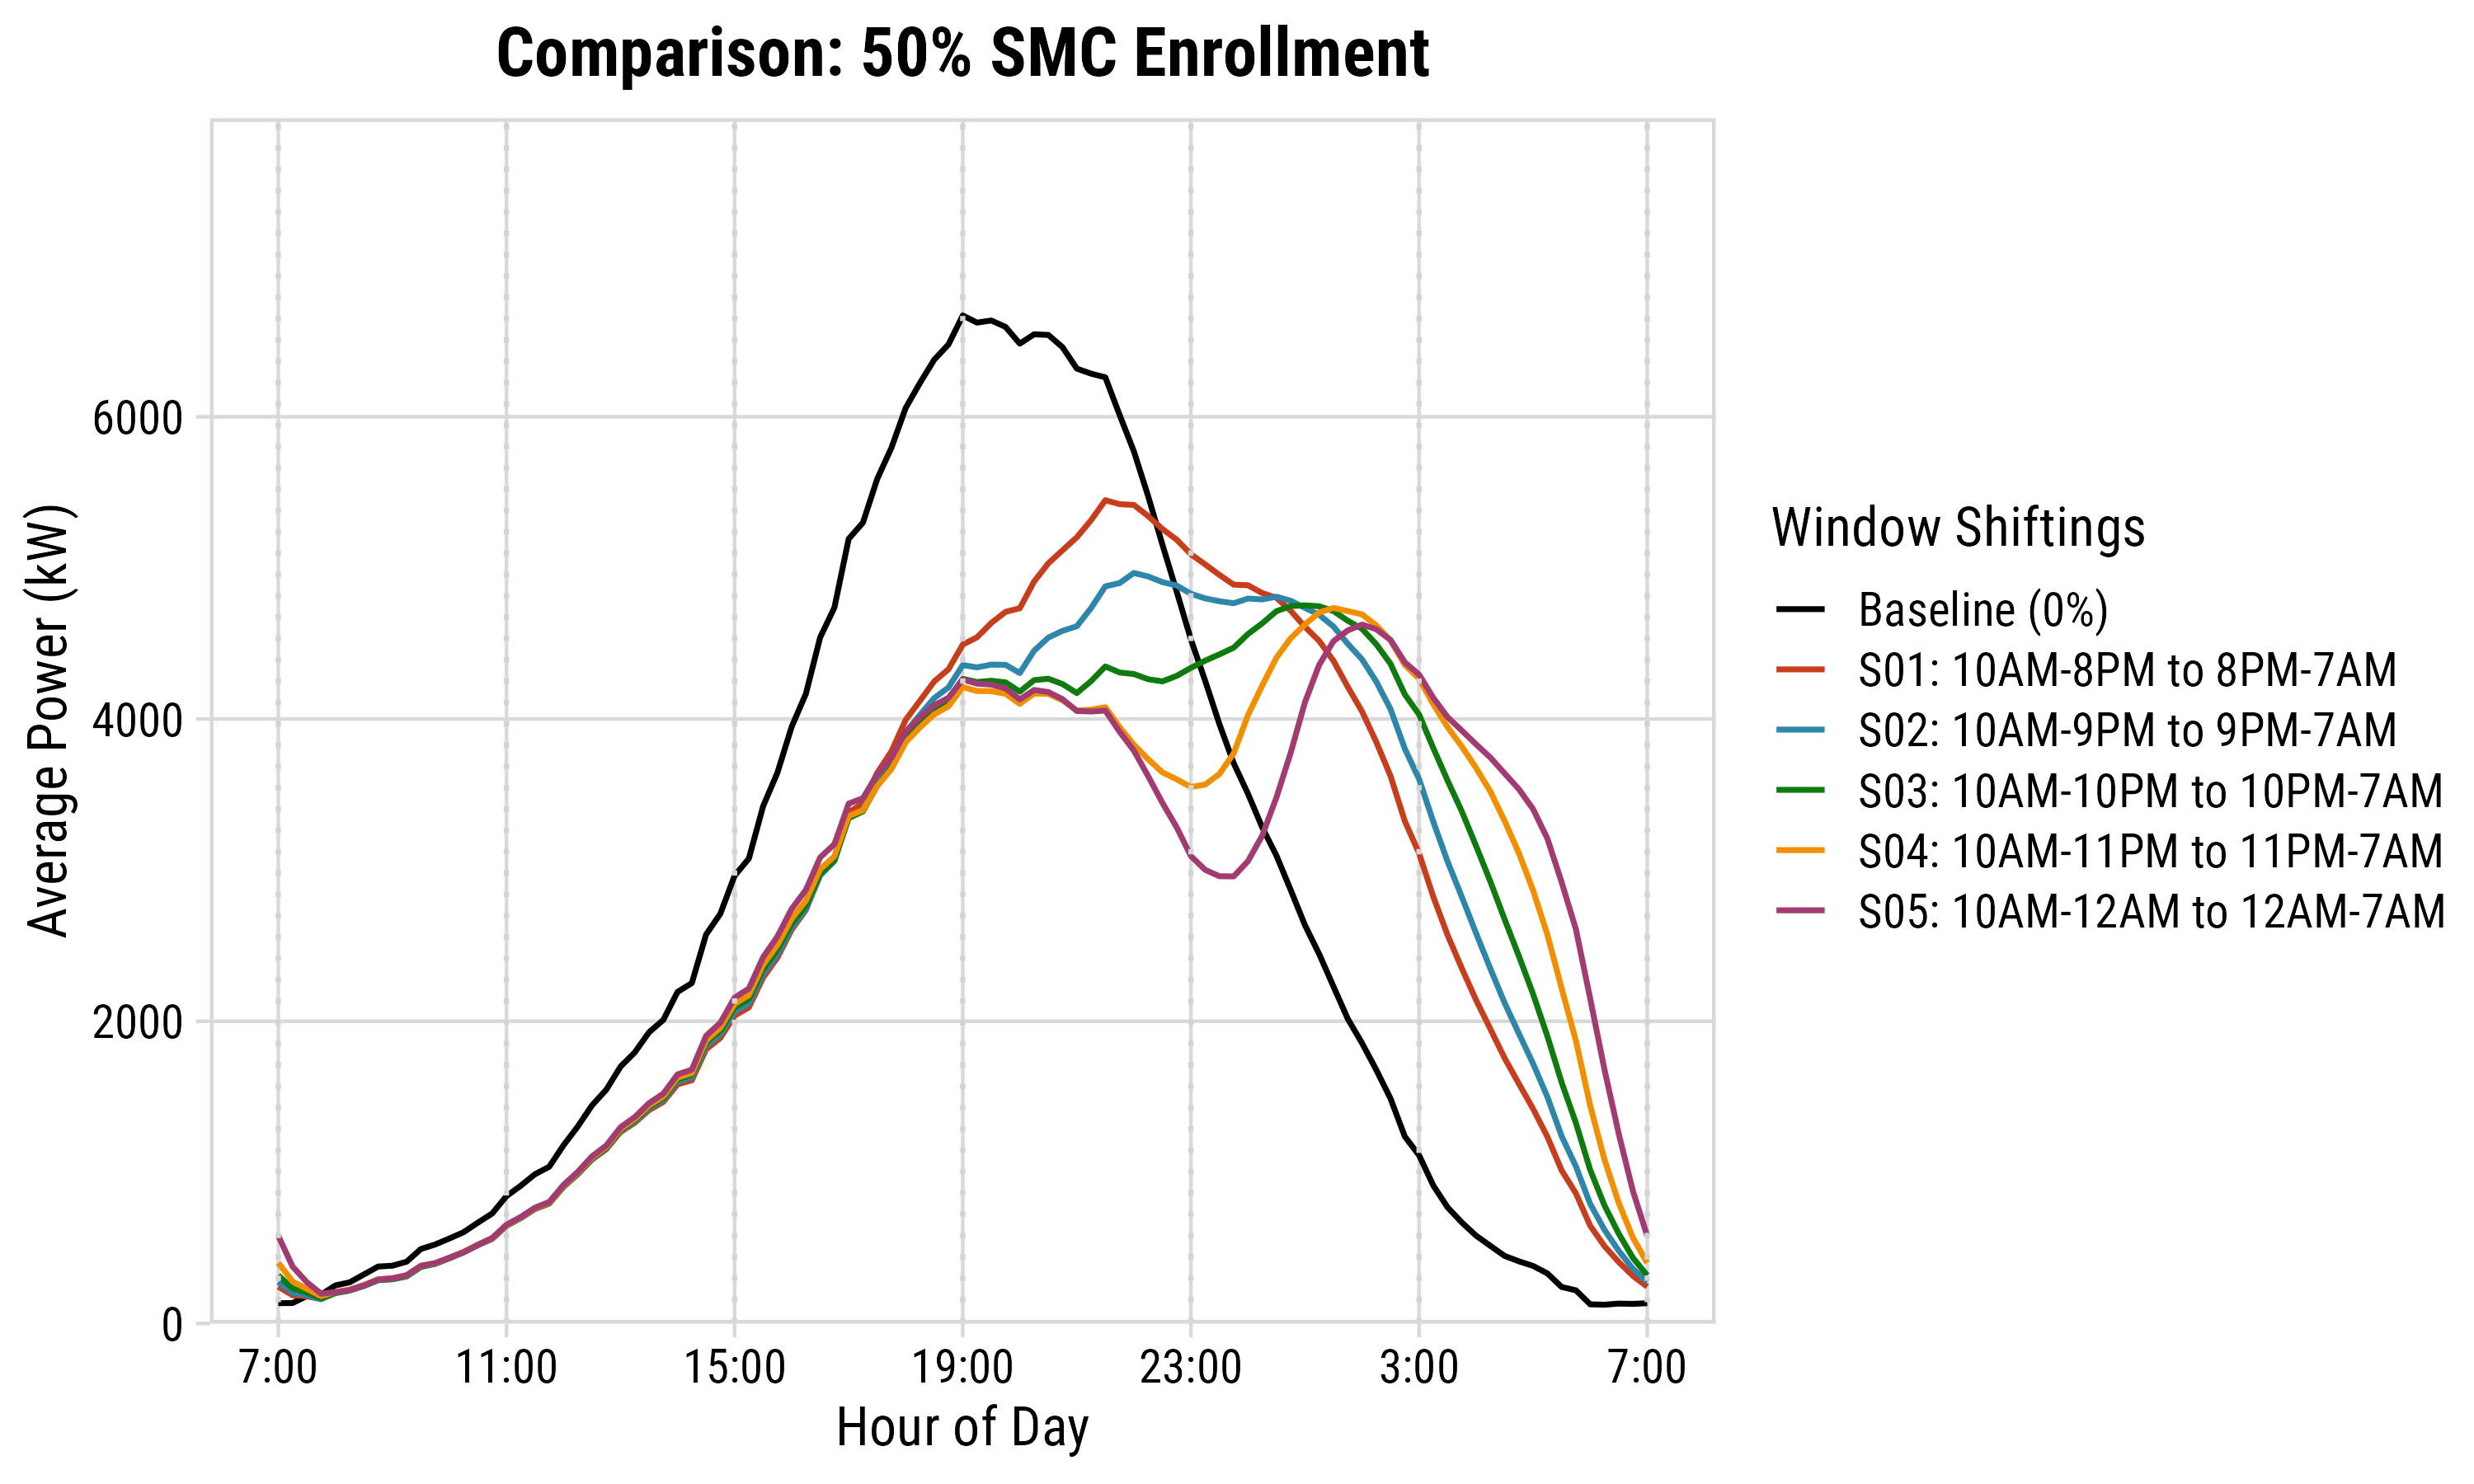
Five configurations with different peak/valley windows.
Step 4: Net Load + BEV & Peak Shaving
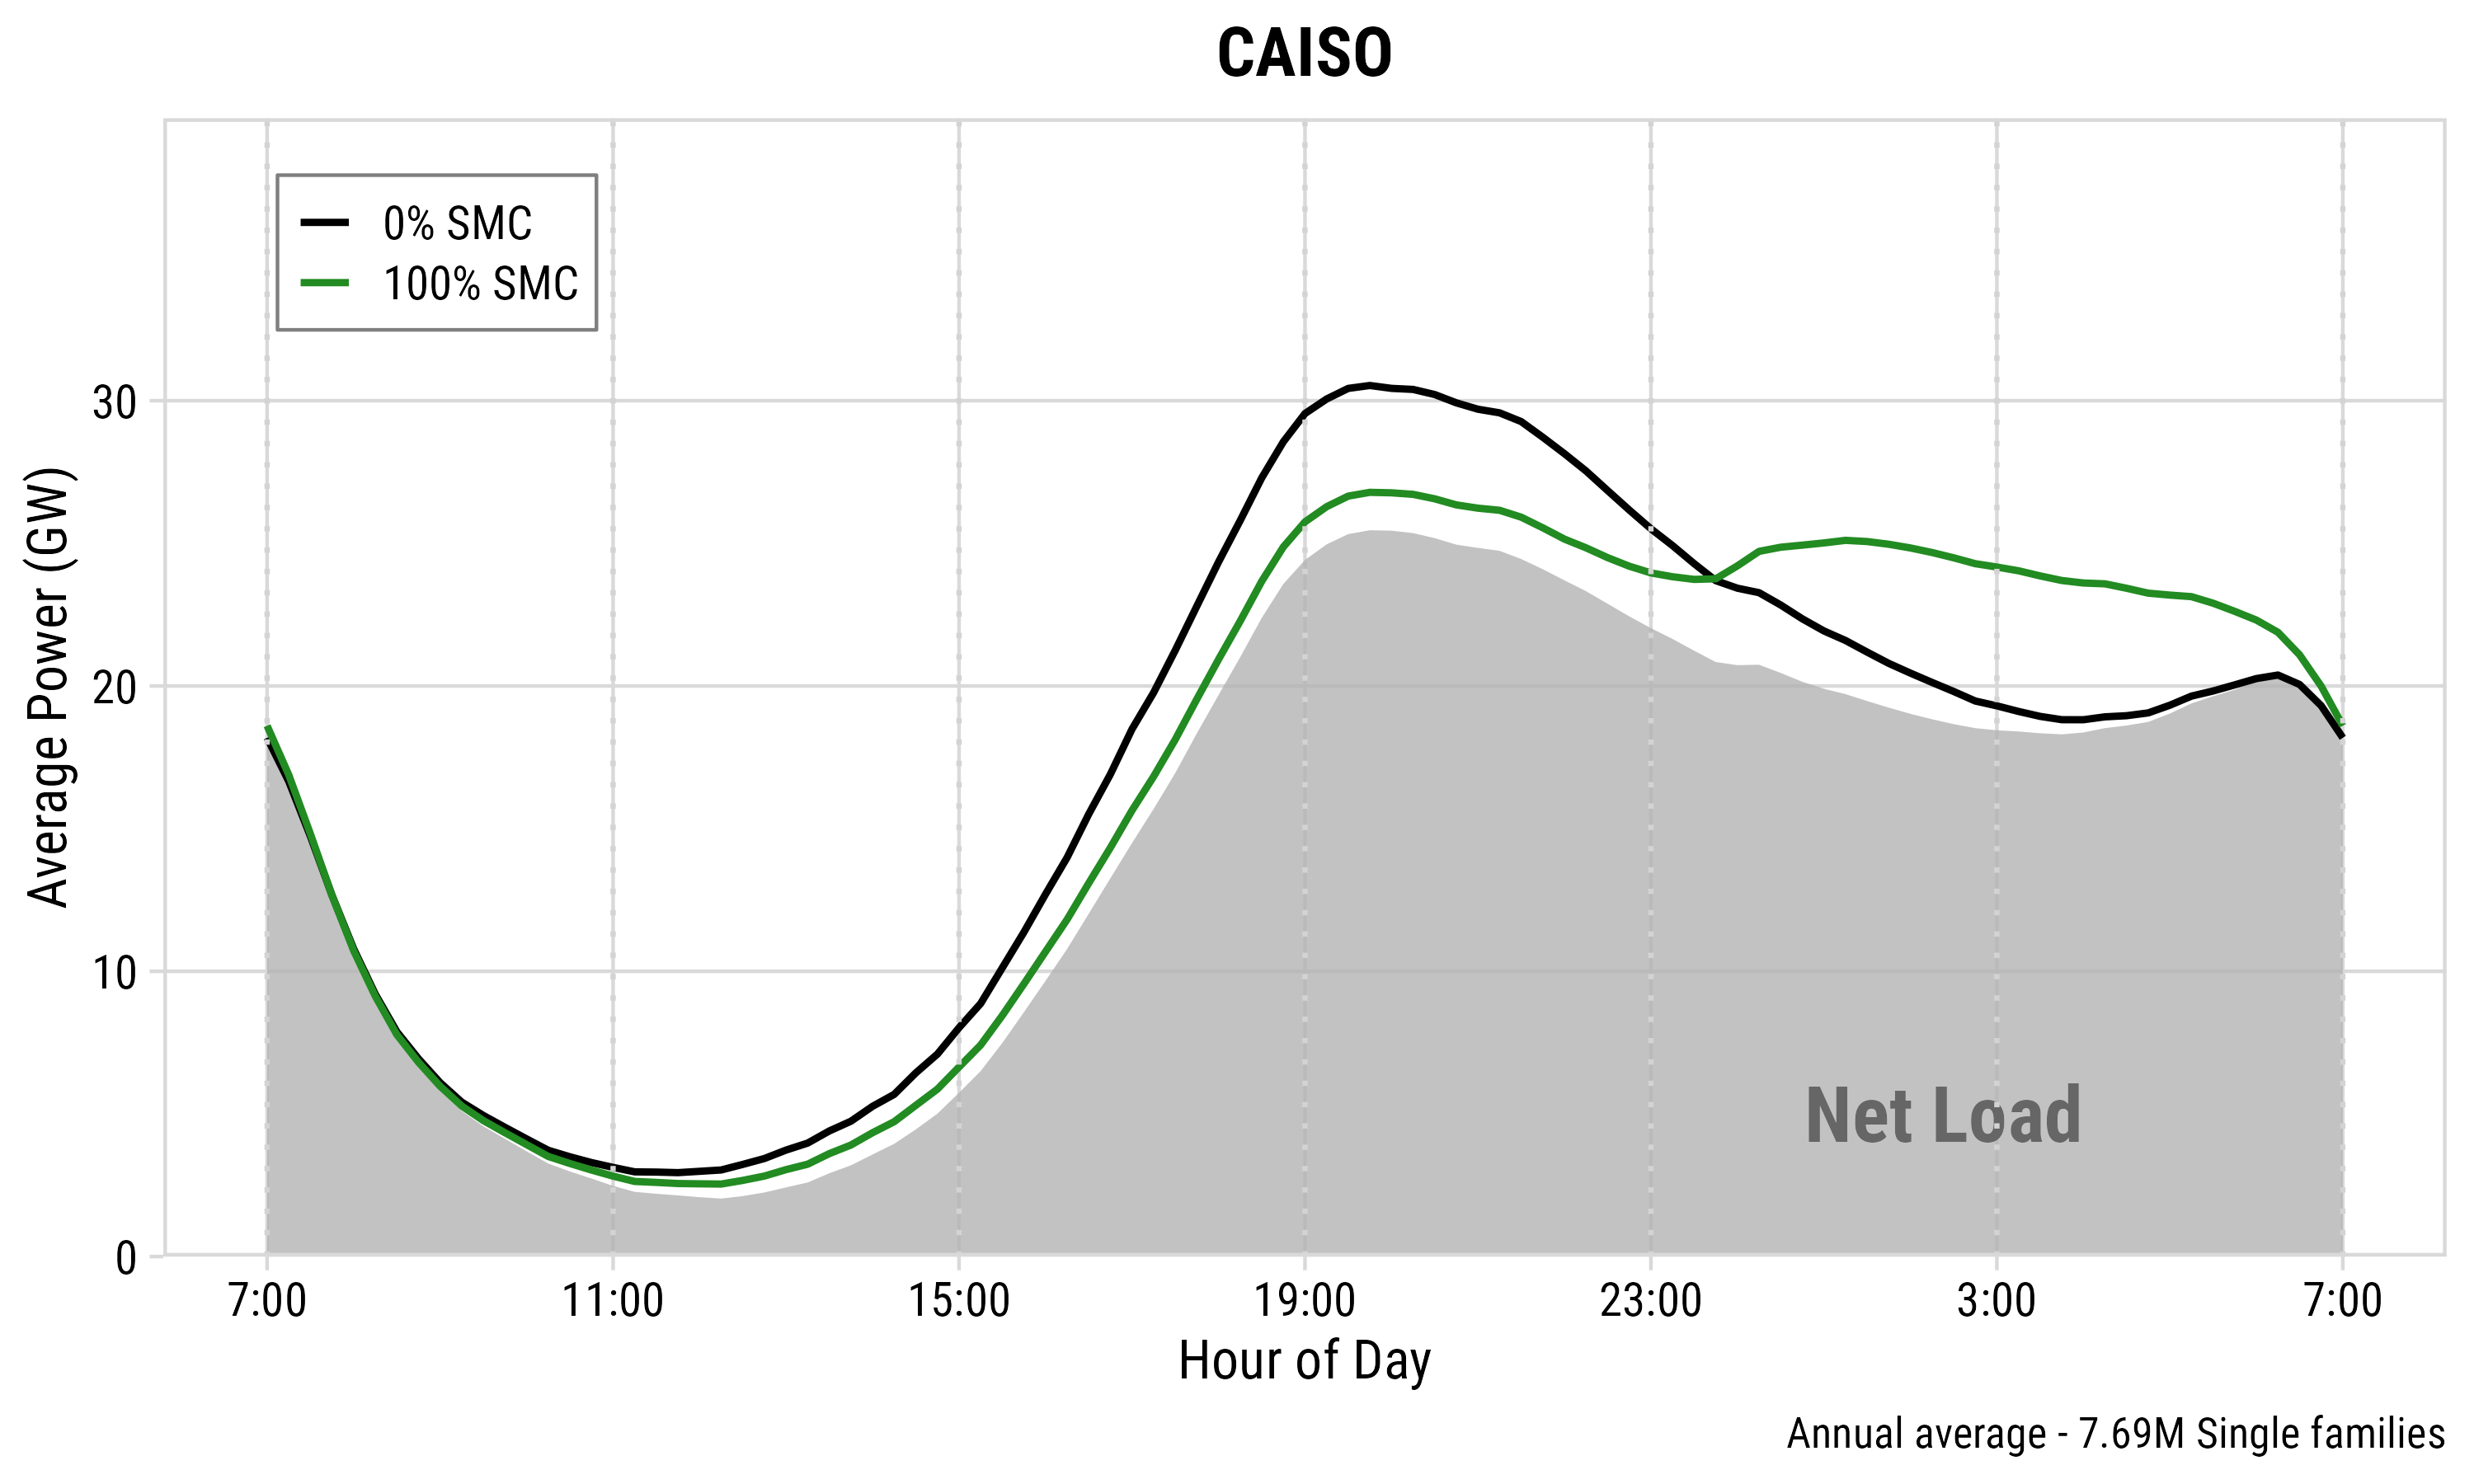
BEV load scaled to fleet size and stacked on net load.
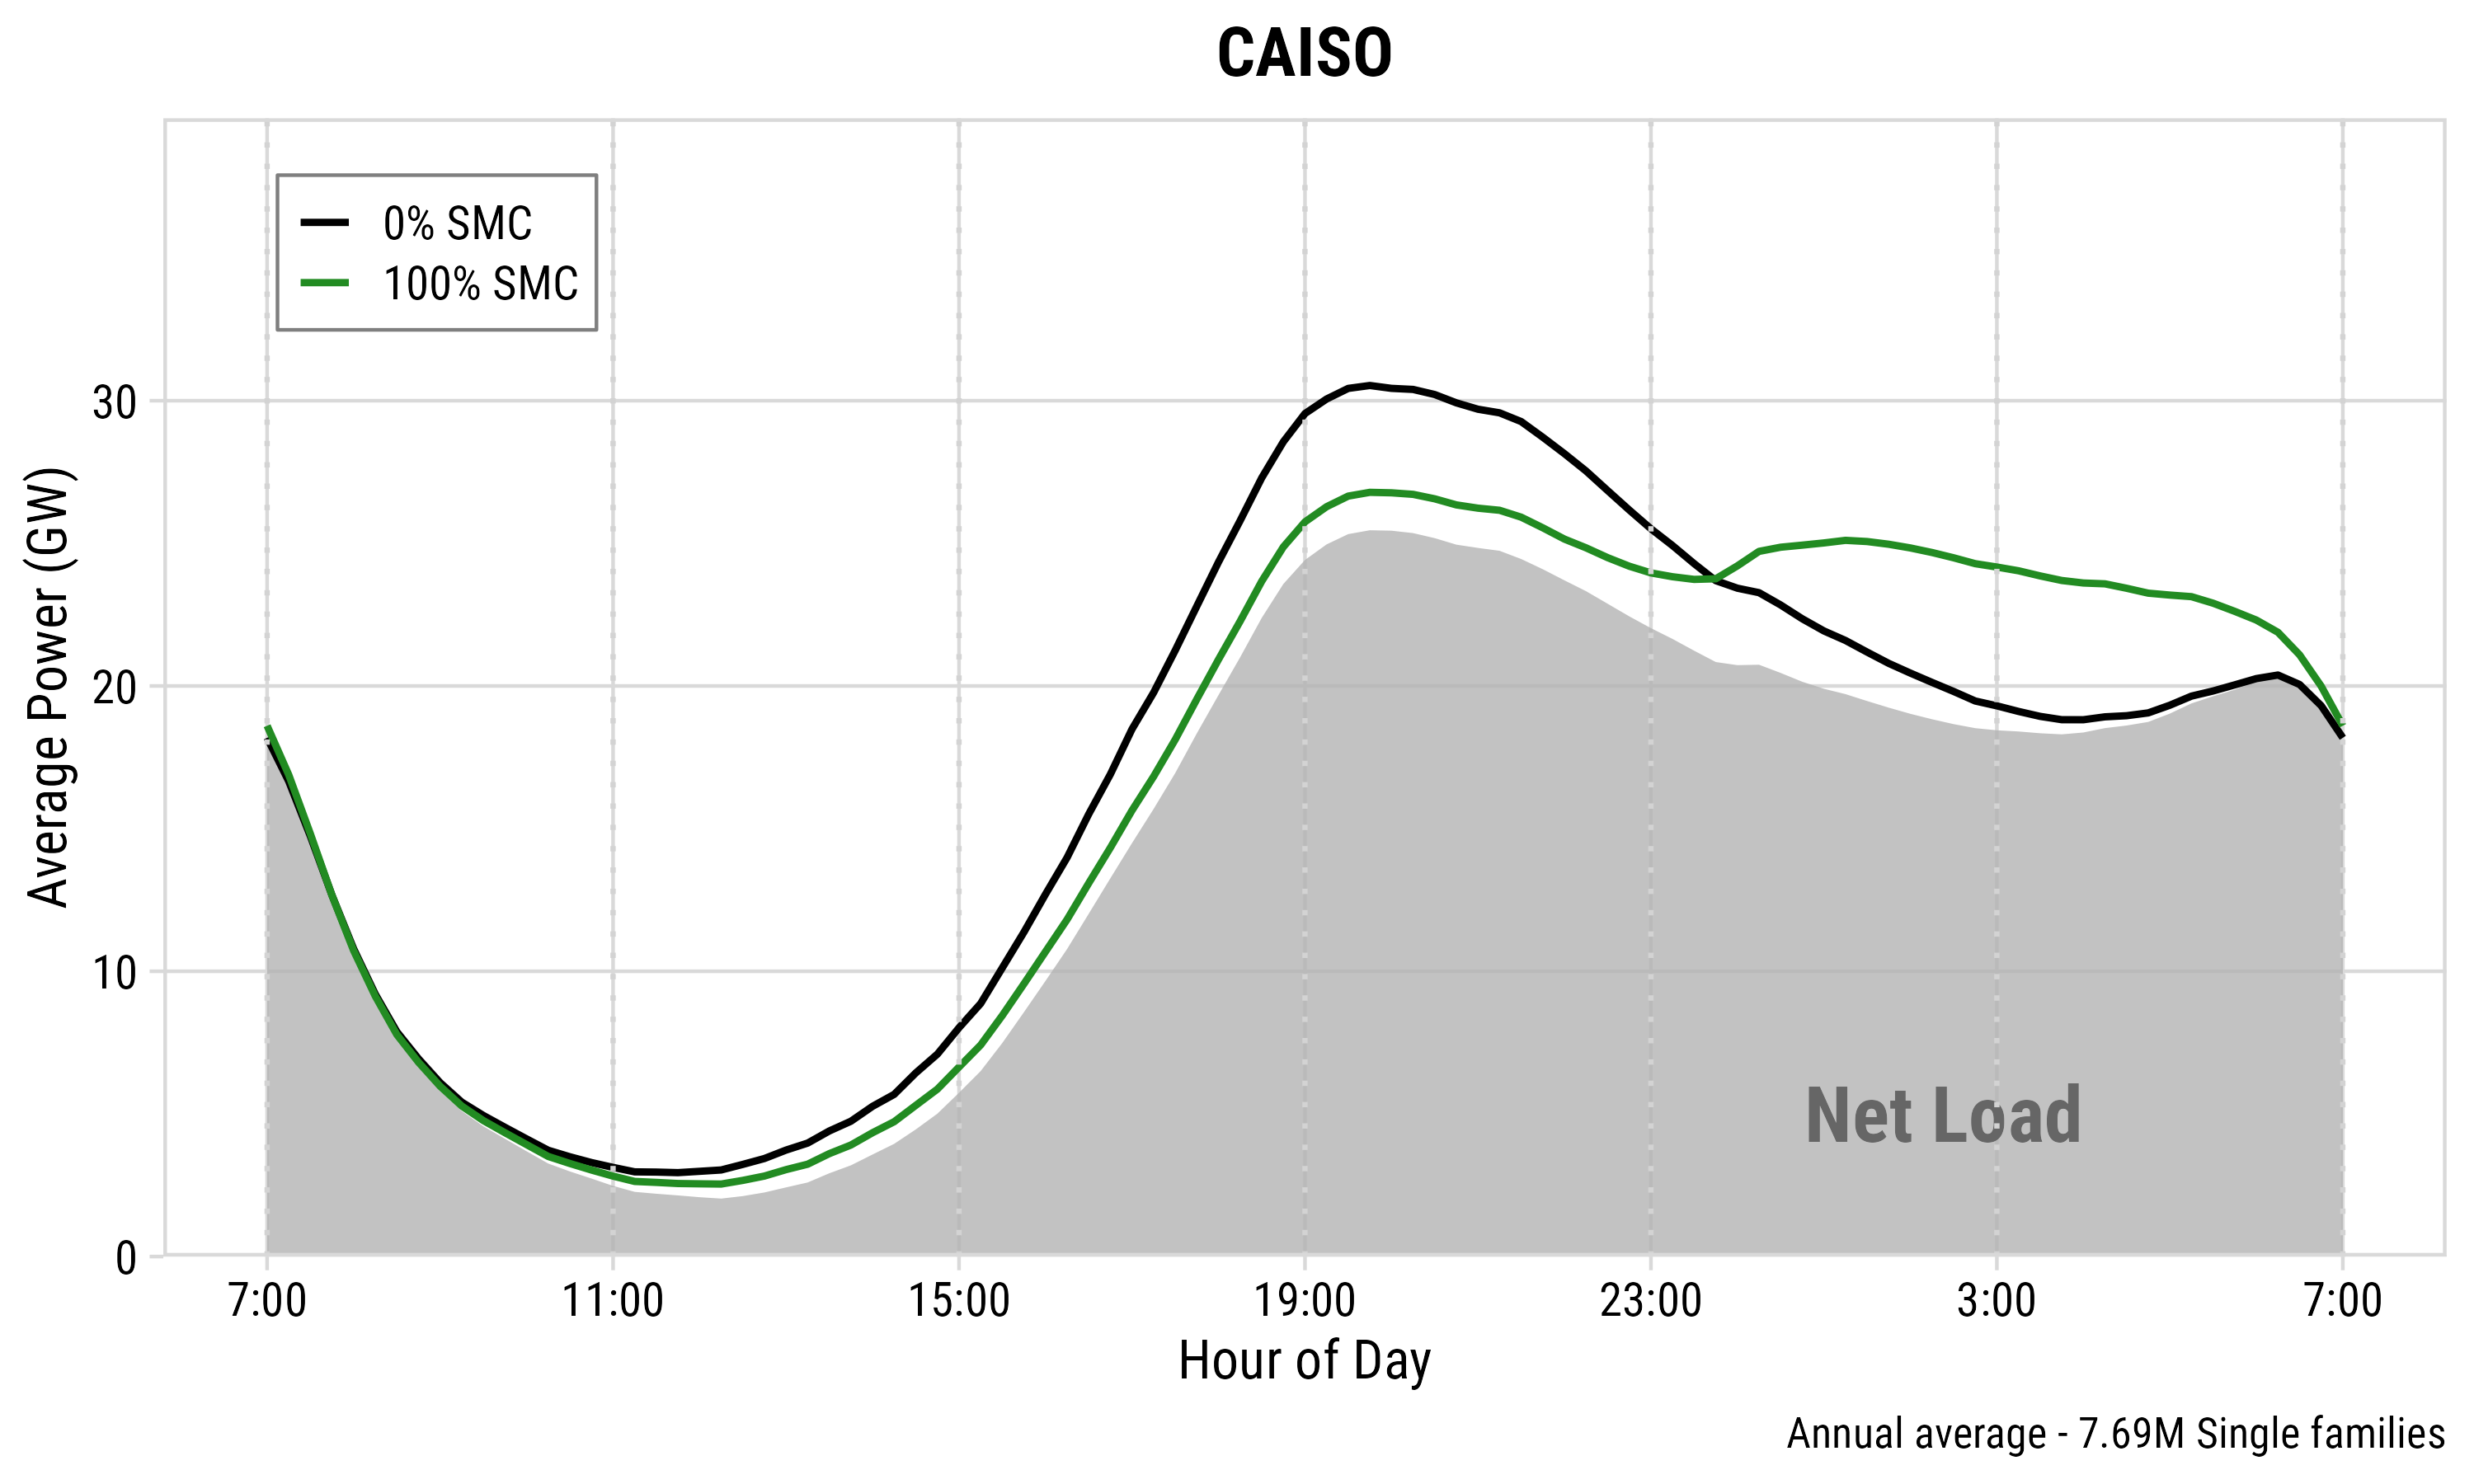
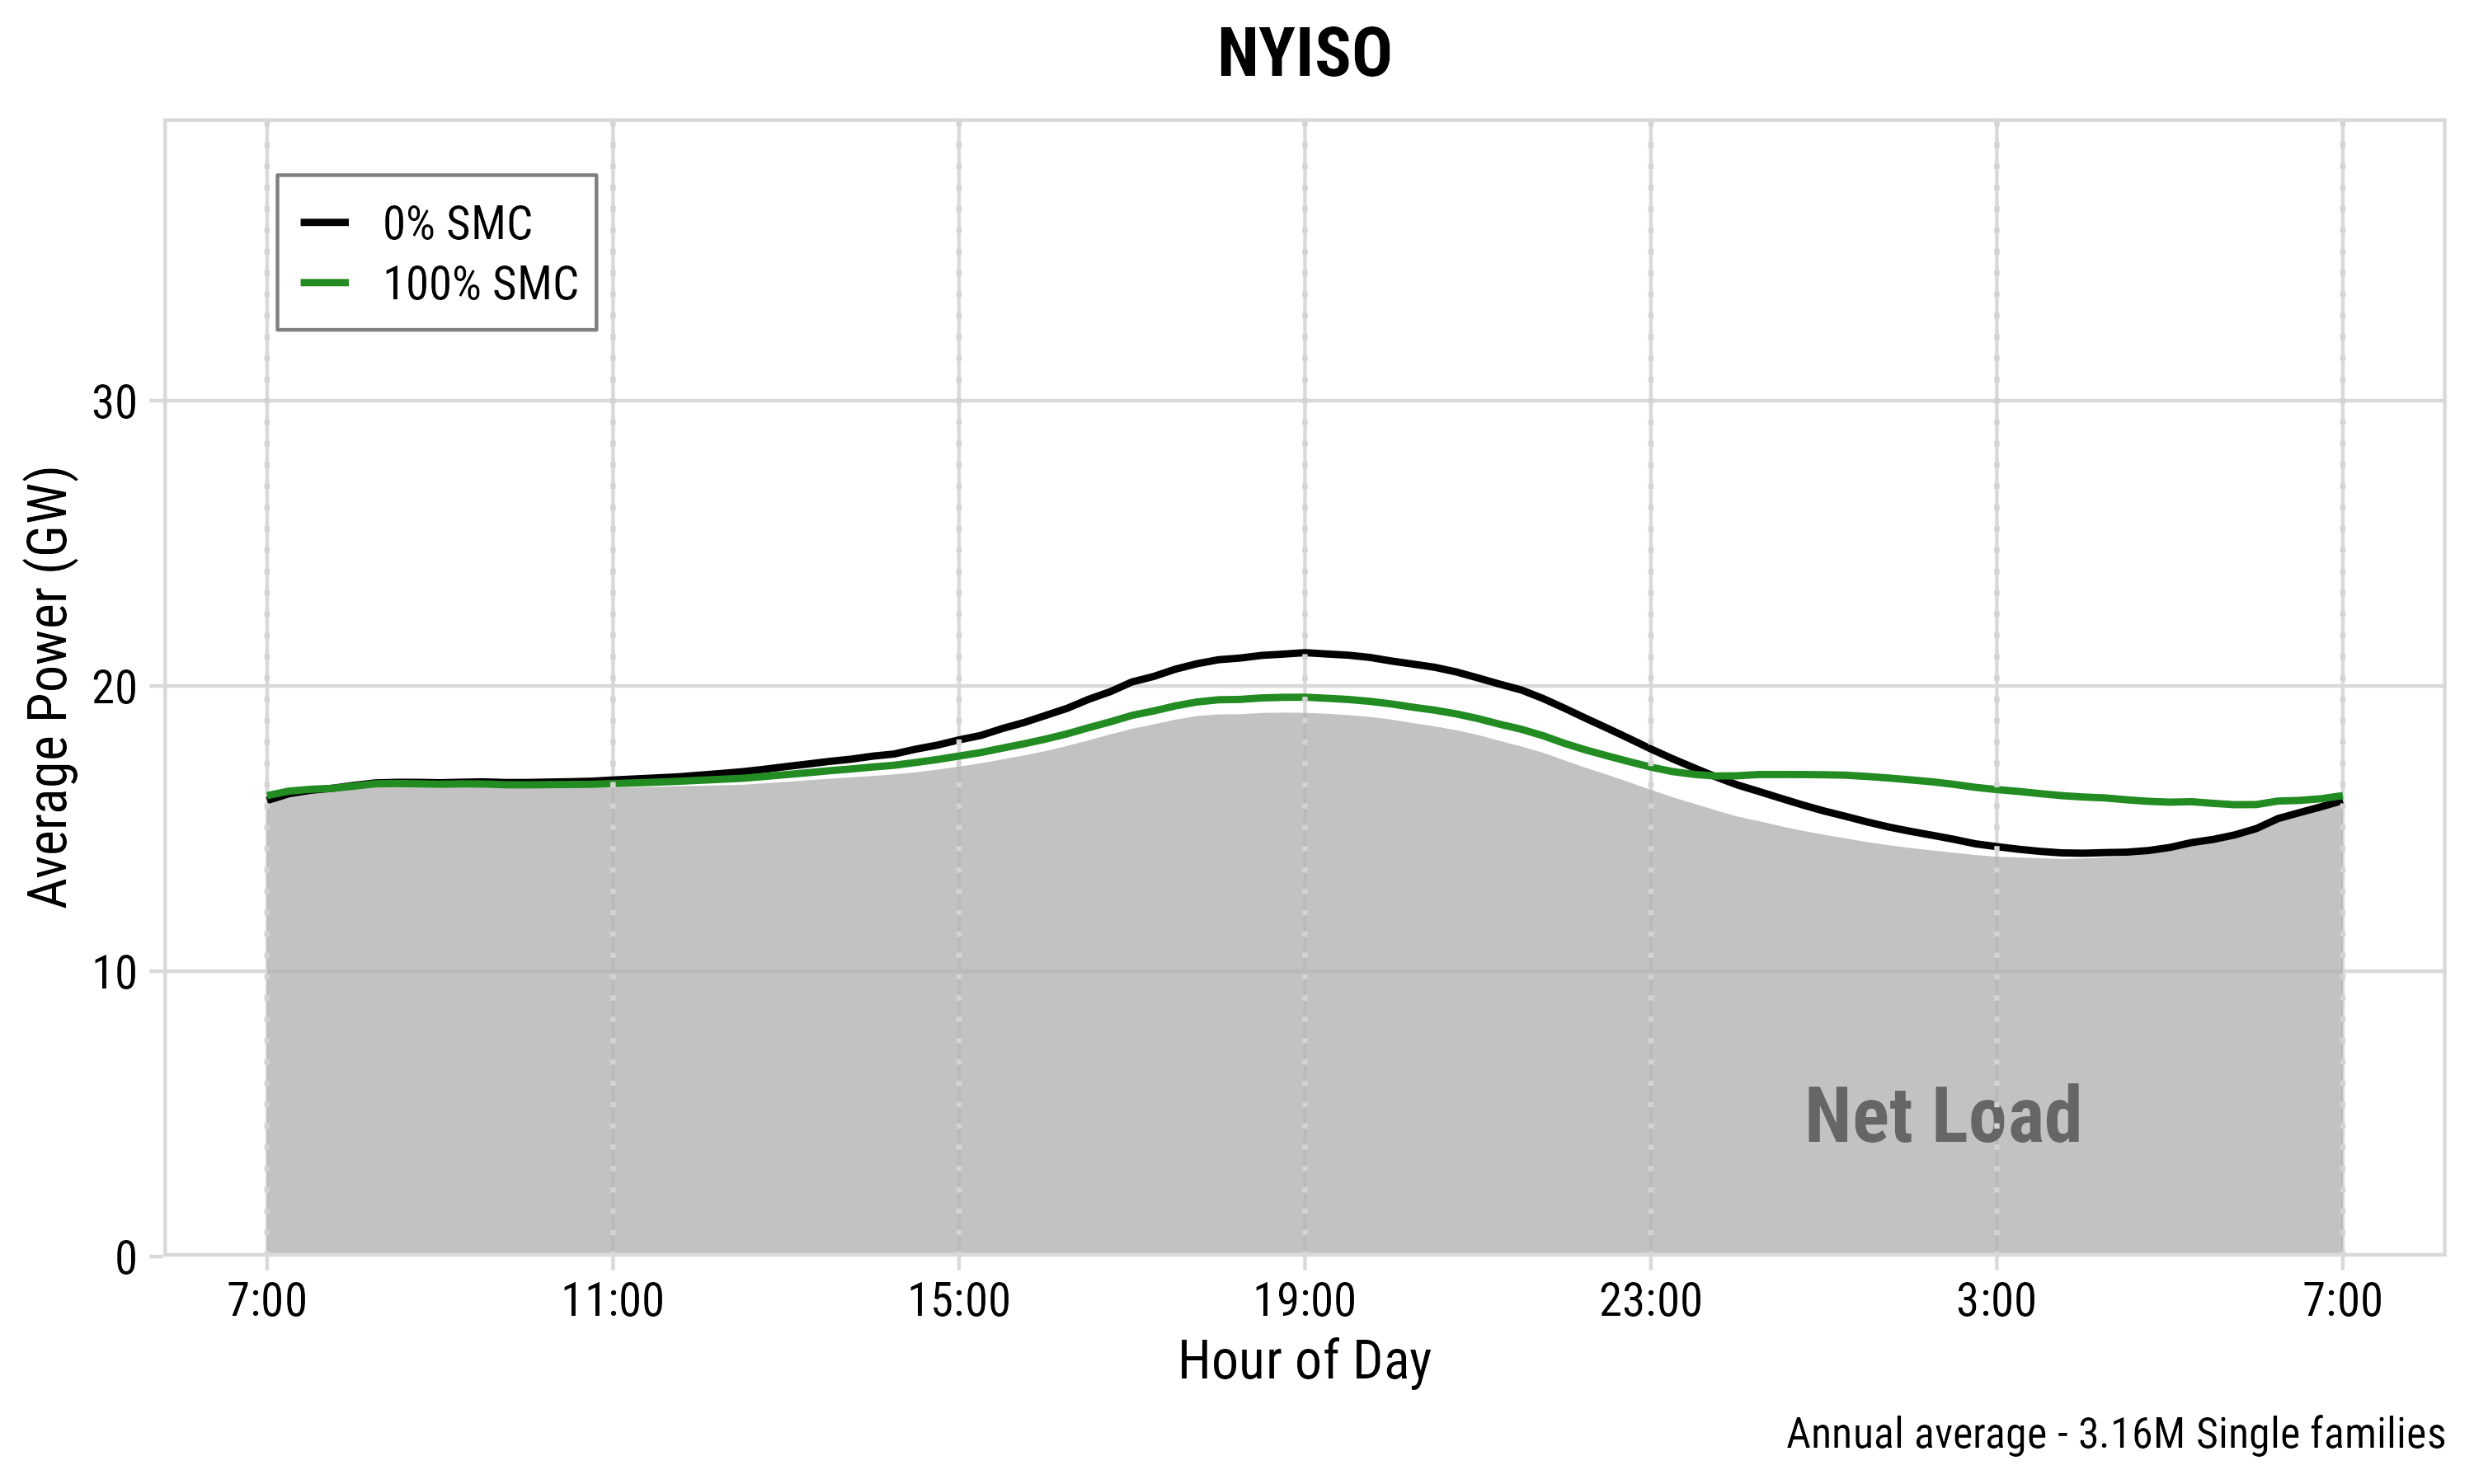
Peak Shaving: Annual Average
| CAISO | NYISO | ||
|---|---|---|---|
|
|
||
| Peak shave | 3.7 GW (30.5 → 26.8) | Peak shave | 1.6 GW (21.2 → 19.6) |
| Percentage | 12.1% | Percentage | 7.5% |
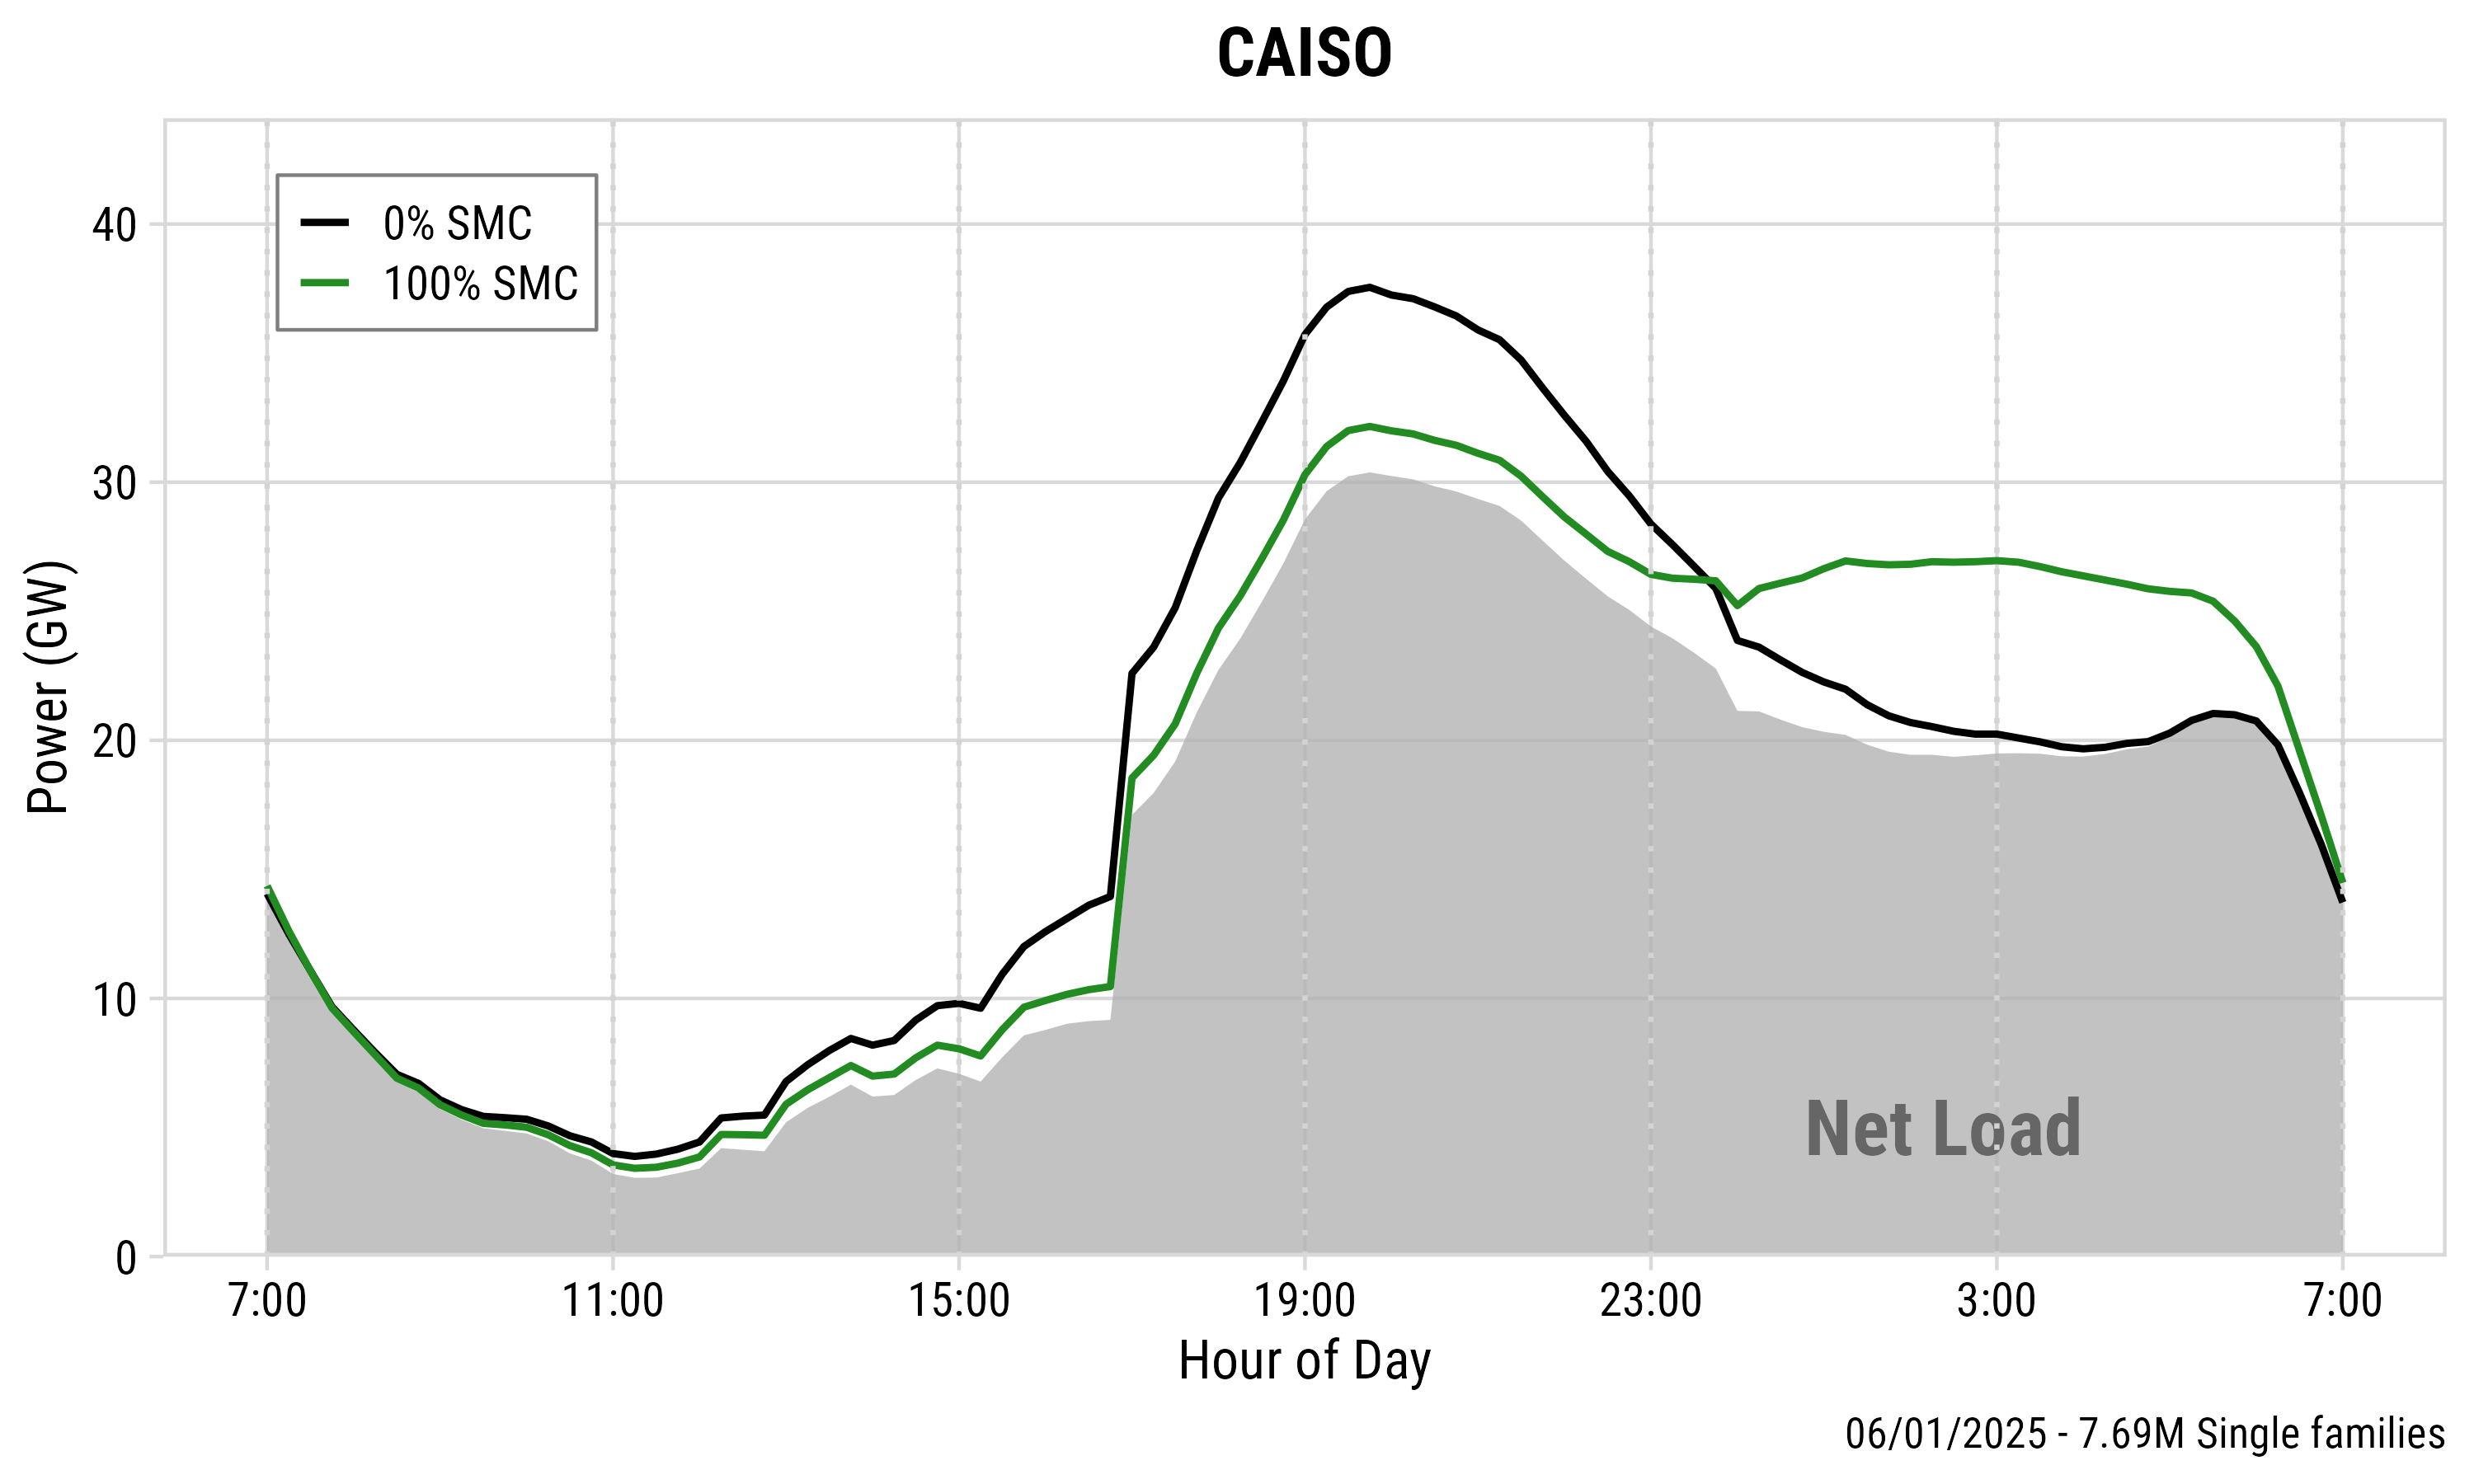
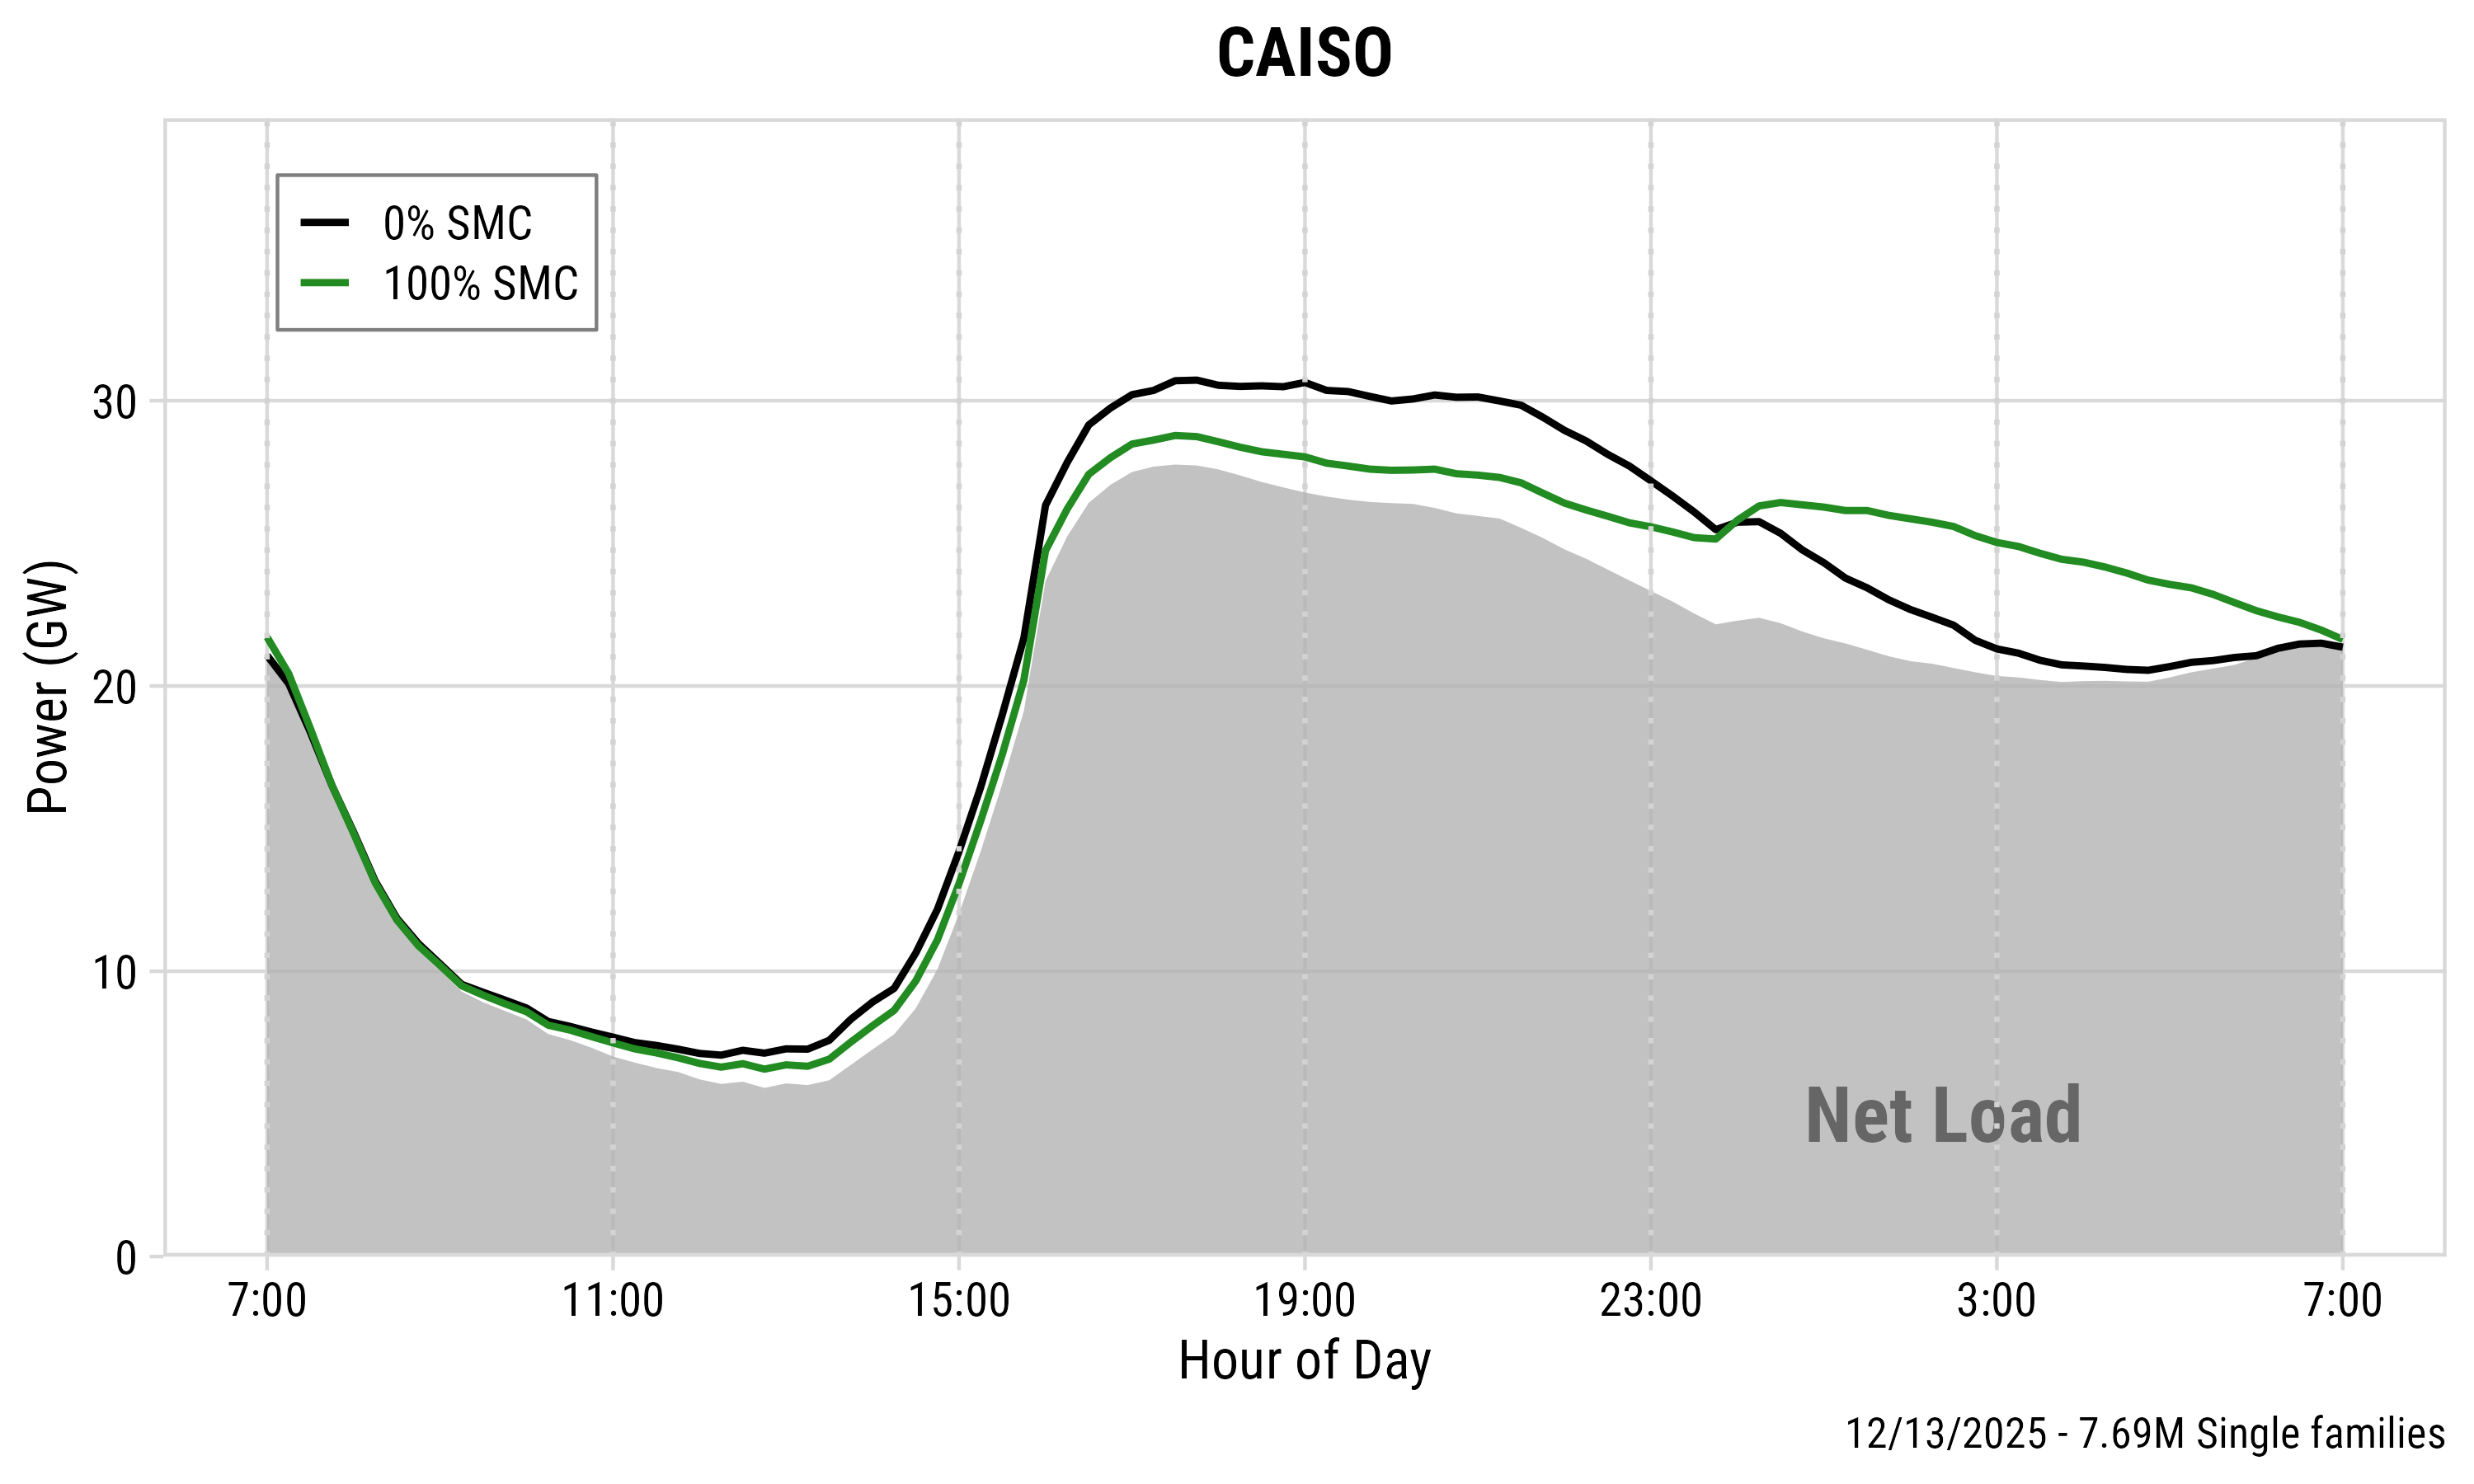
Peak Shaving: CAISO Extreme Days
| Best Day (Jun 1) | Worst Day (Dec 13) | ||
|---|---|---|---|
|
|
||
| Peak shave | 5.4 GW (37.6 → 32.2) | Peak shave | 1.9 GW (30.7 → 28.8) |
| Percentage | 14.4% | Percentage | 6.2% |
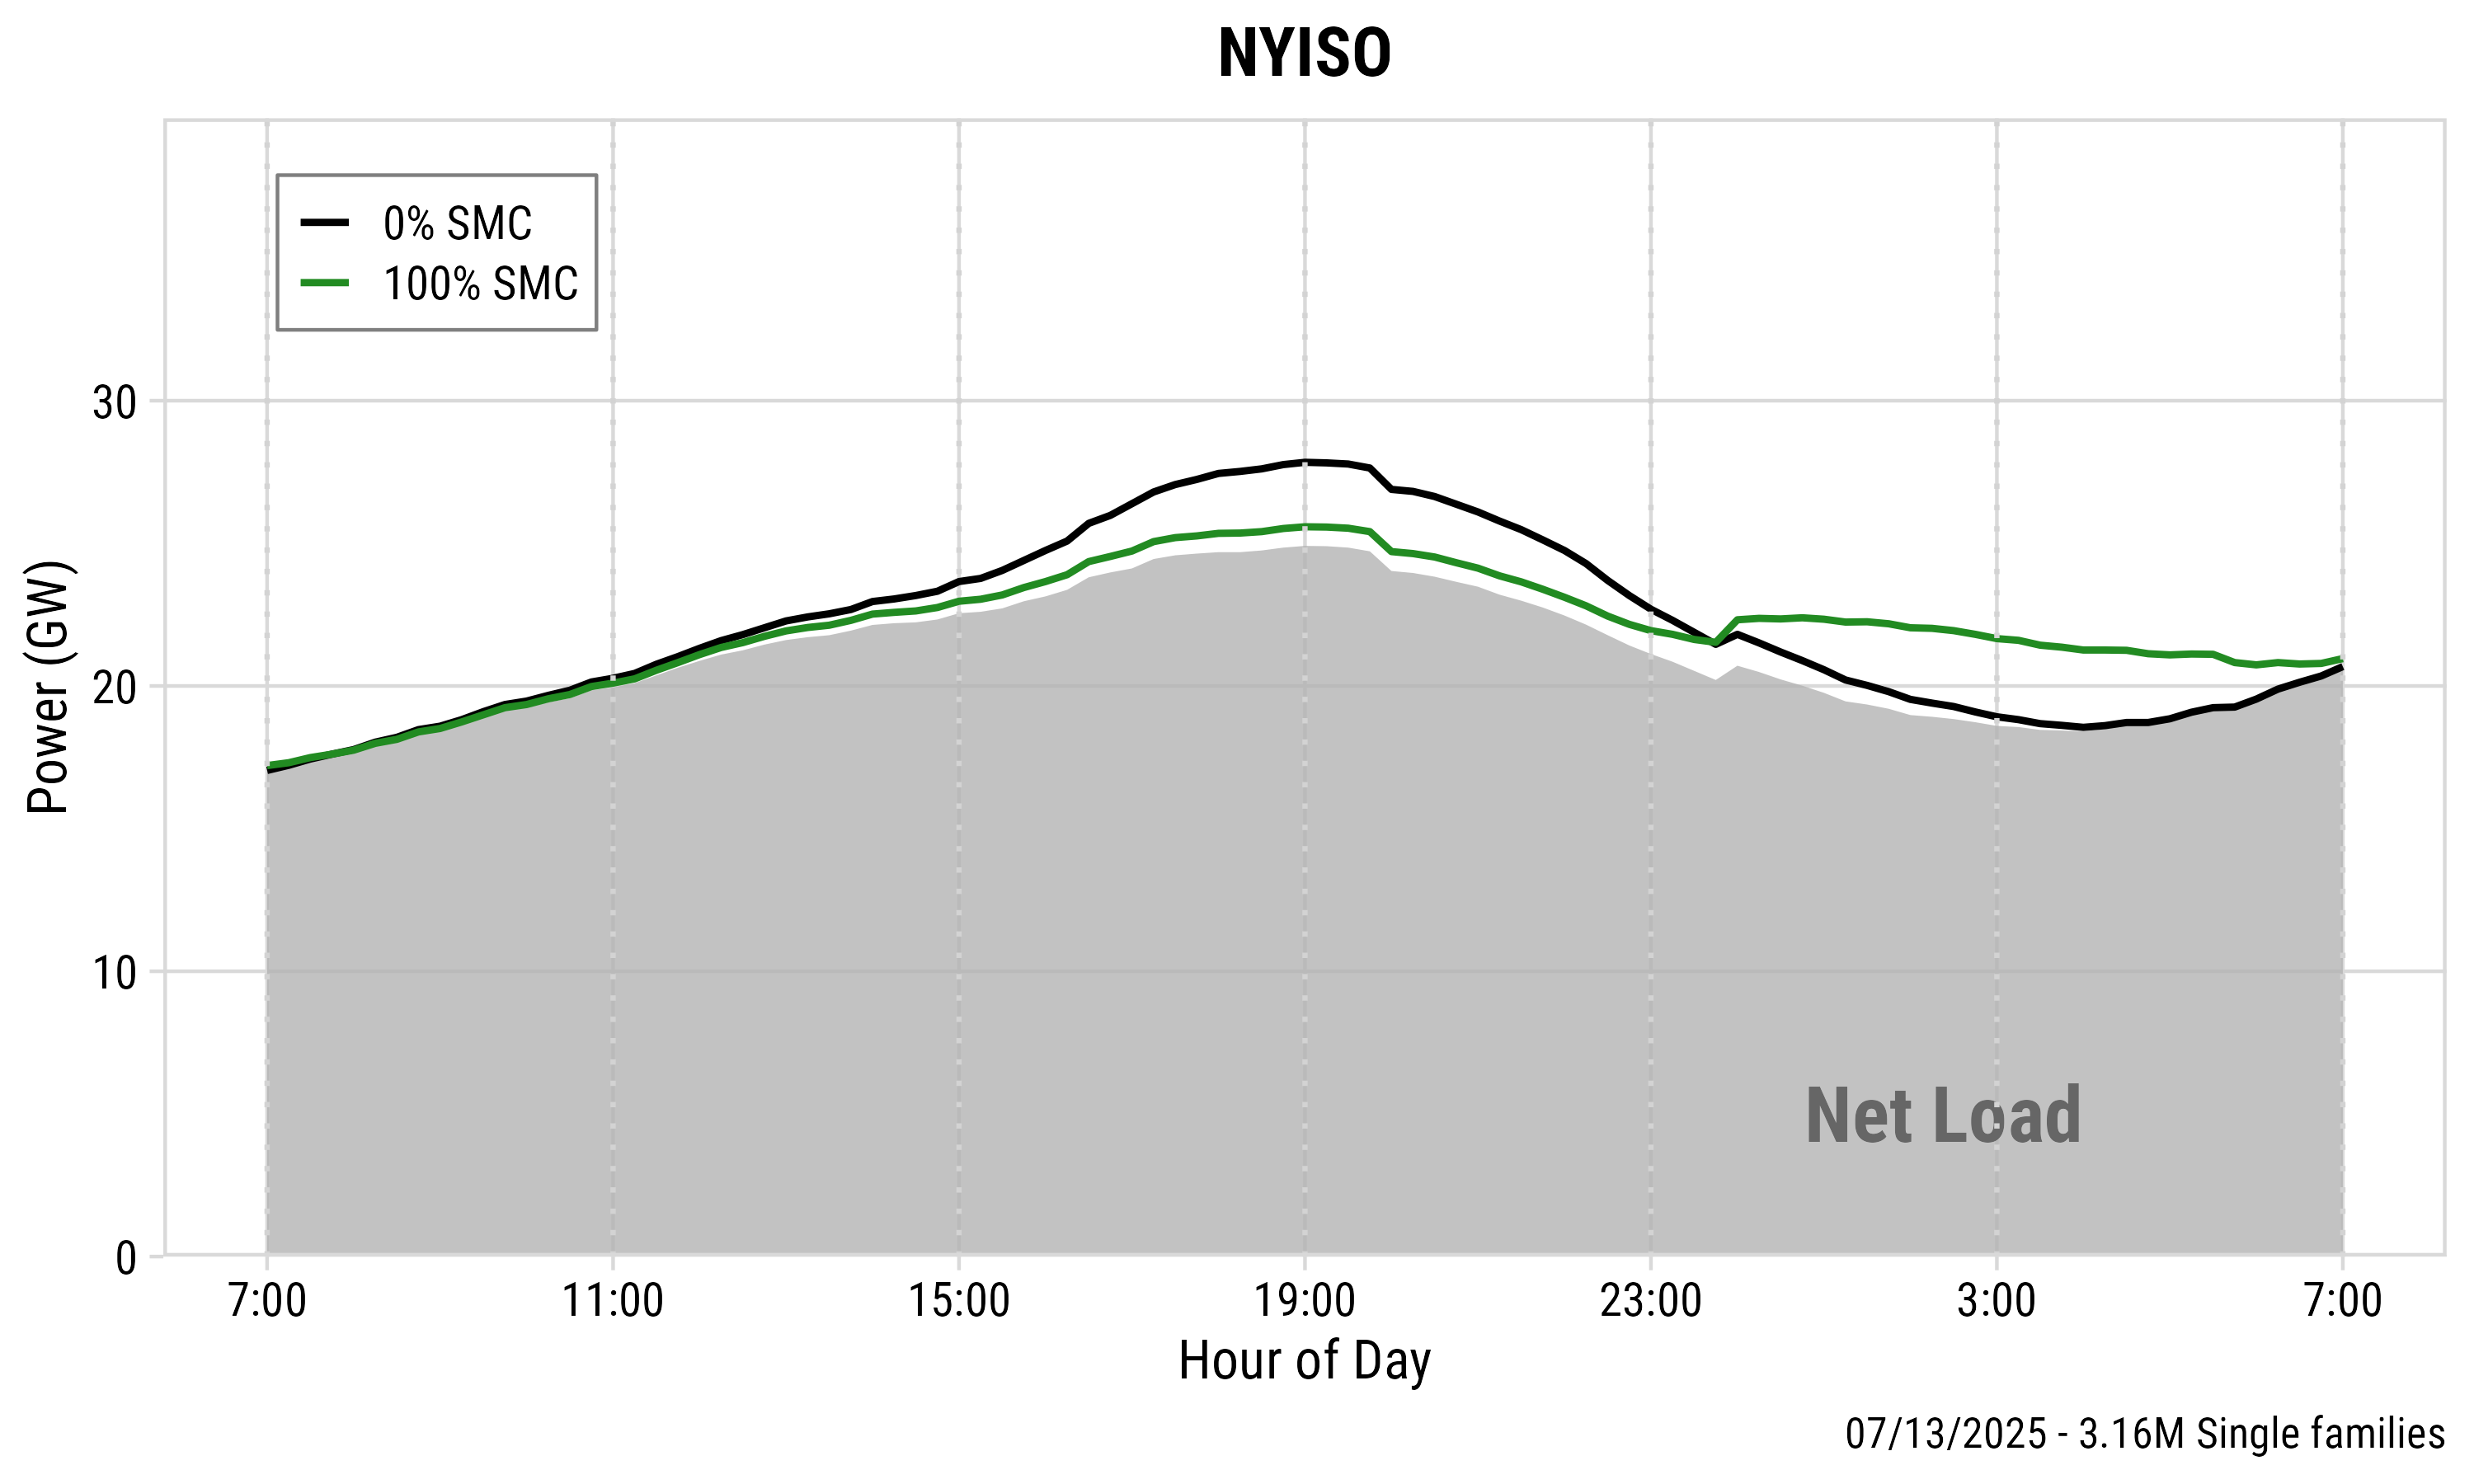
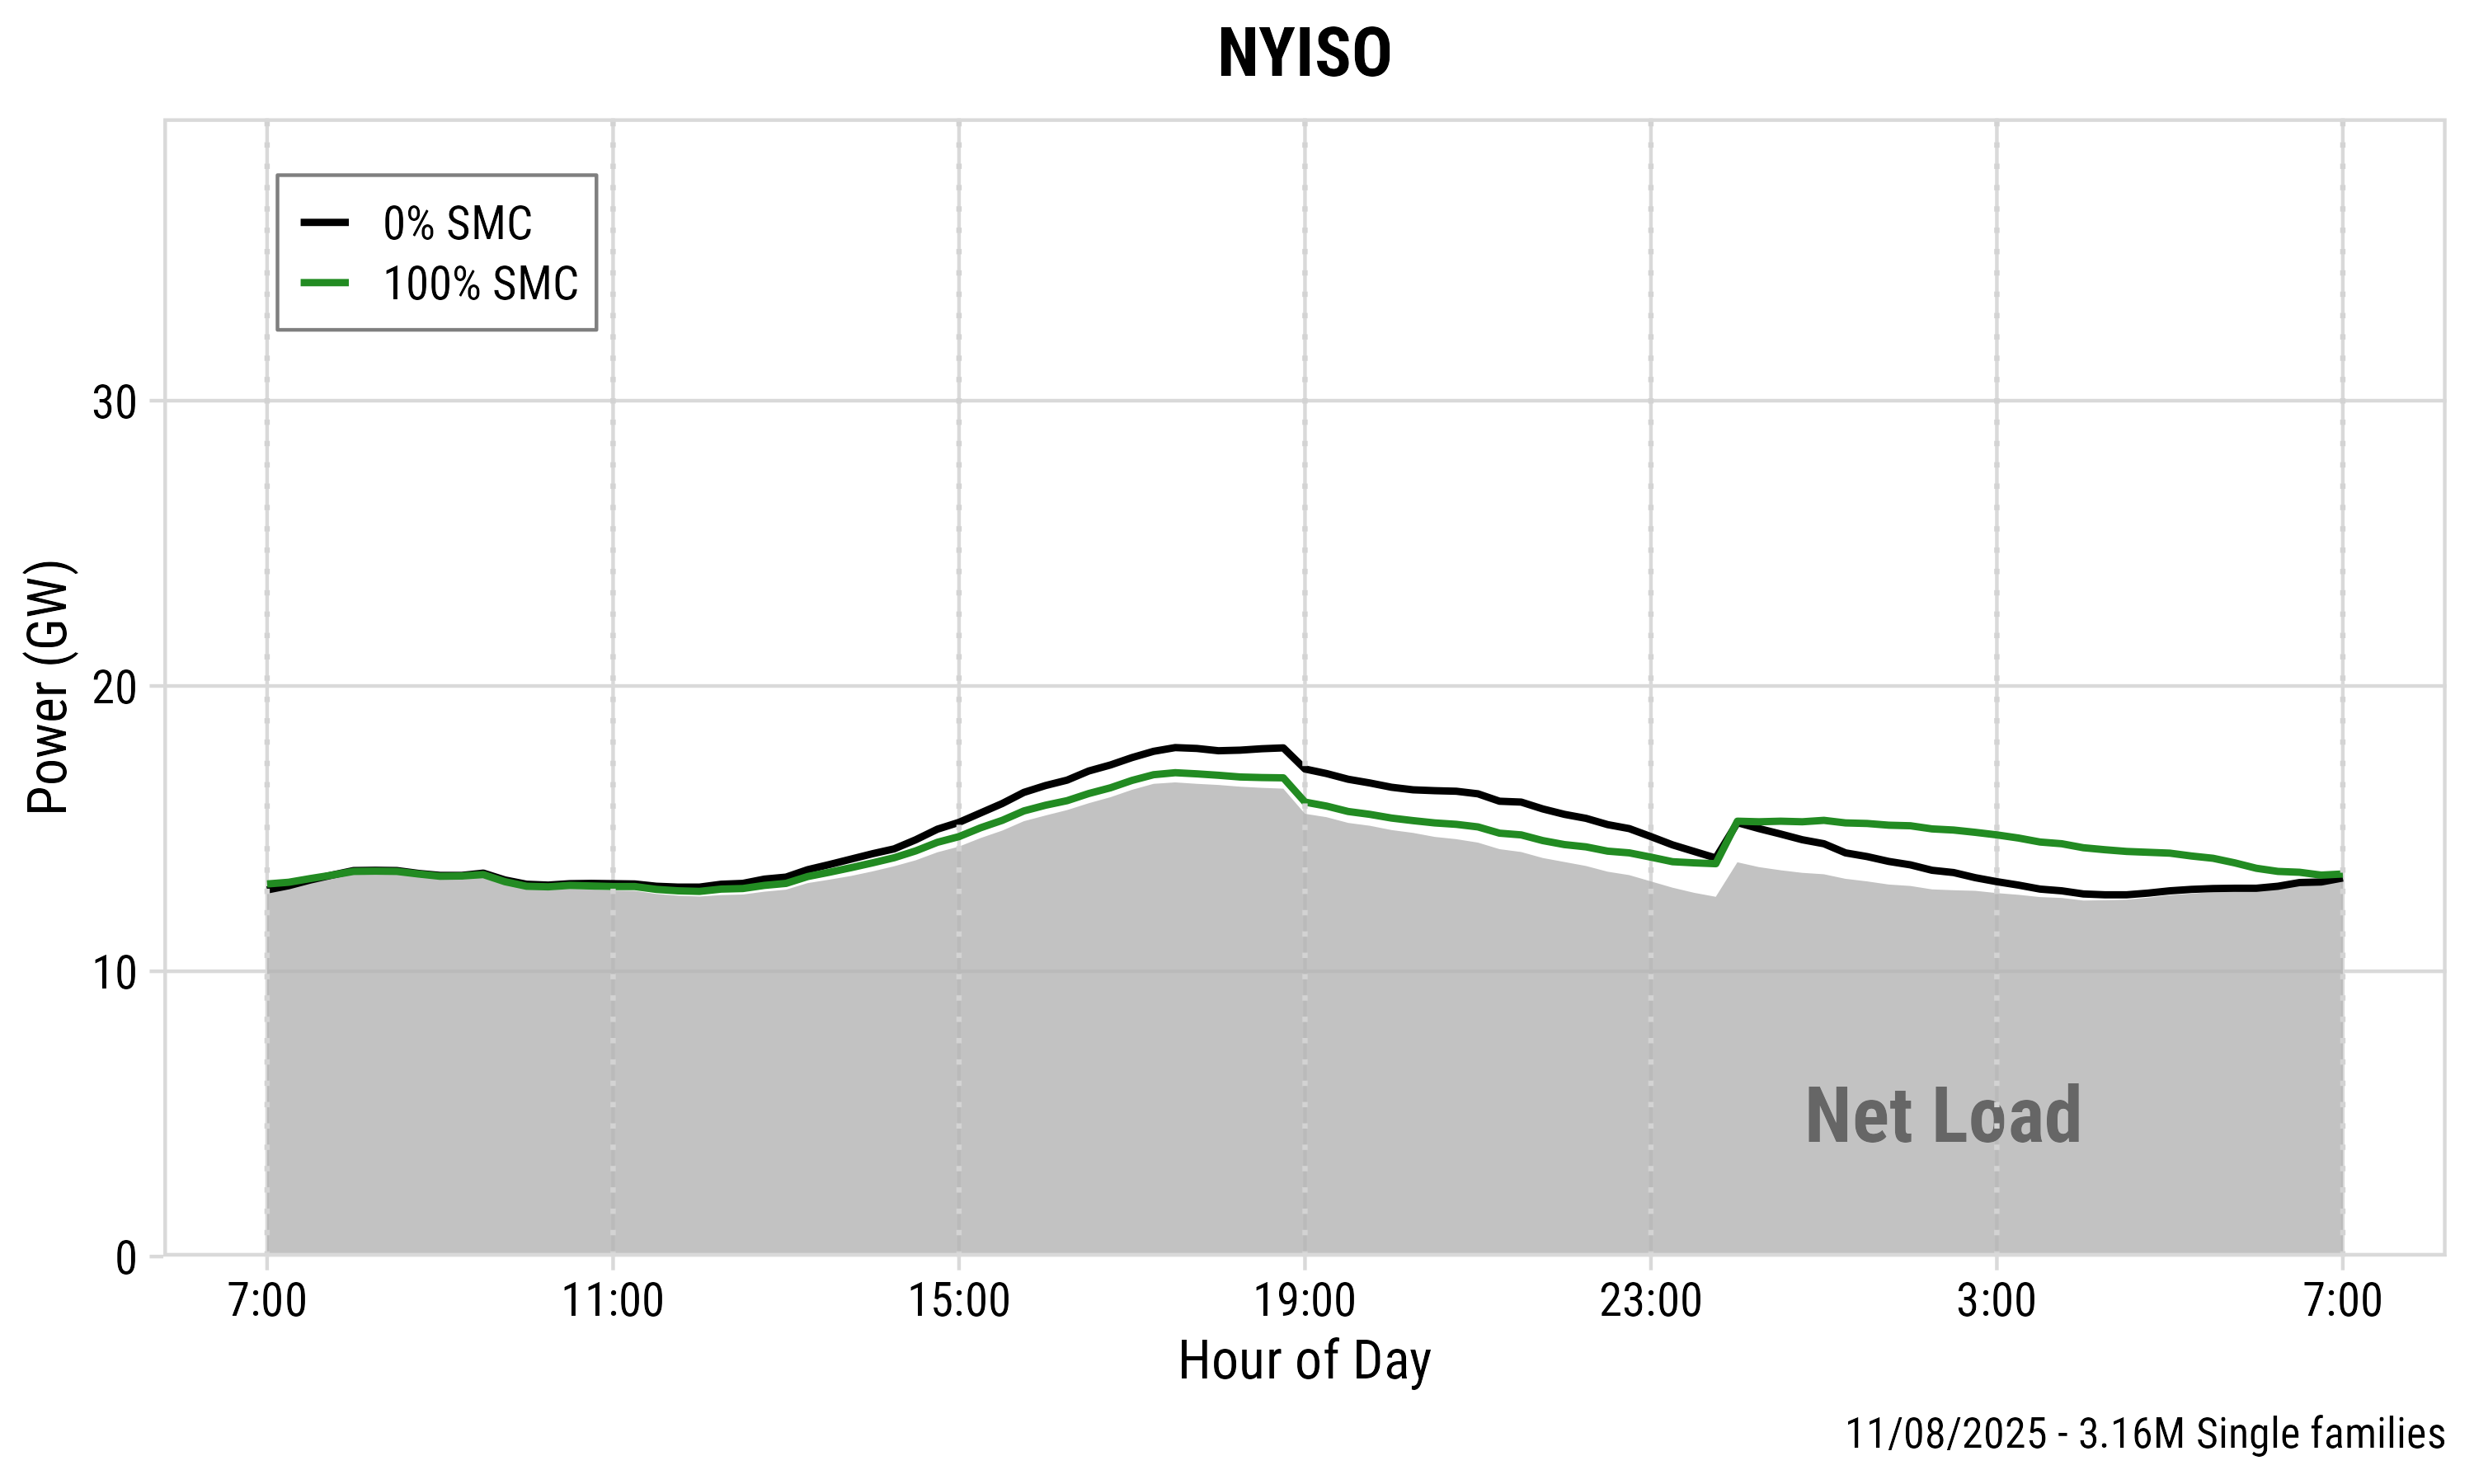
Peak Shaving: NYISO Extreme Days
| Best Day (Jul 13) | Worst Day (Nov 8) | ||
|---|---|---|---|
|
|
||
| Peak shave | 2.2 GW (27.8 → 25.6) | Peak shave | 0.8 GW (17.8 → 17.0) |
| Percentage | 7.9% | Percentage | 4.5% |
Enrollment Curve from Study 1
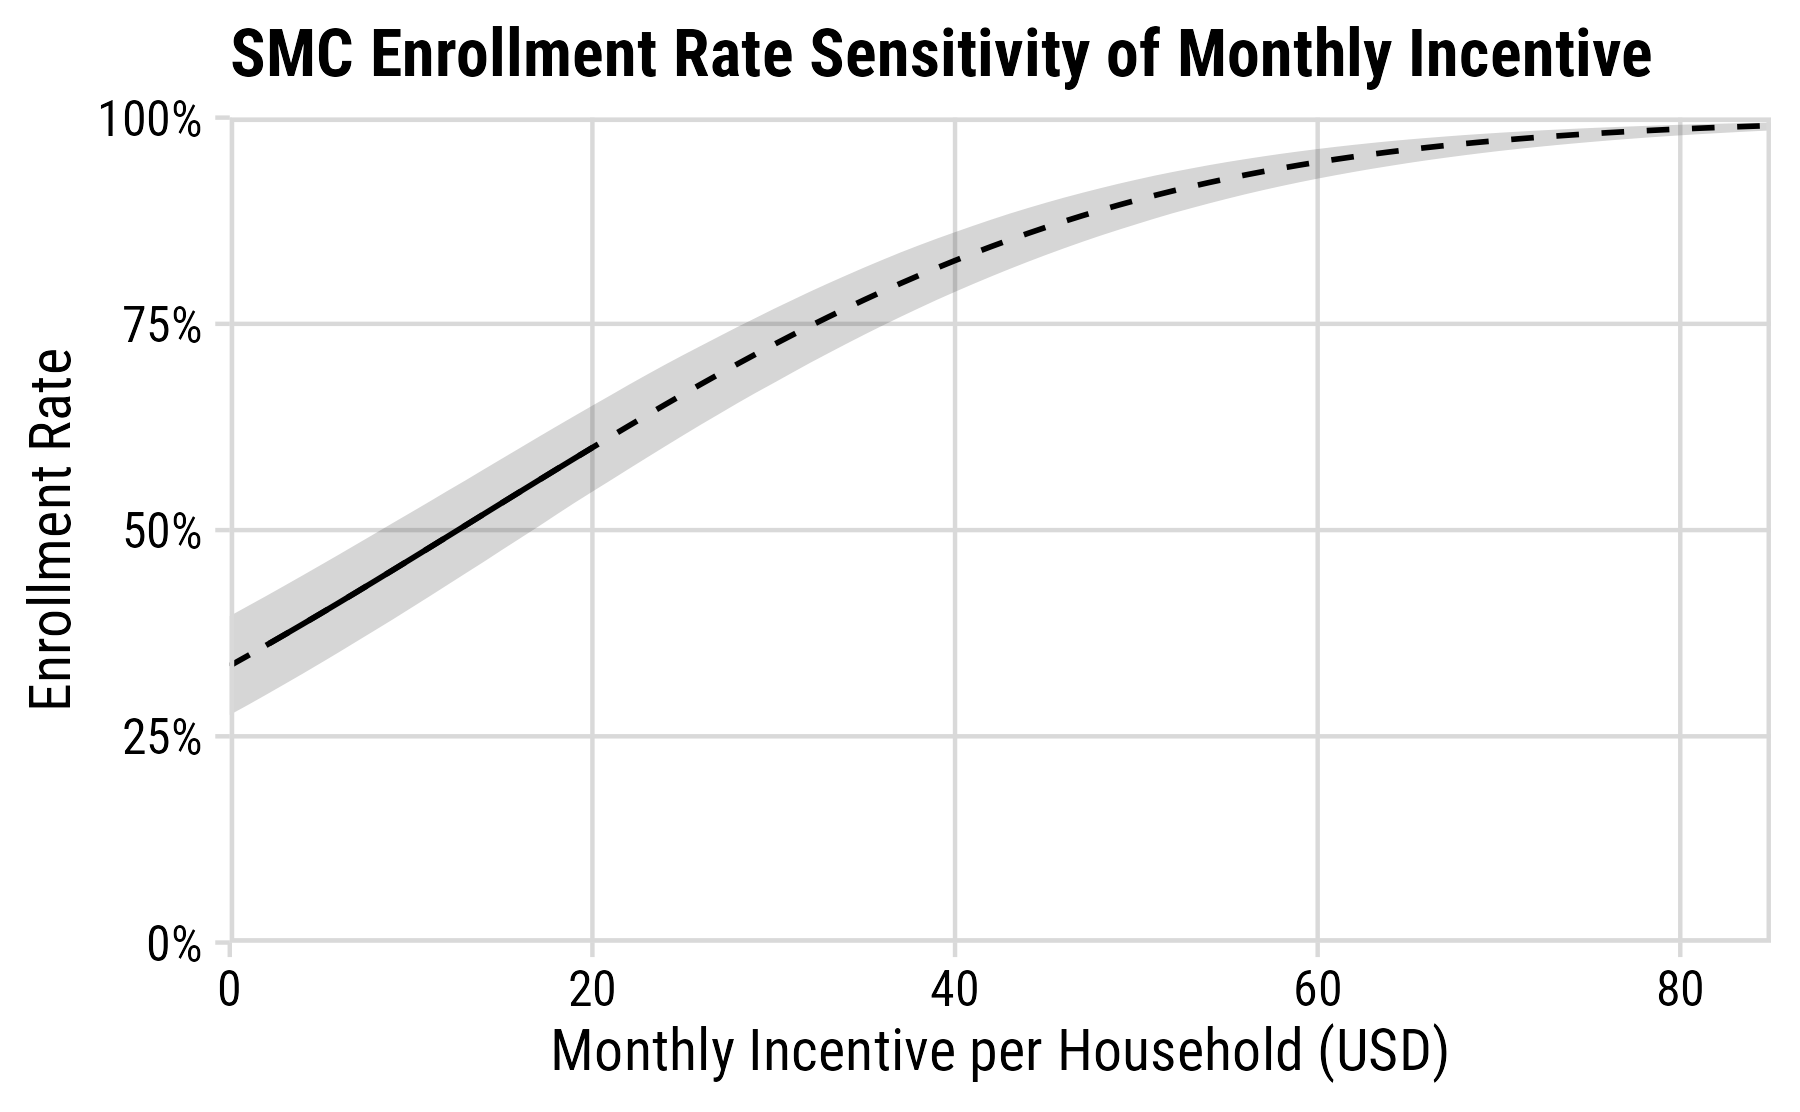
Mixed logit prediction based on ~1300 real BEV owners.
Peak from BEV charging decreases with higher enrollment
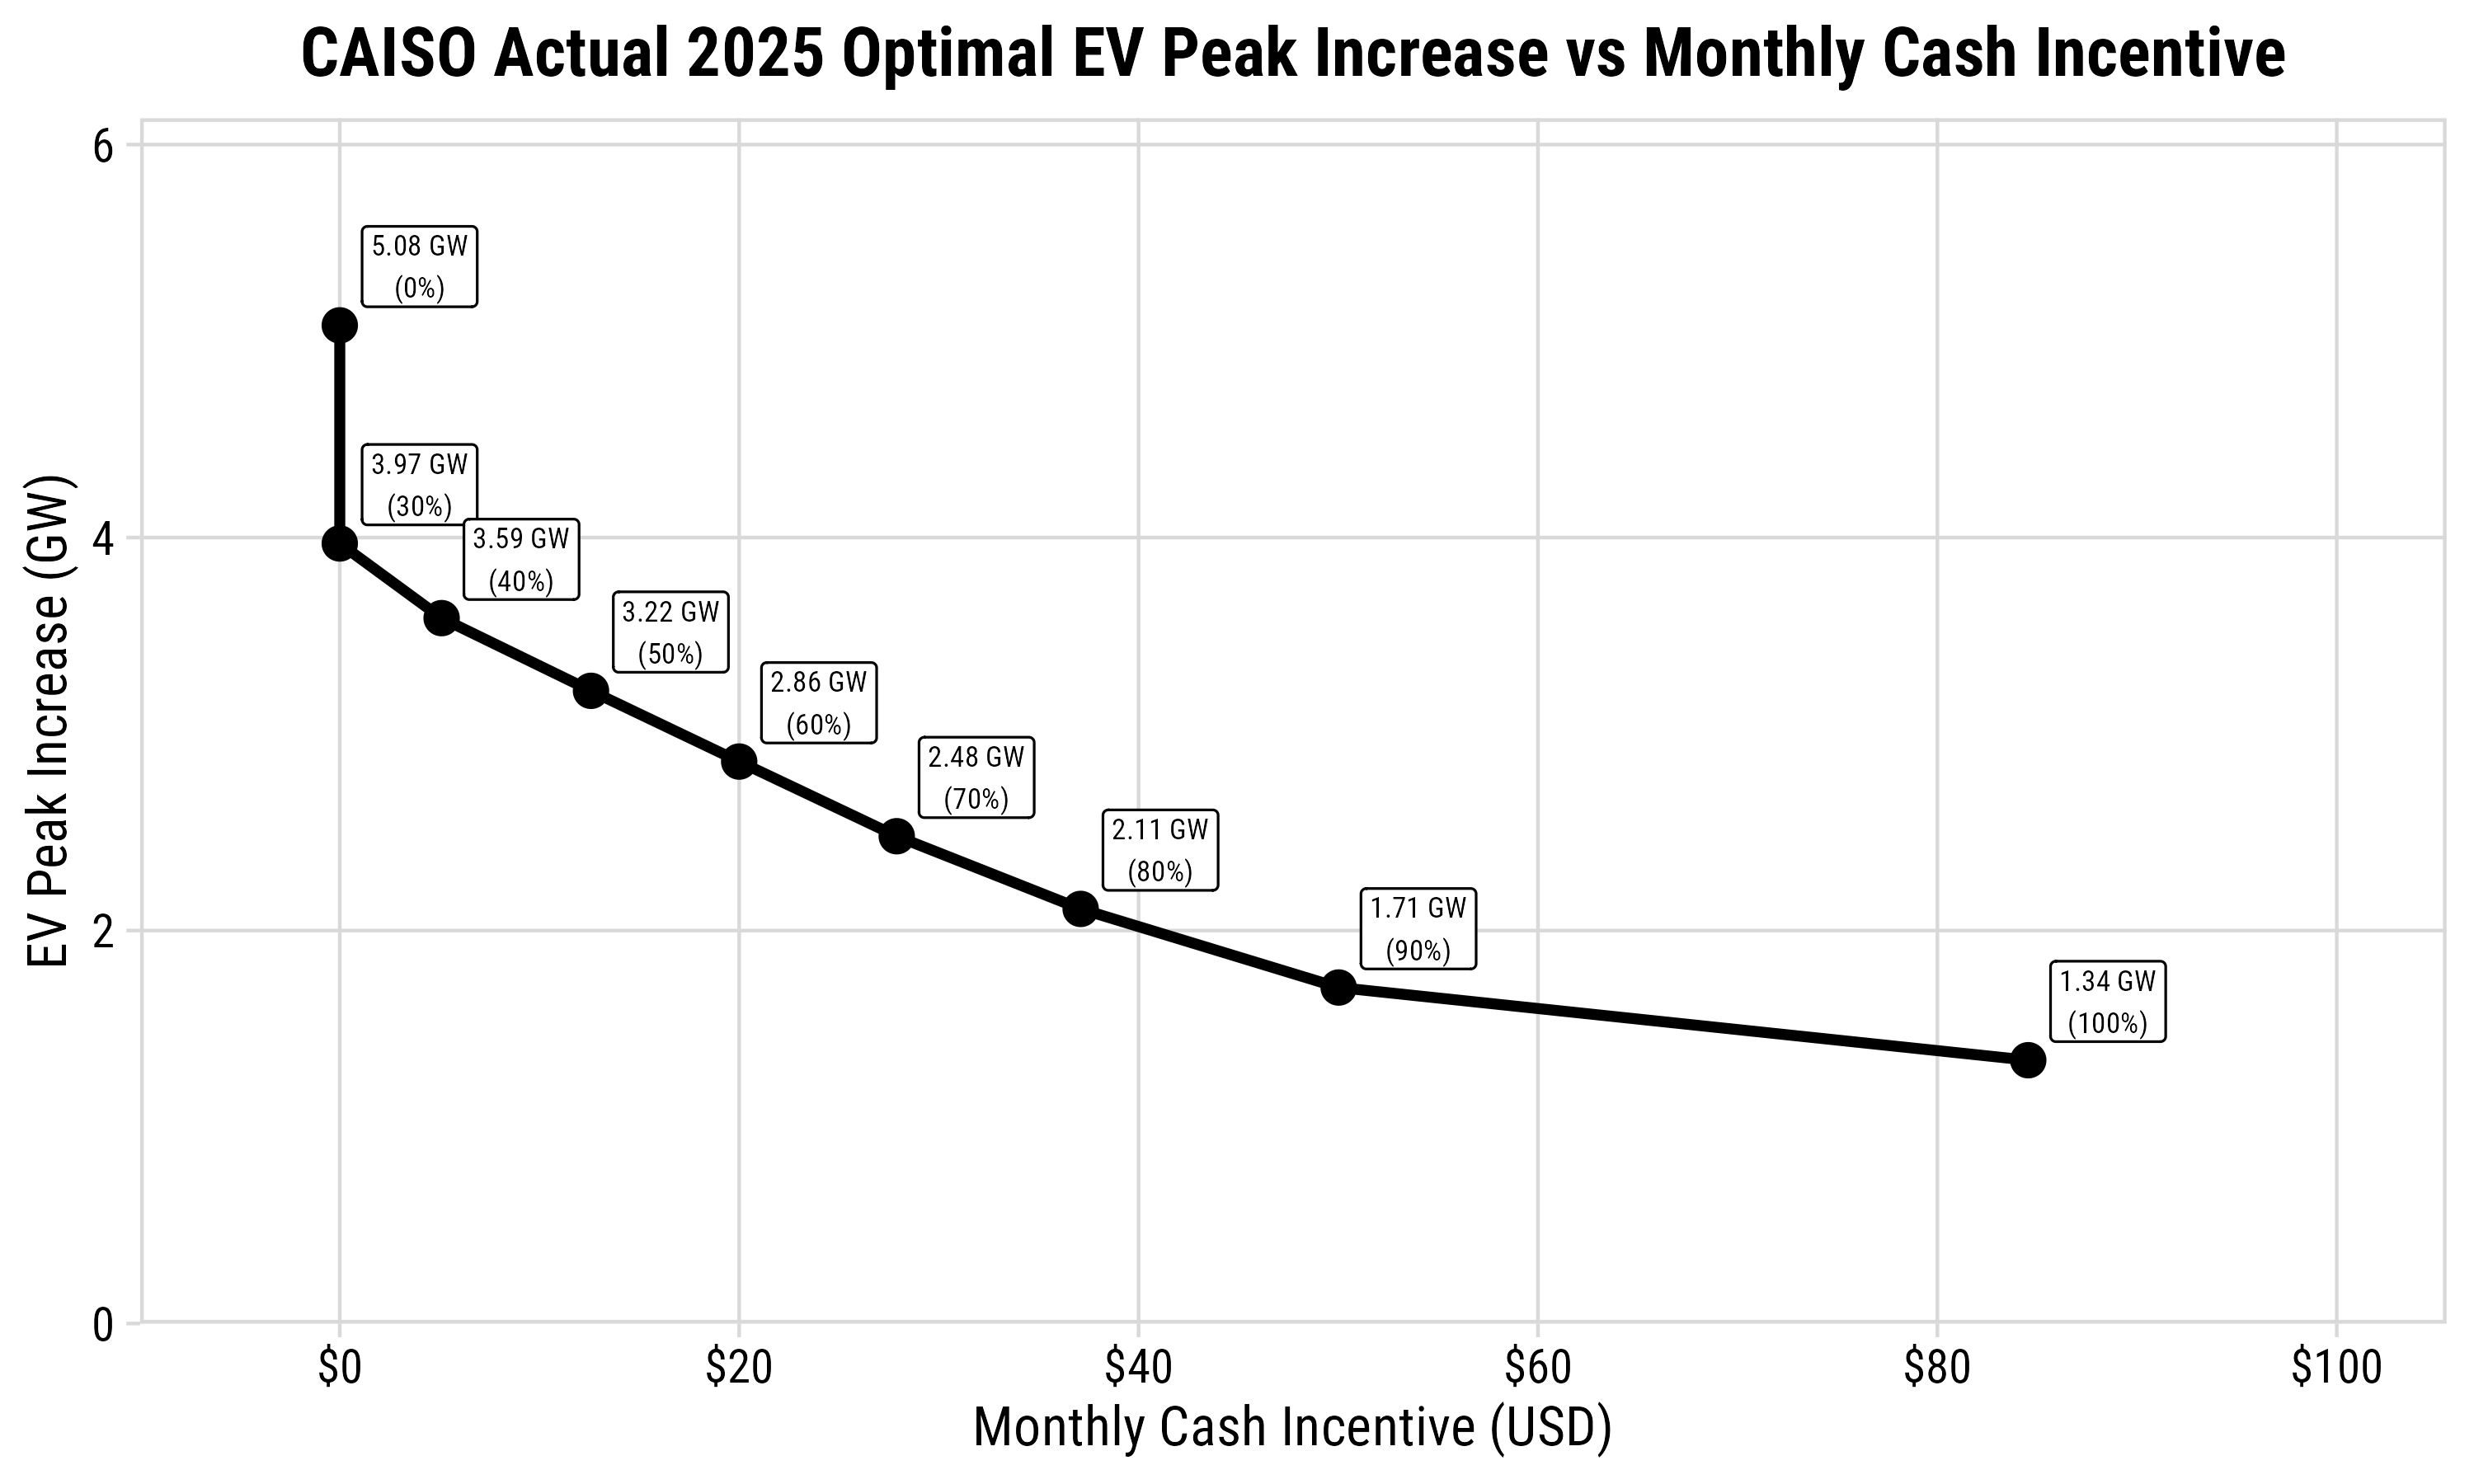
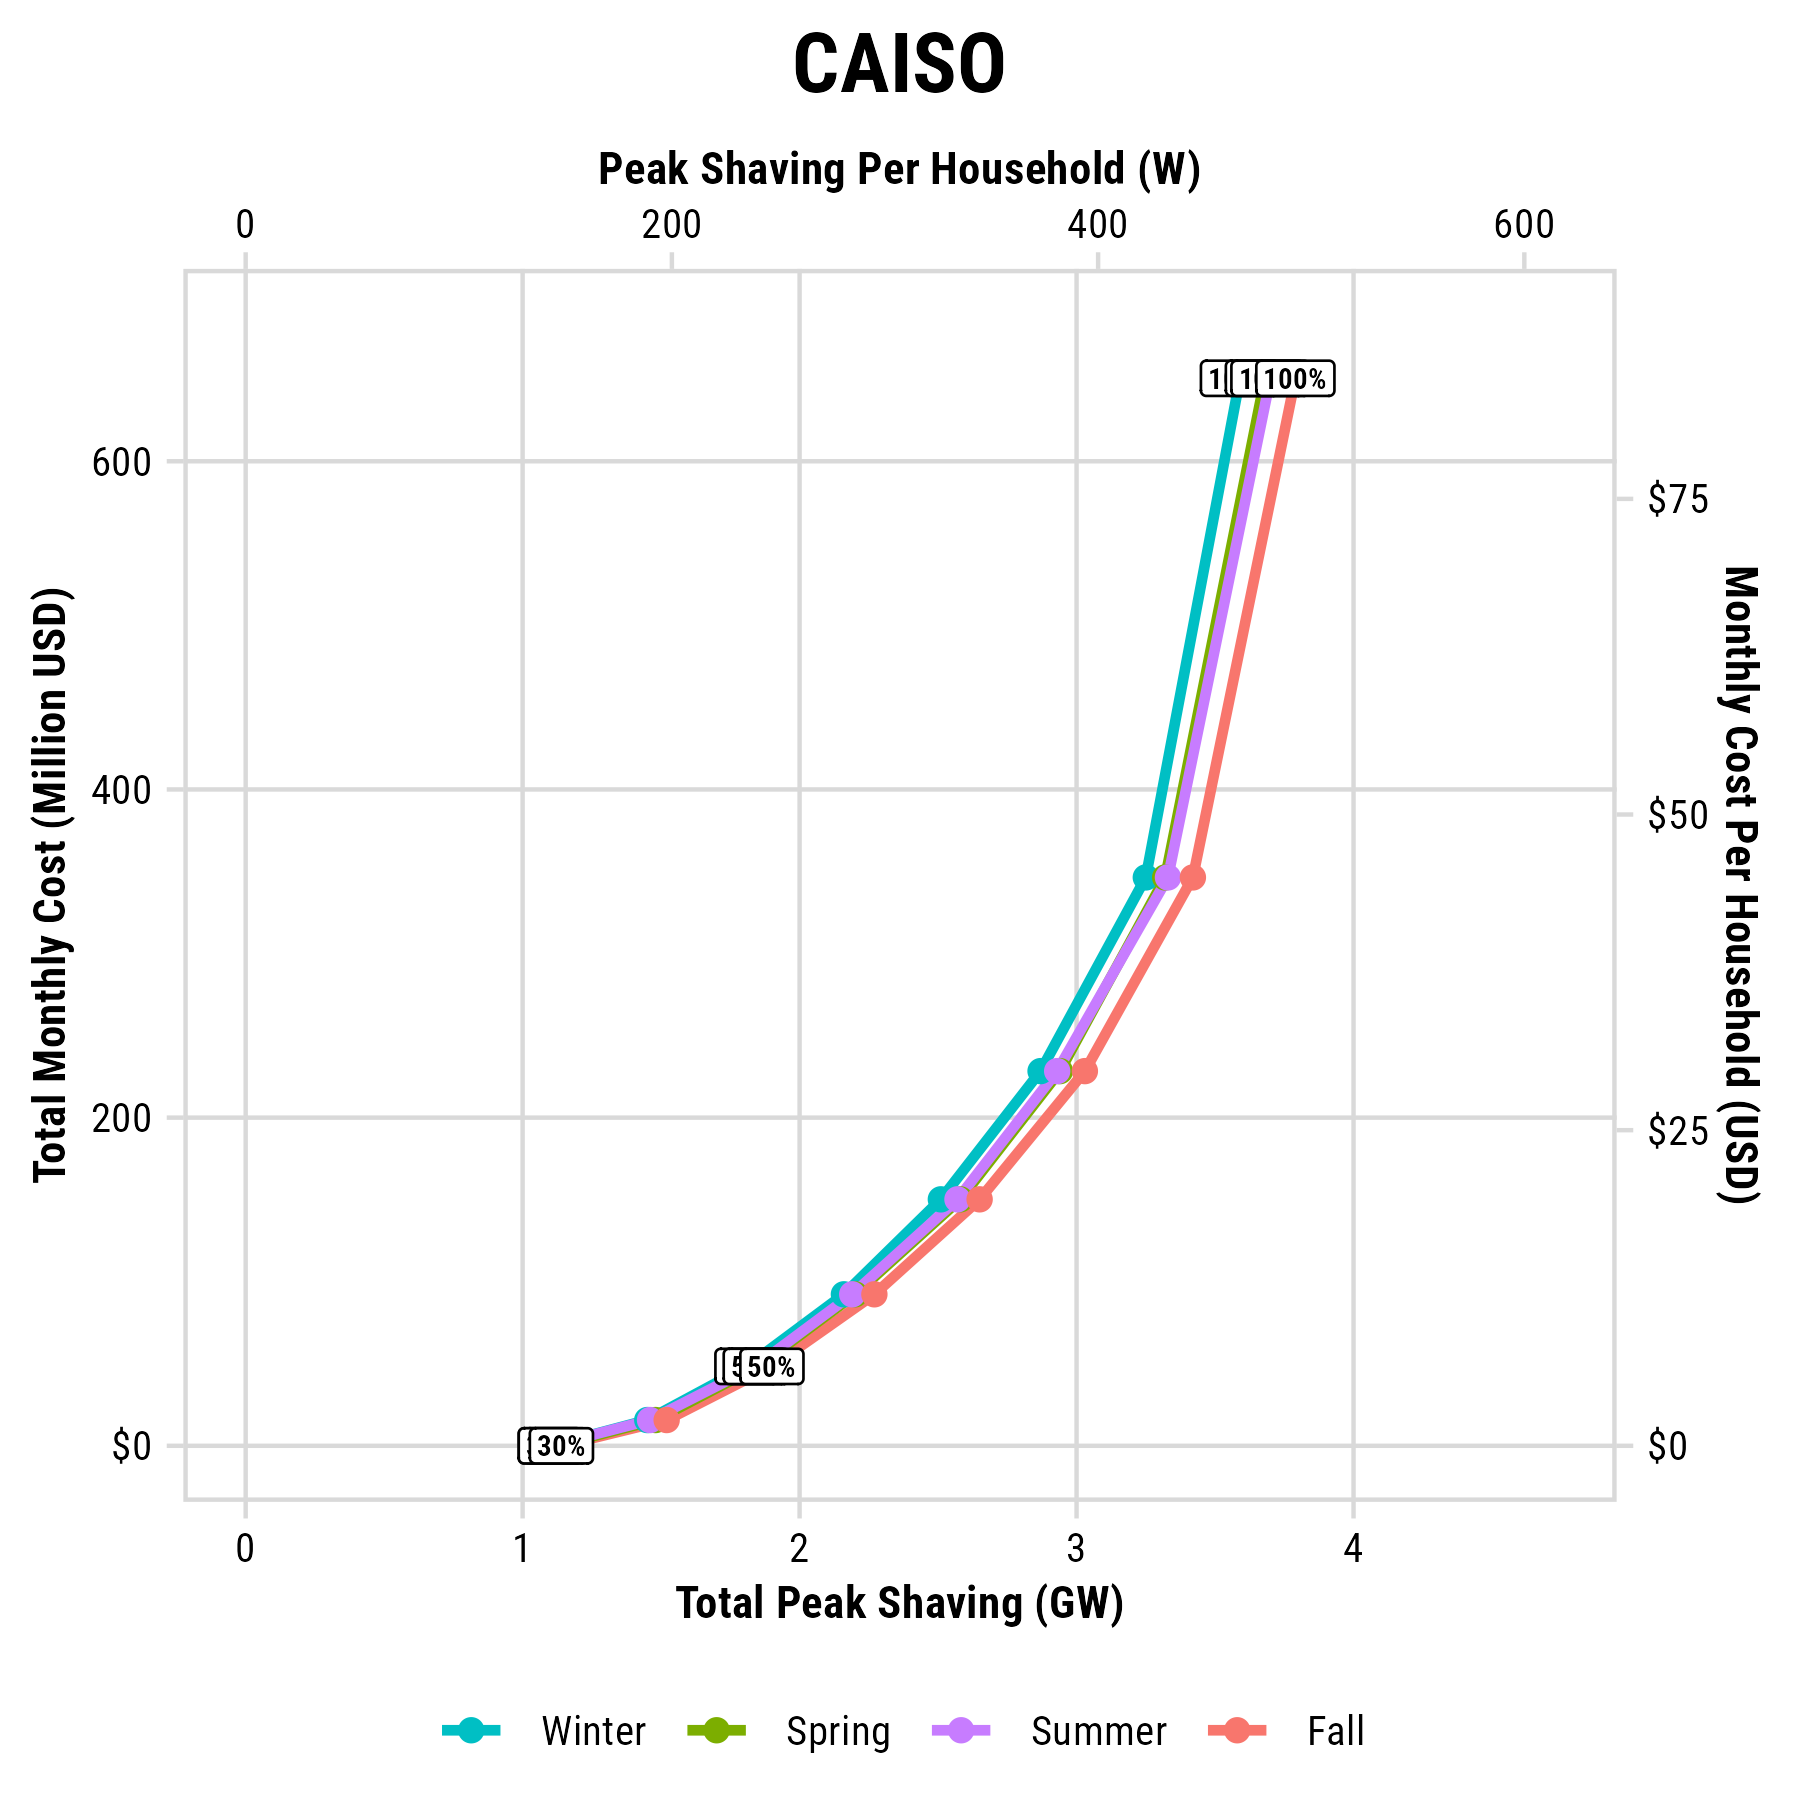
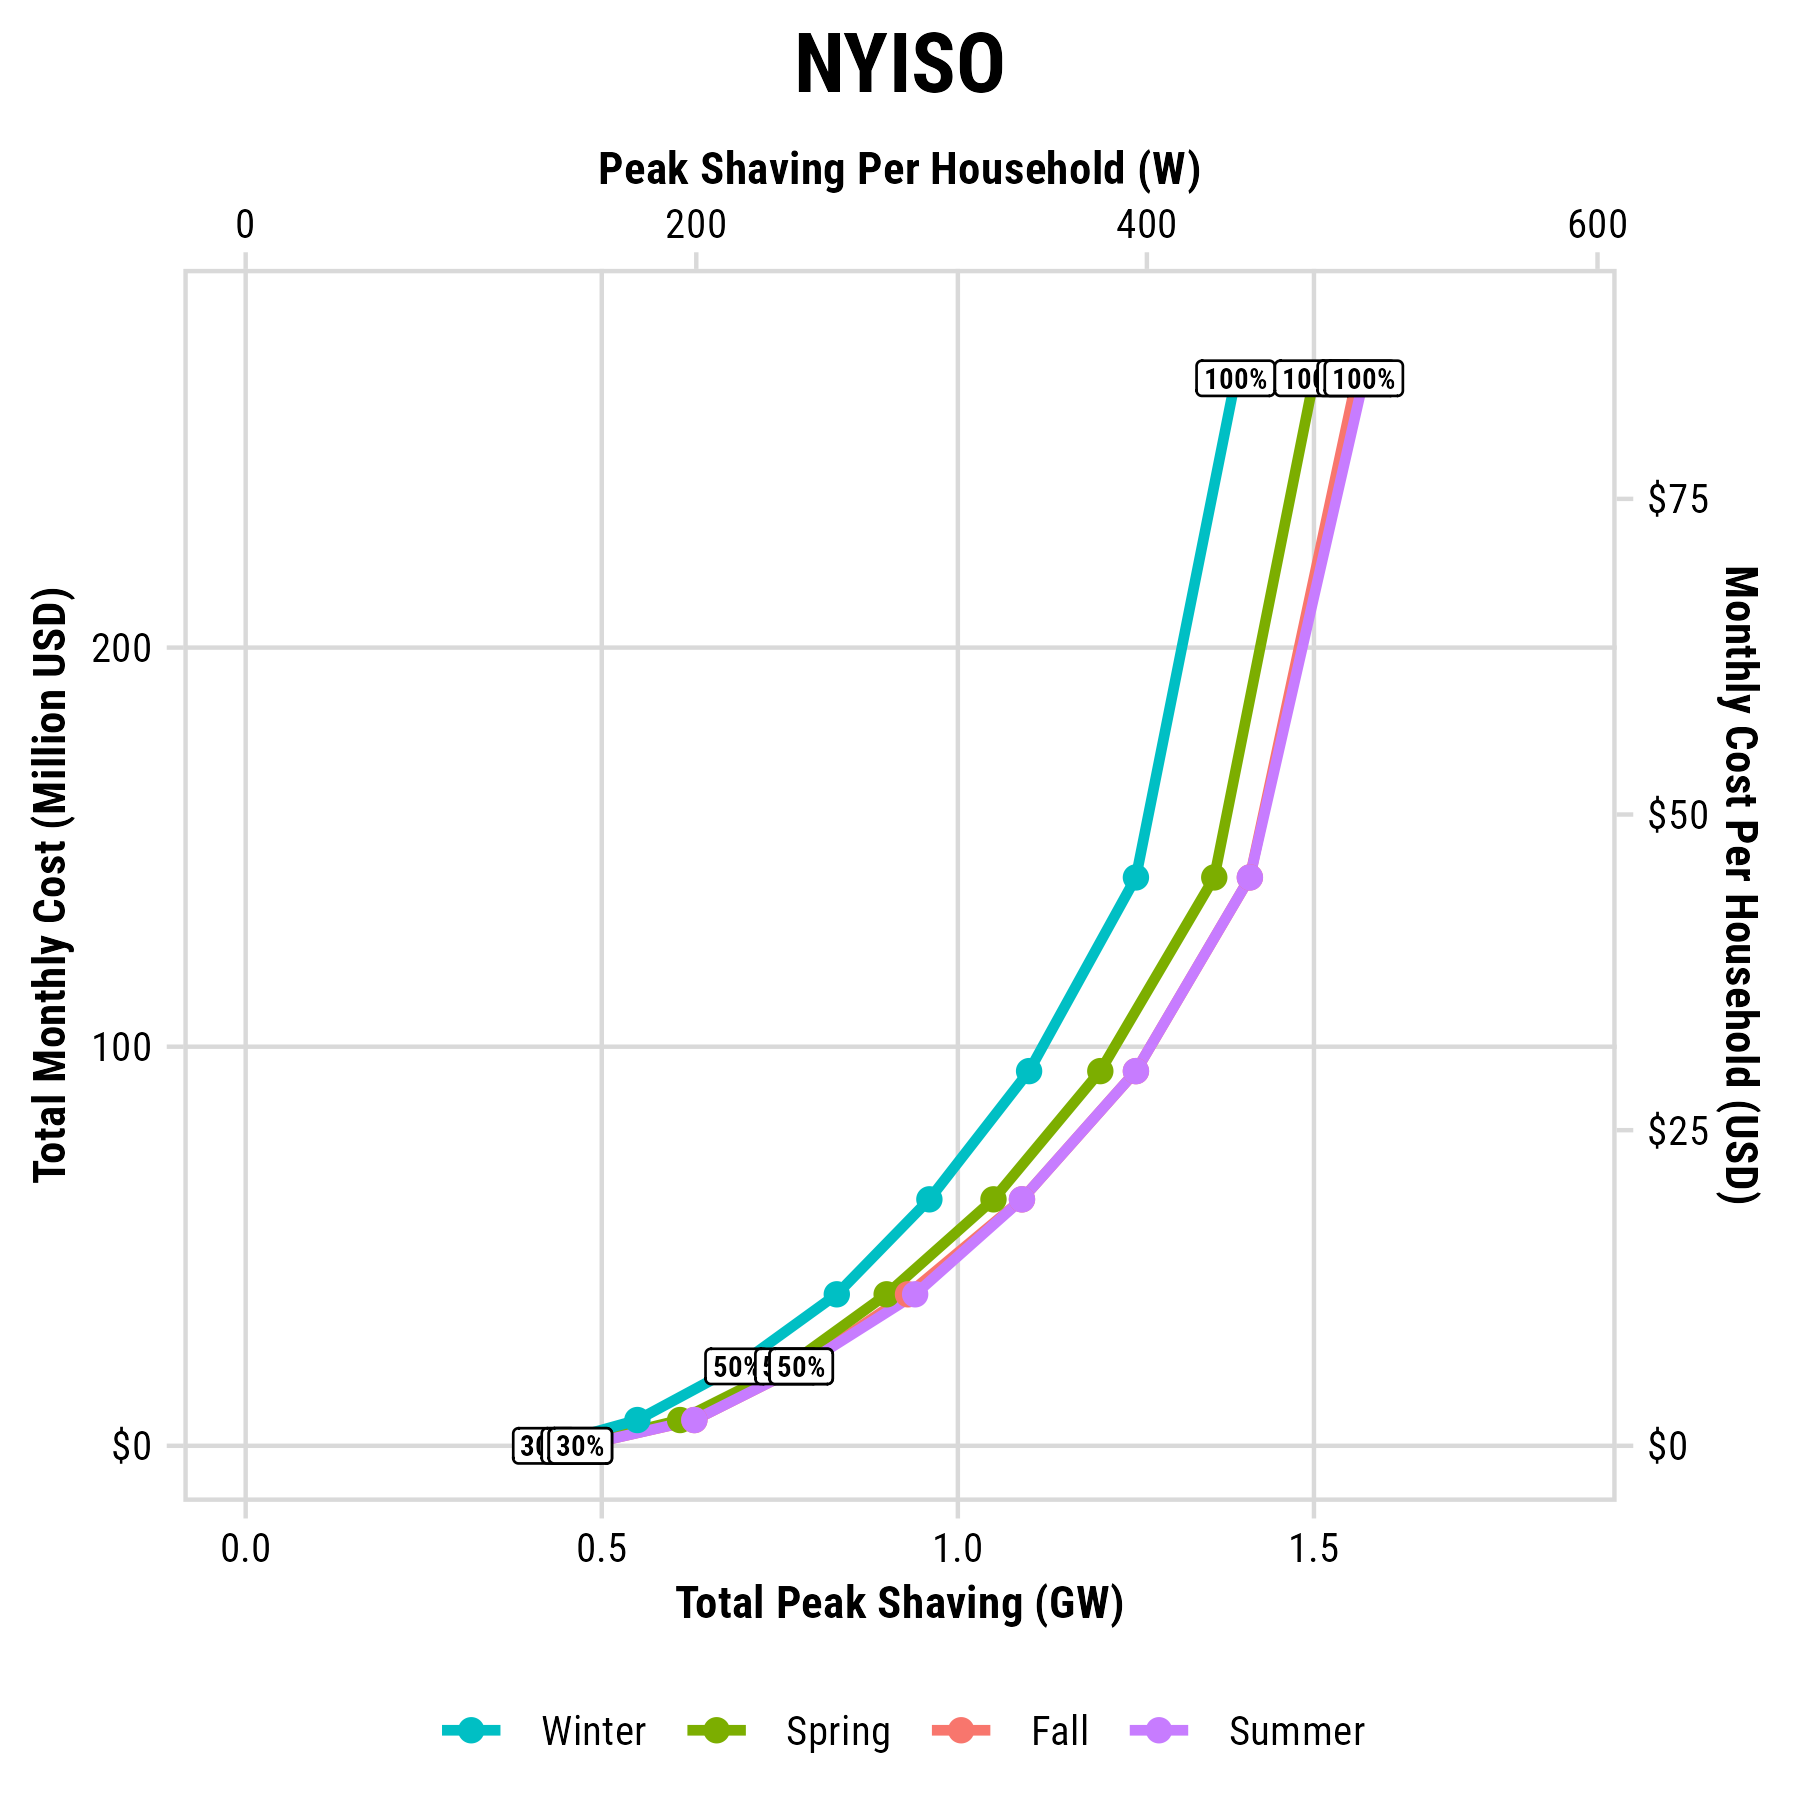
Cost Efficiency Frontier
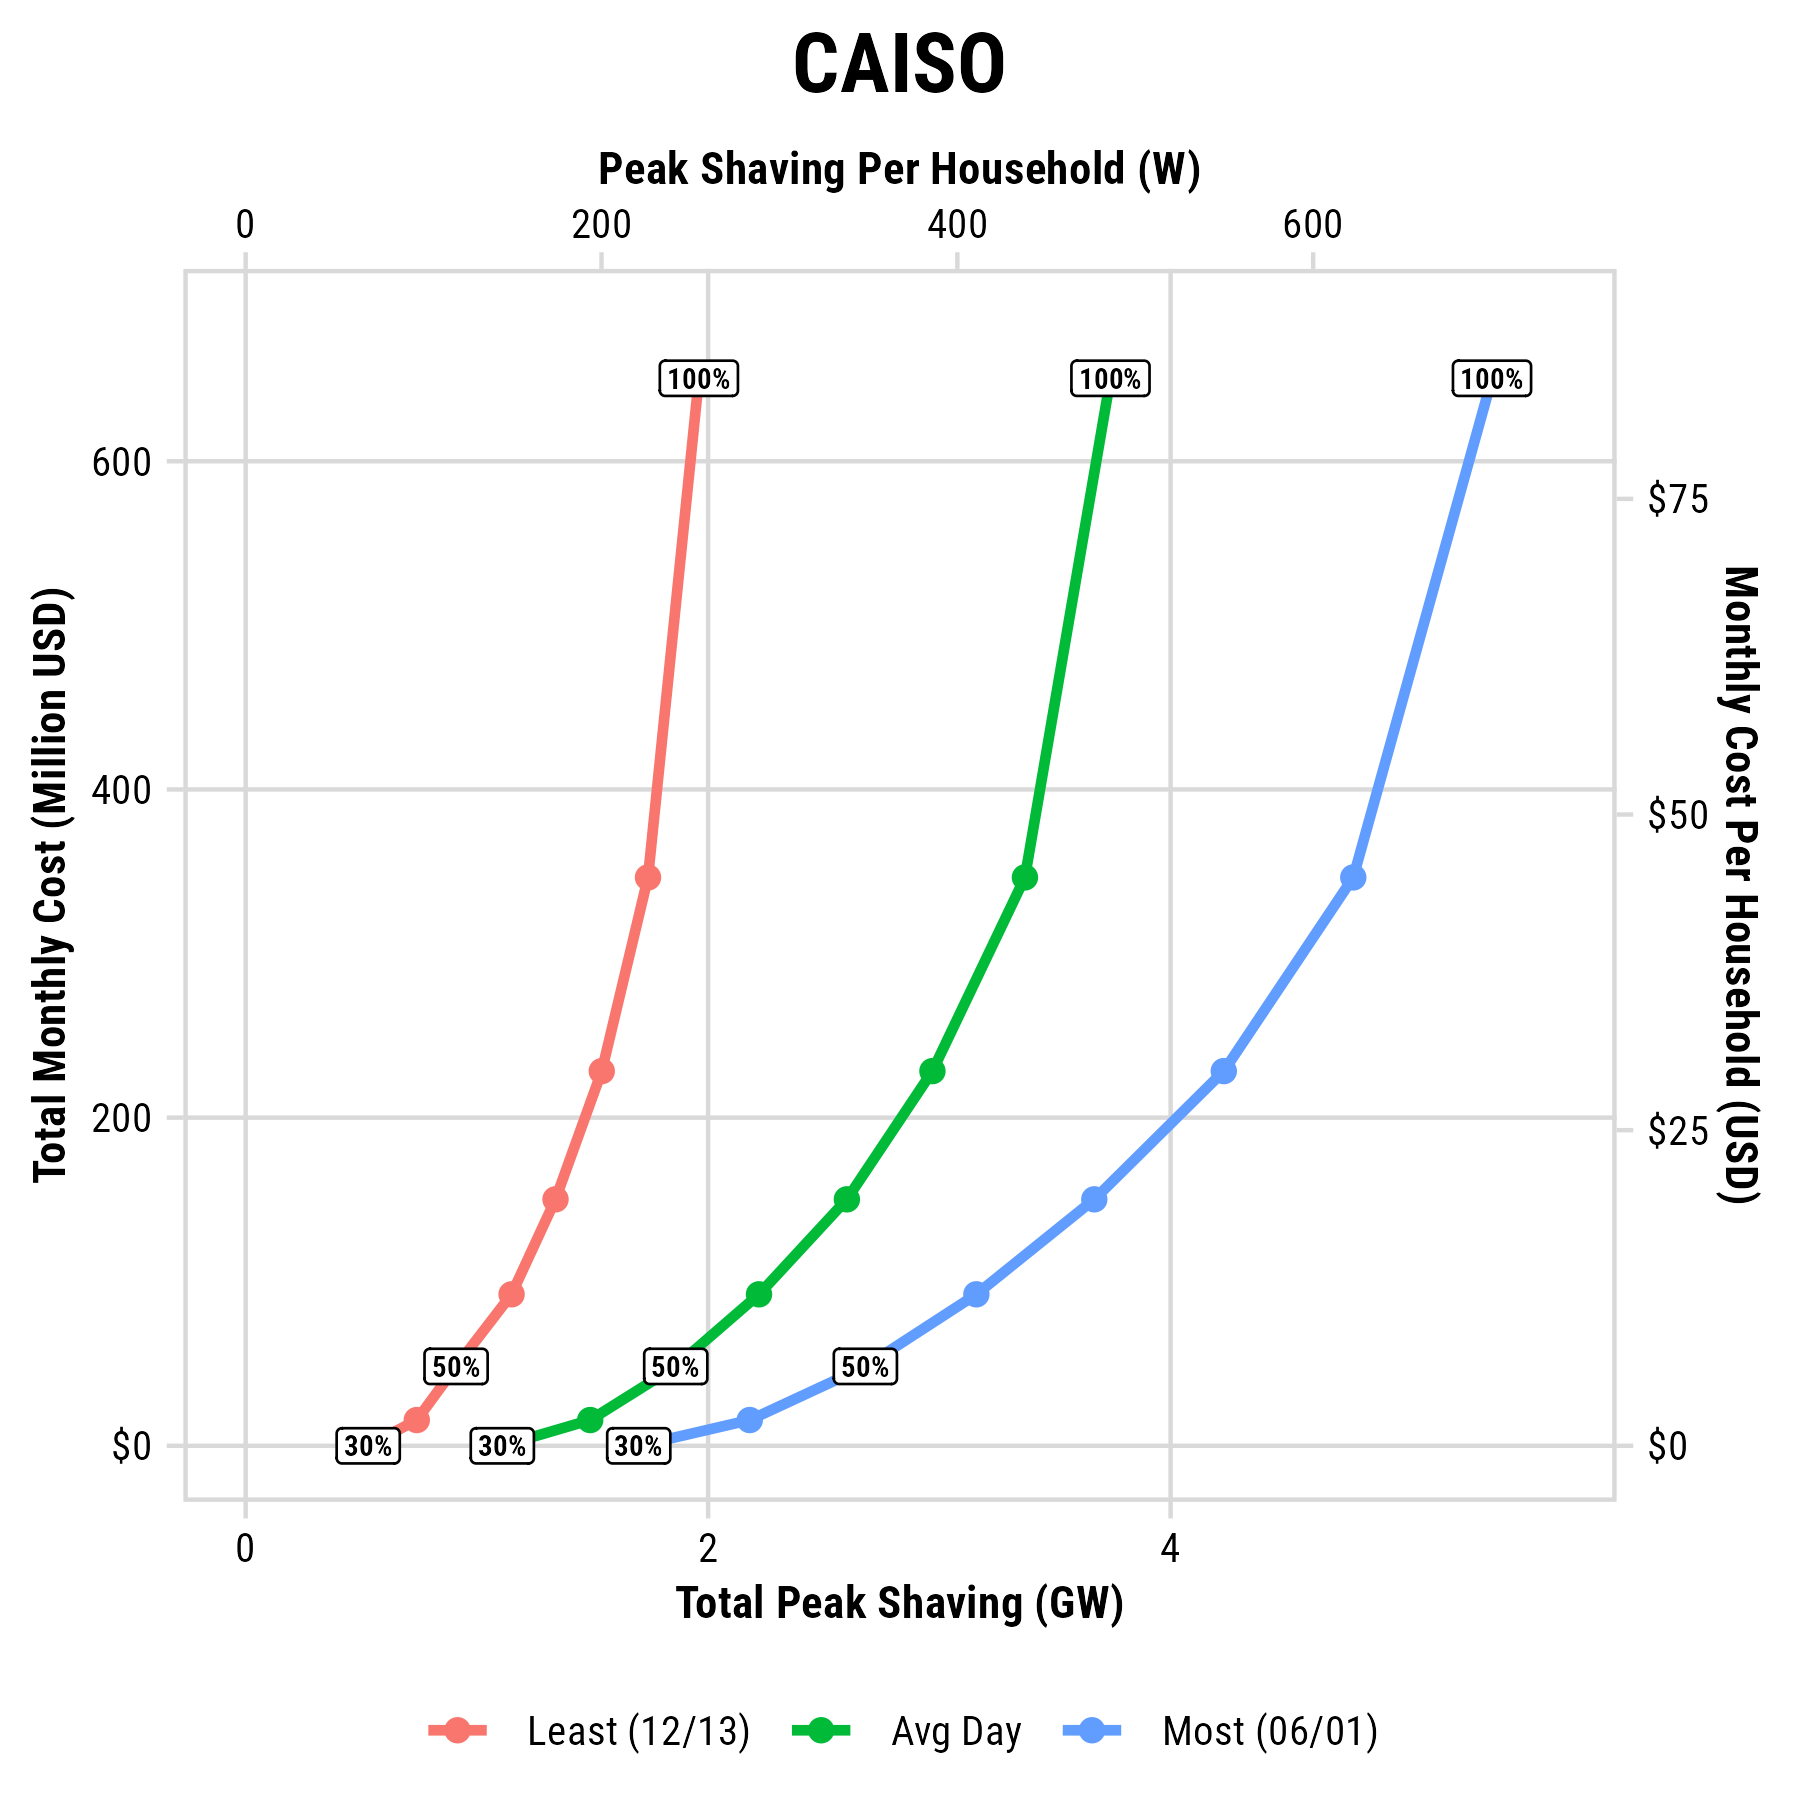
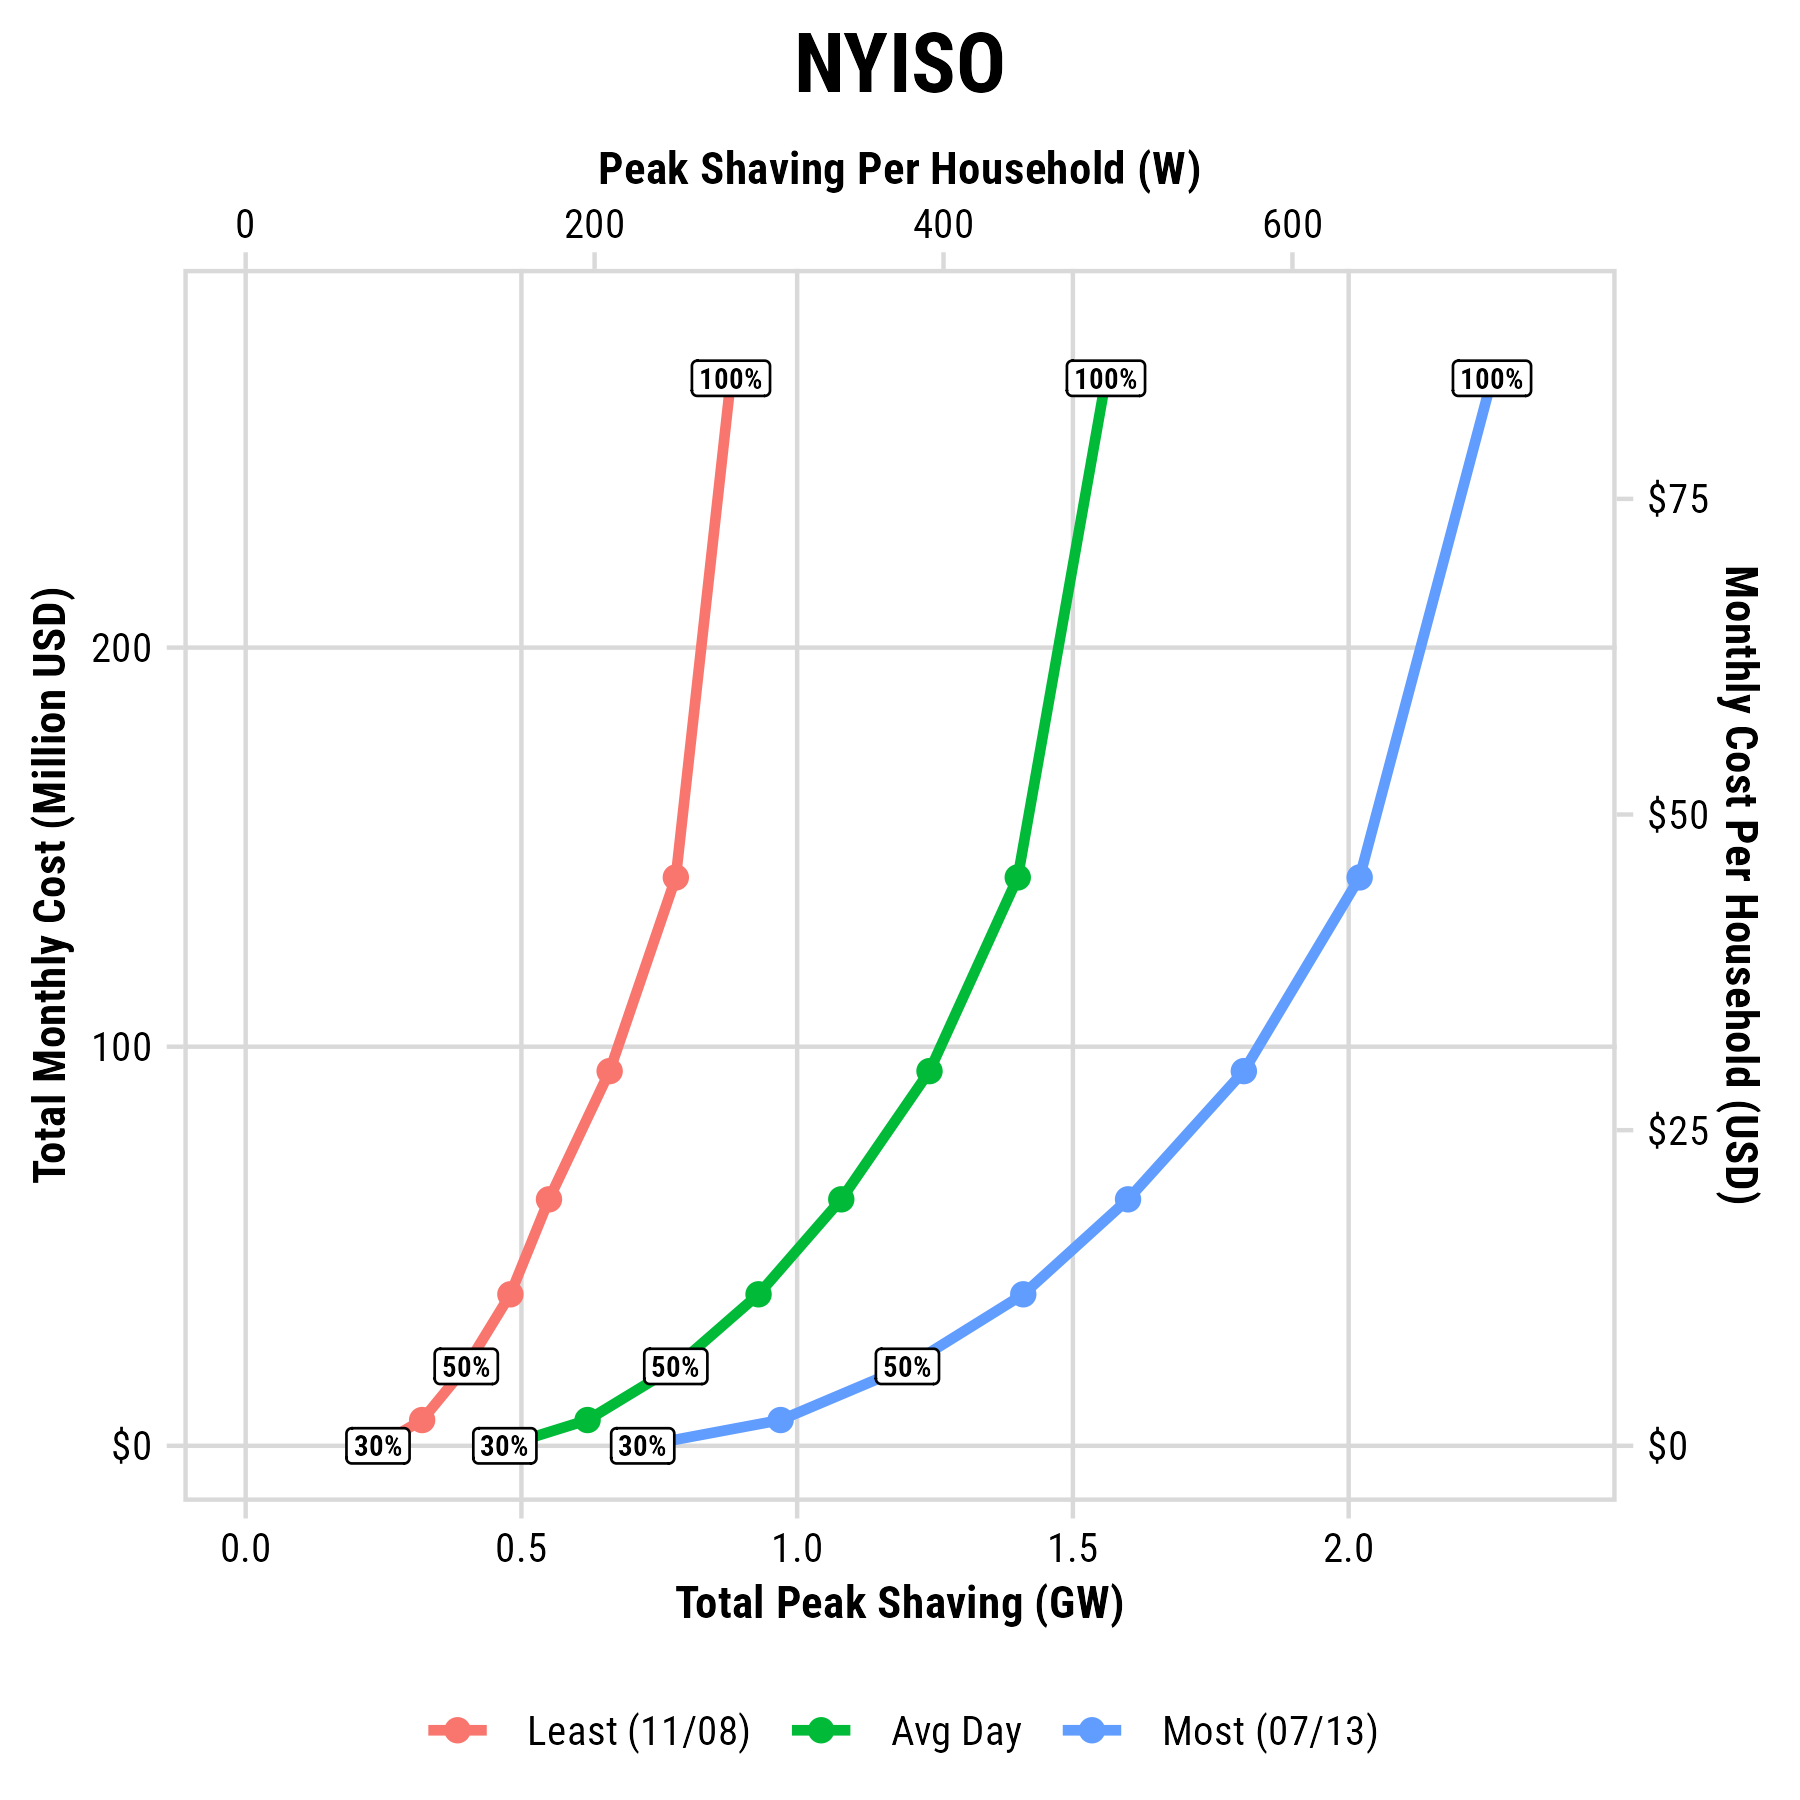
Cost efficiency is highest at moderate enrollment (30–50%).
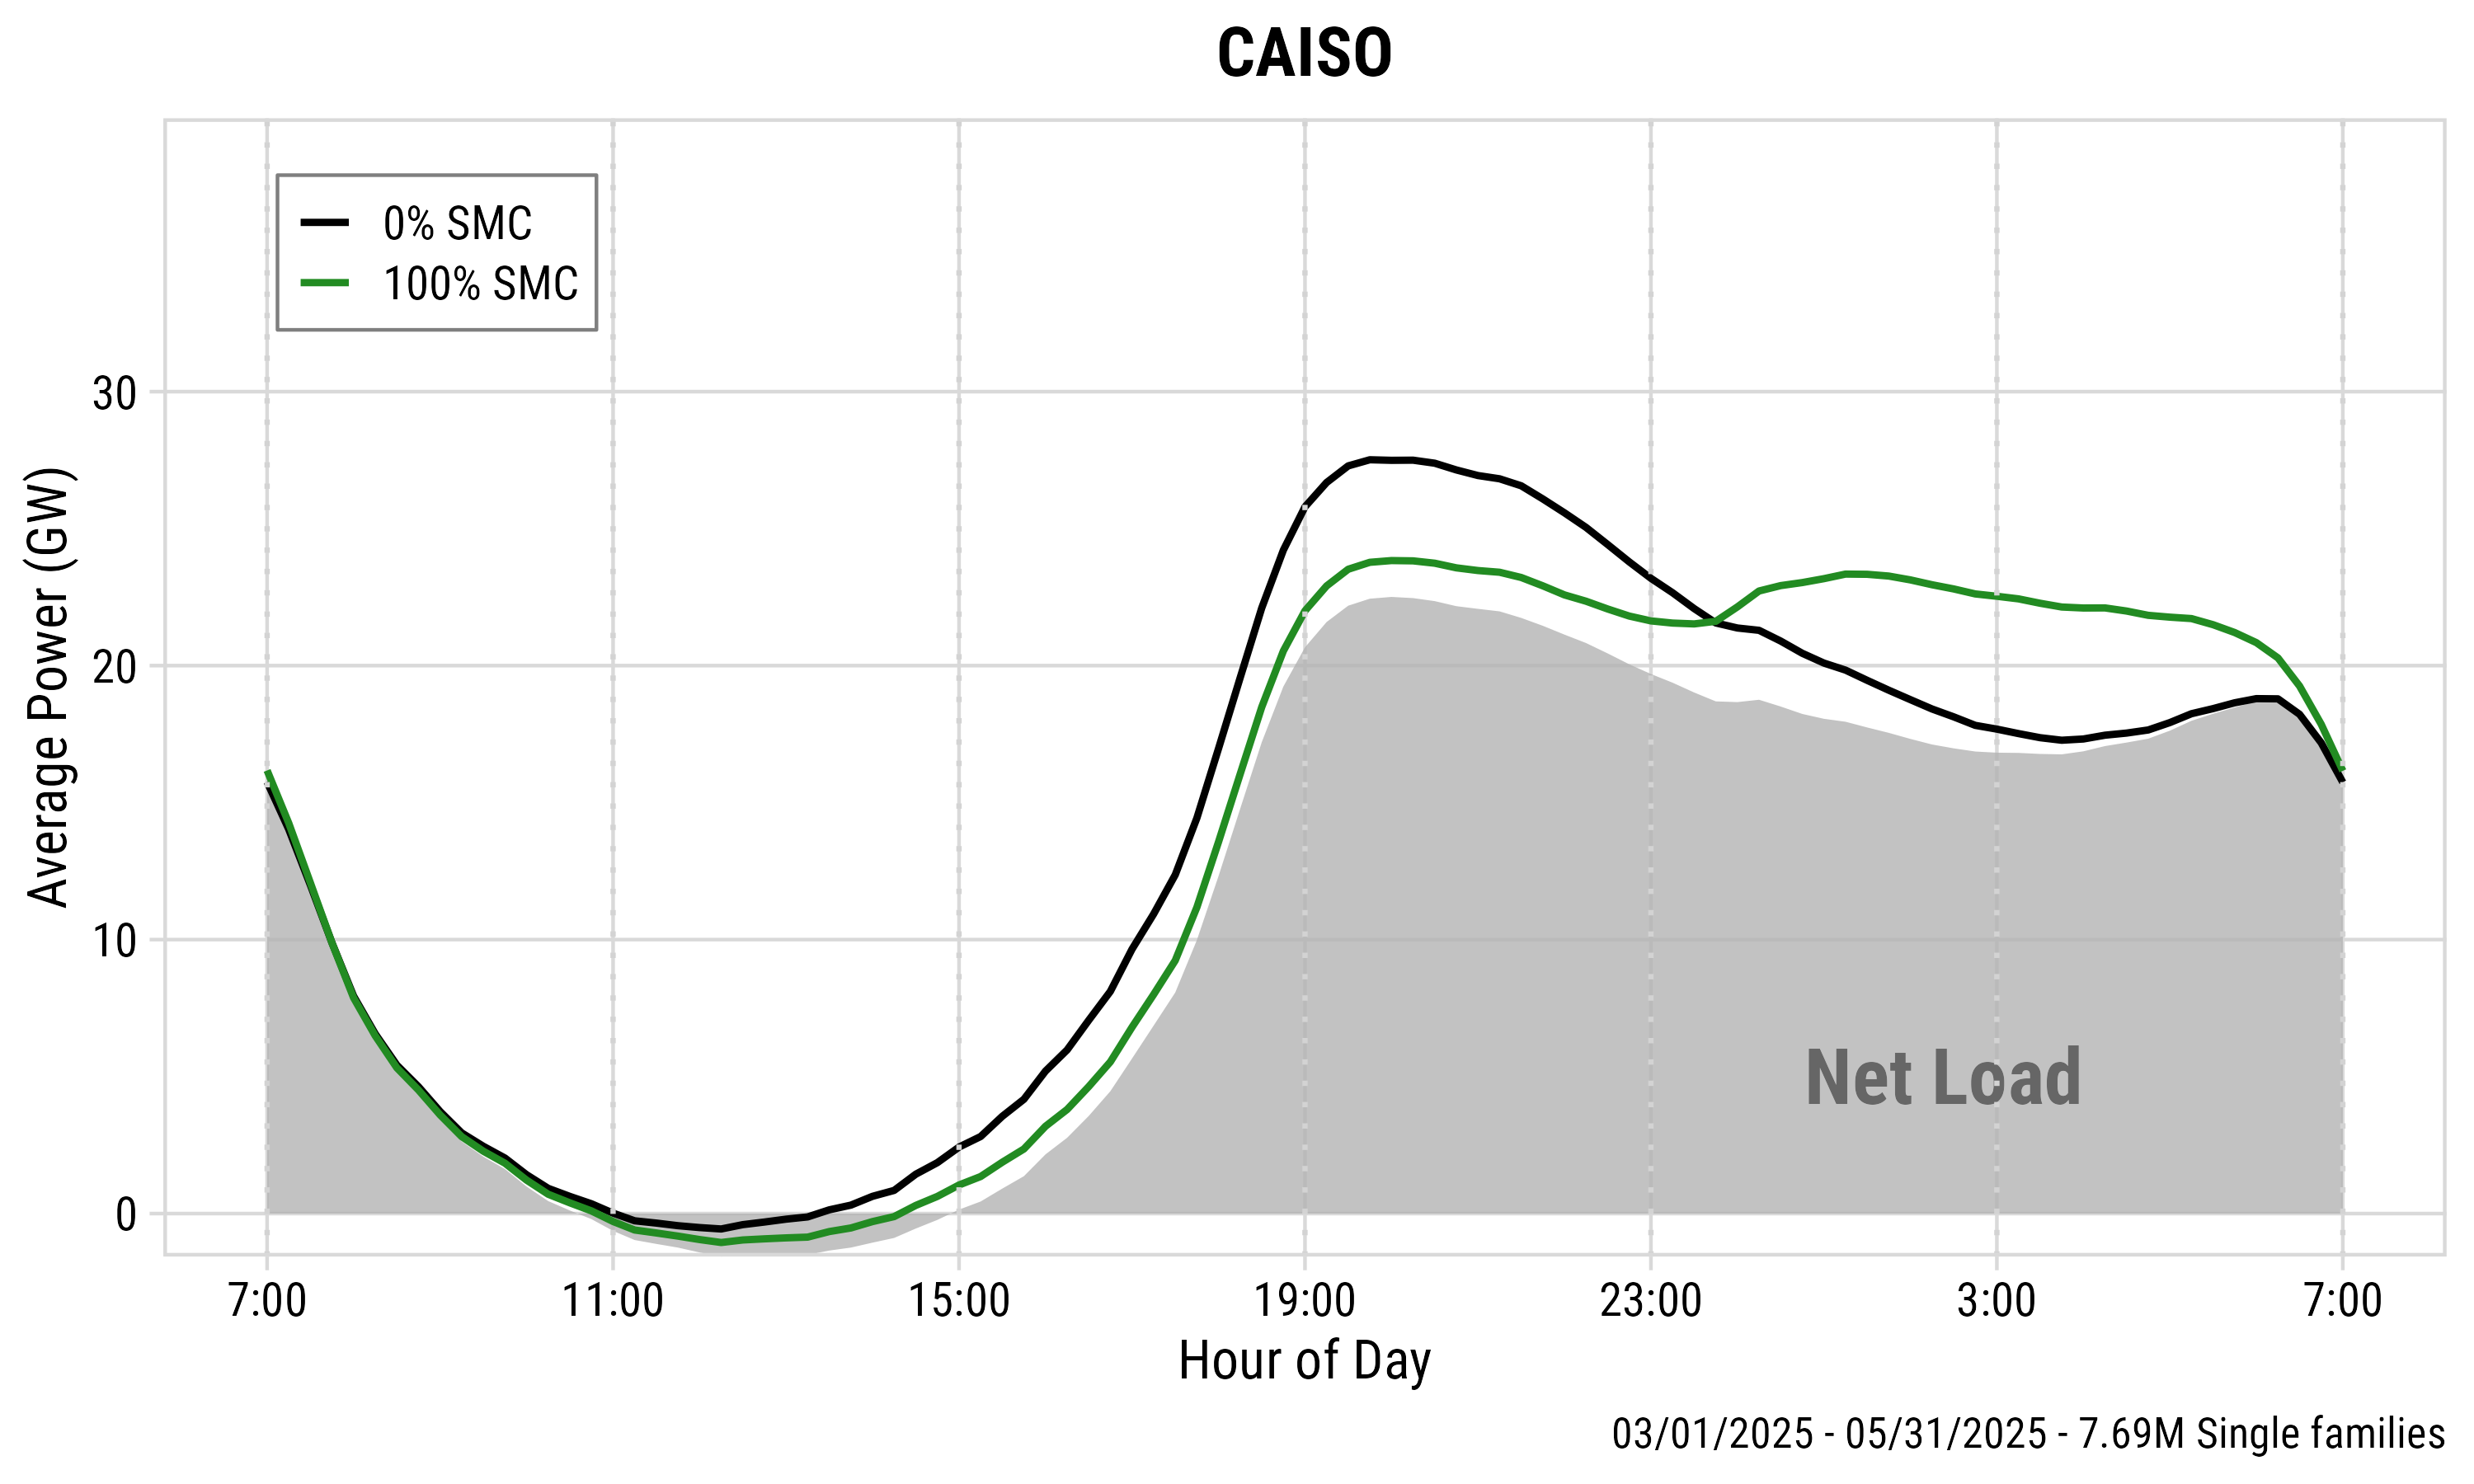
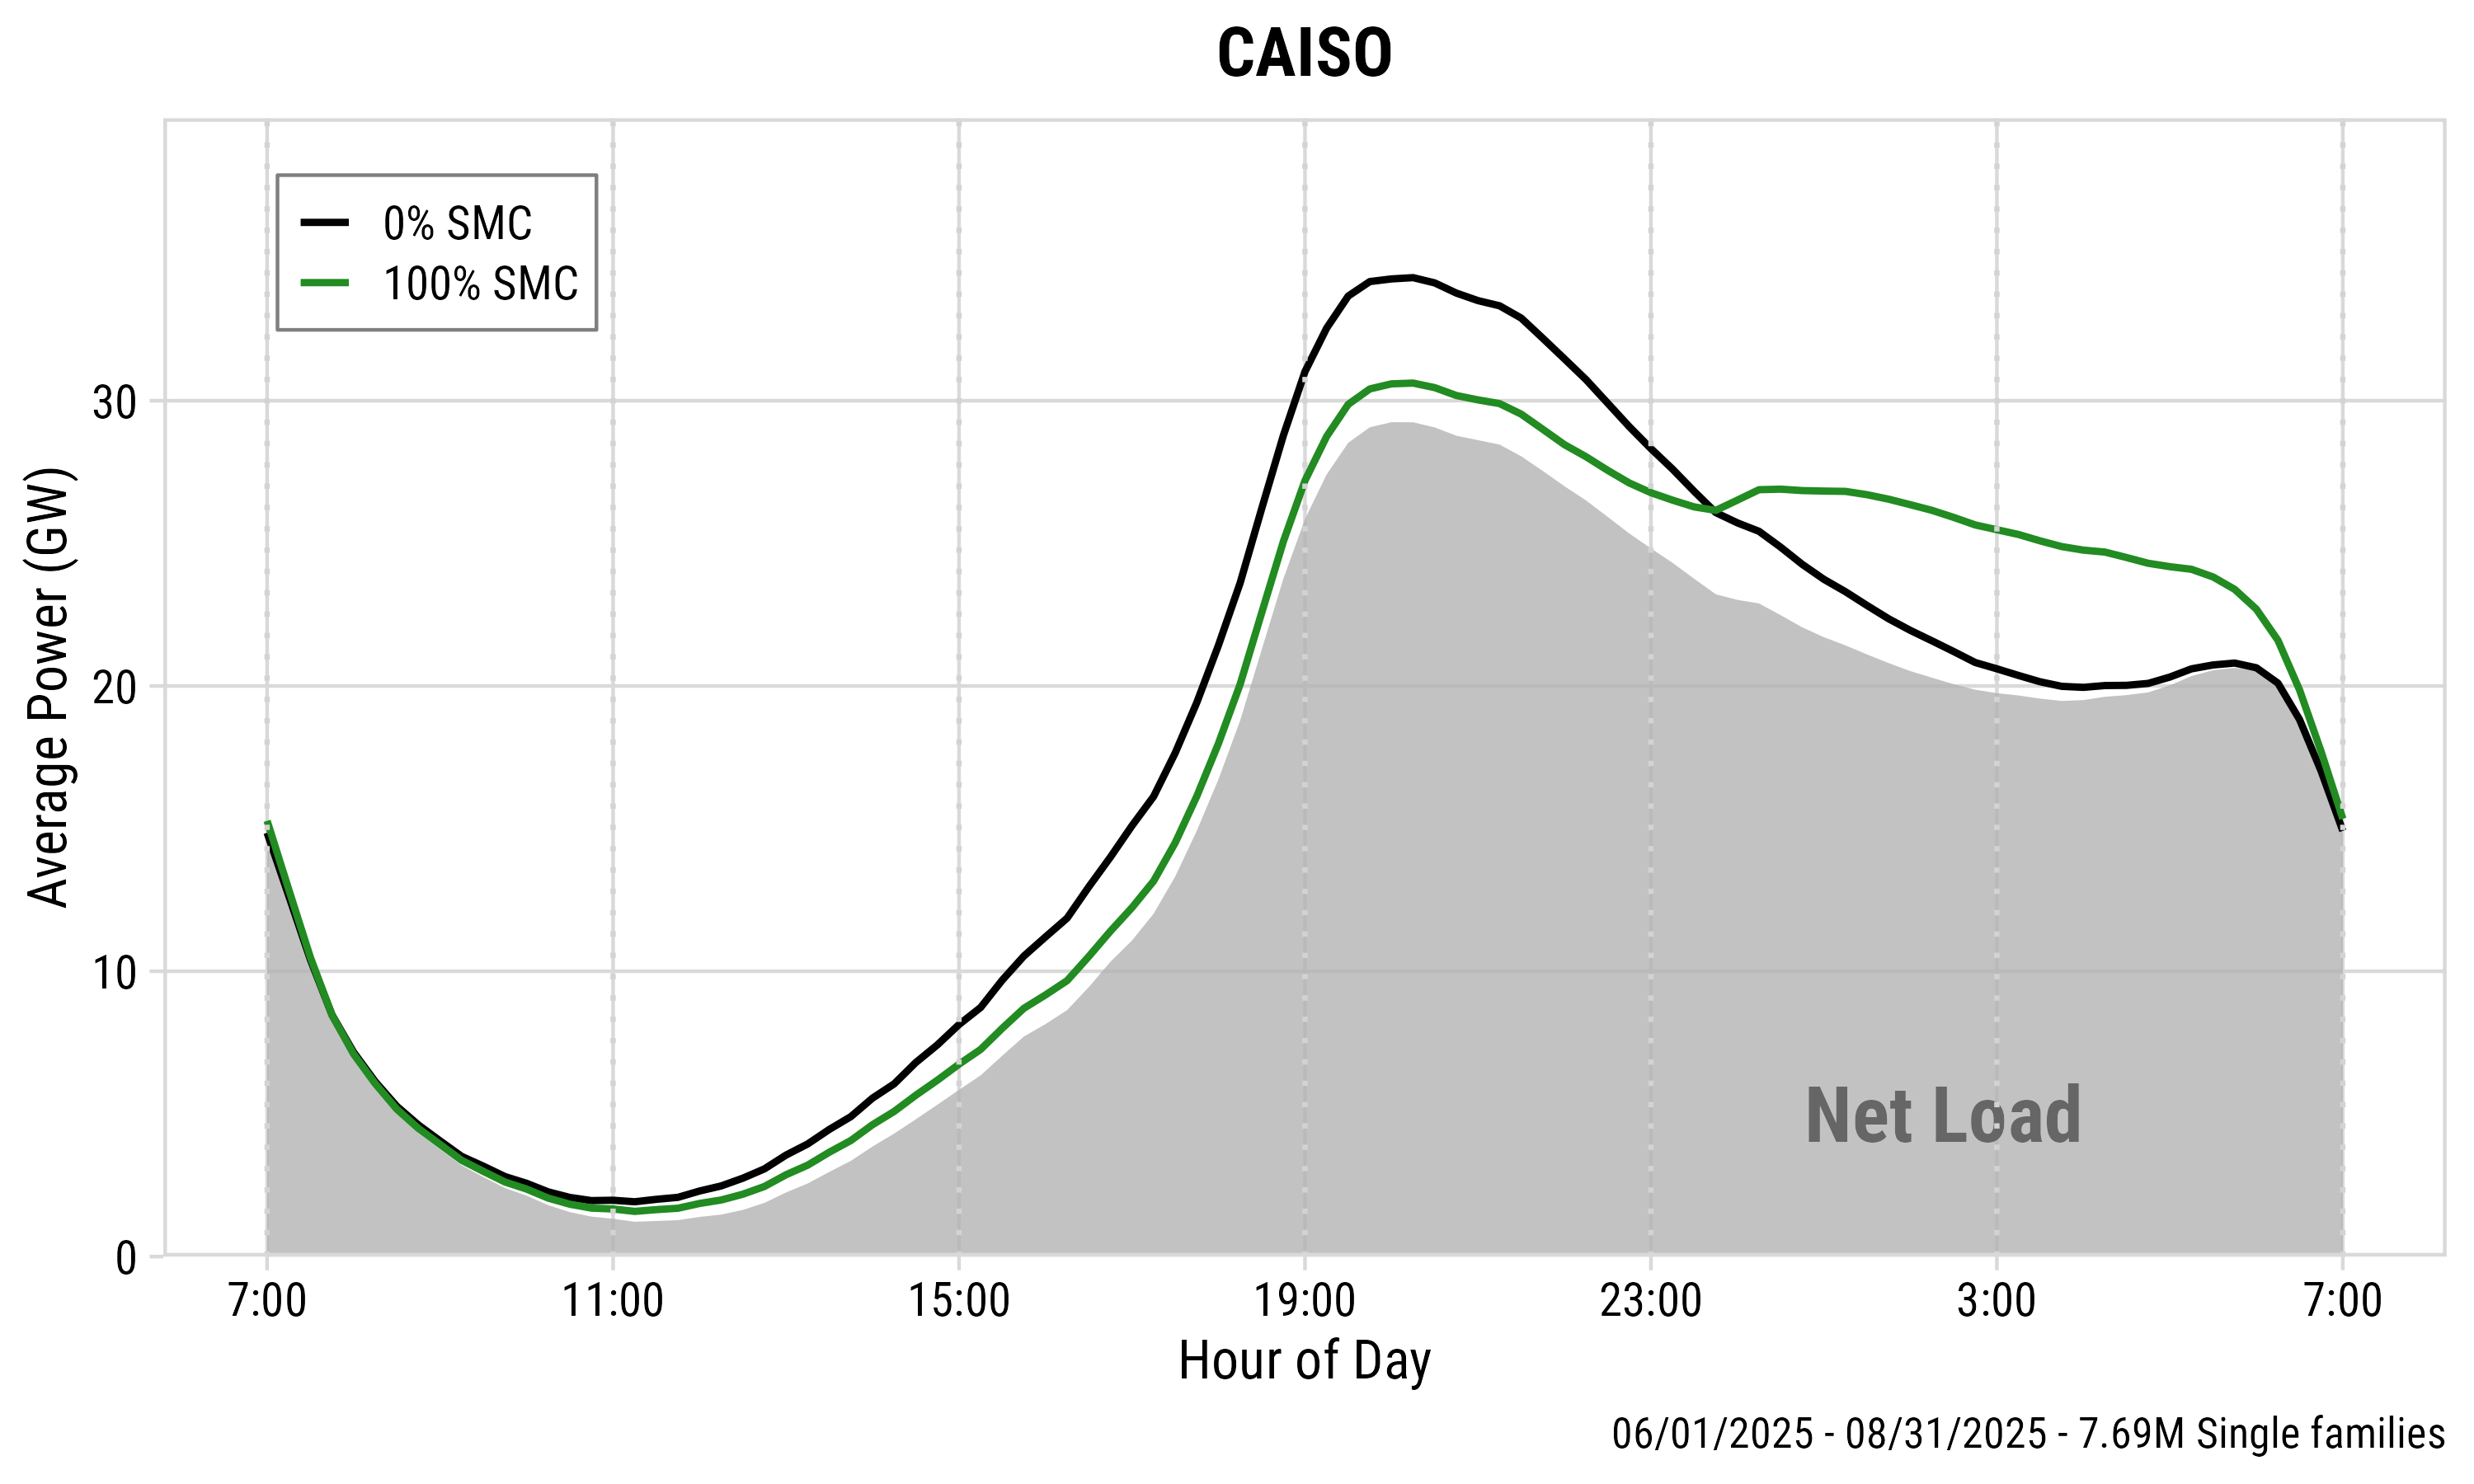
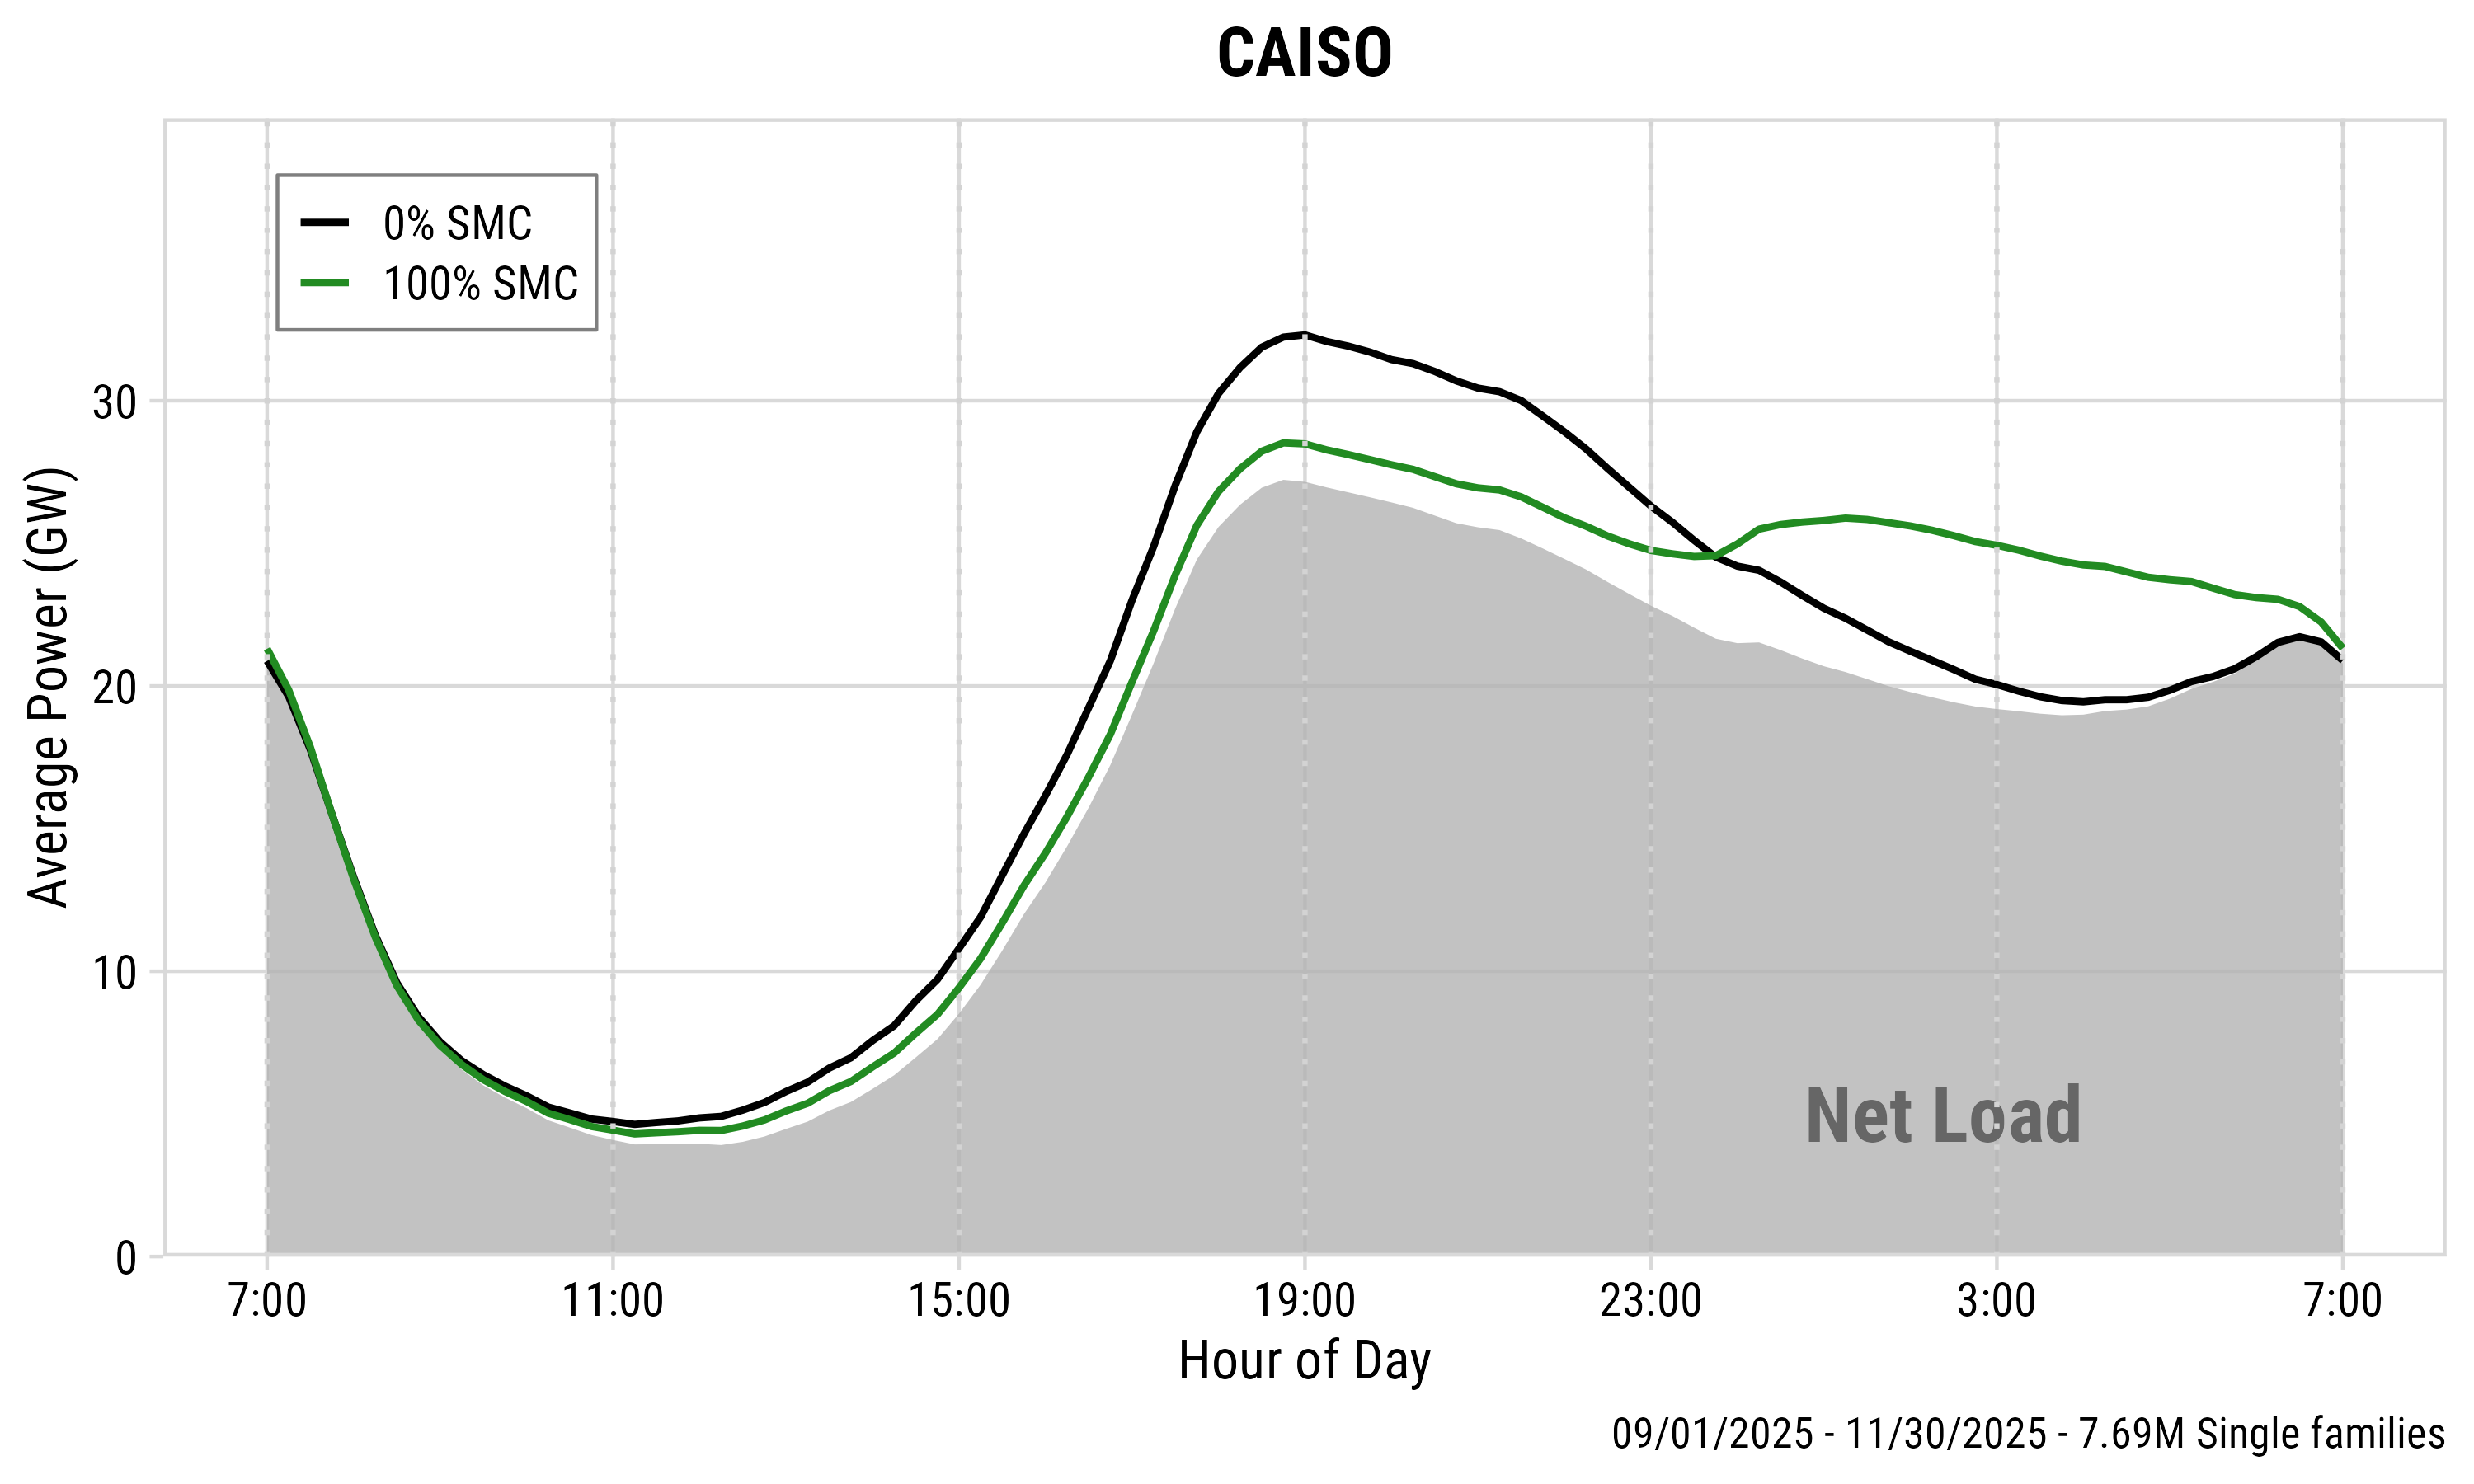
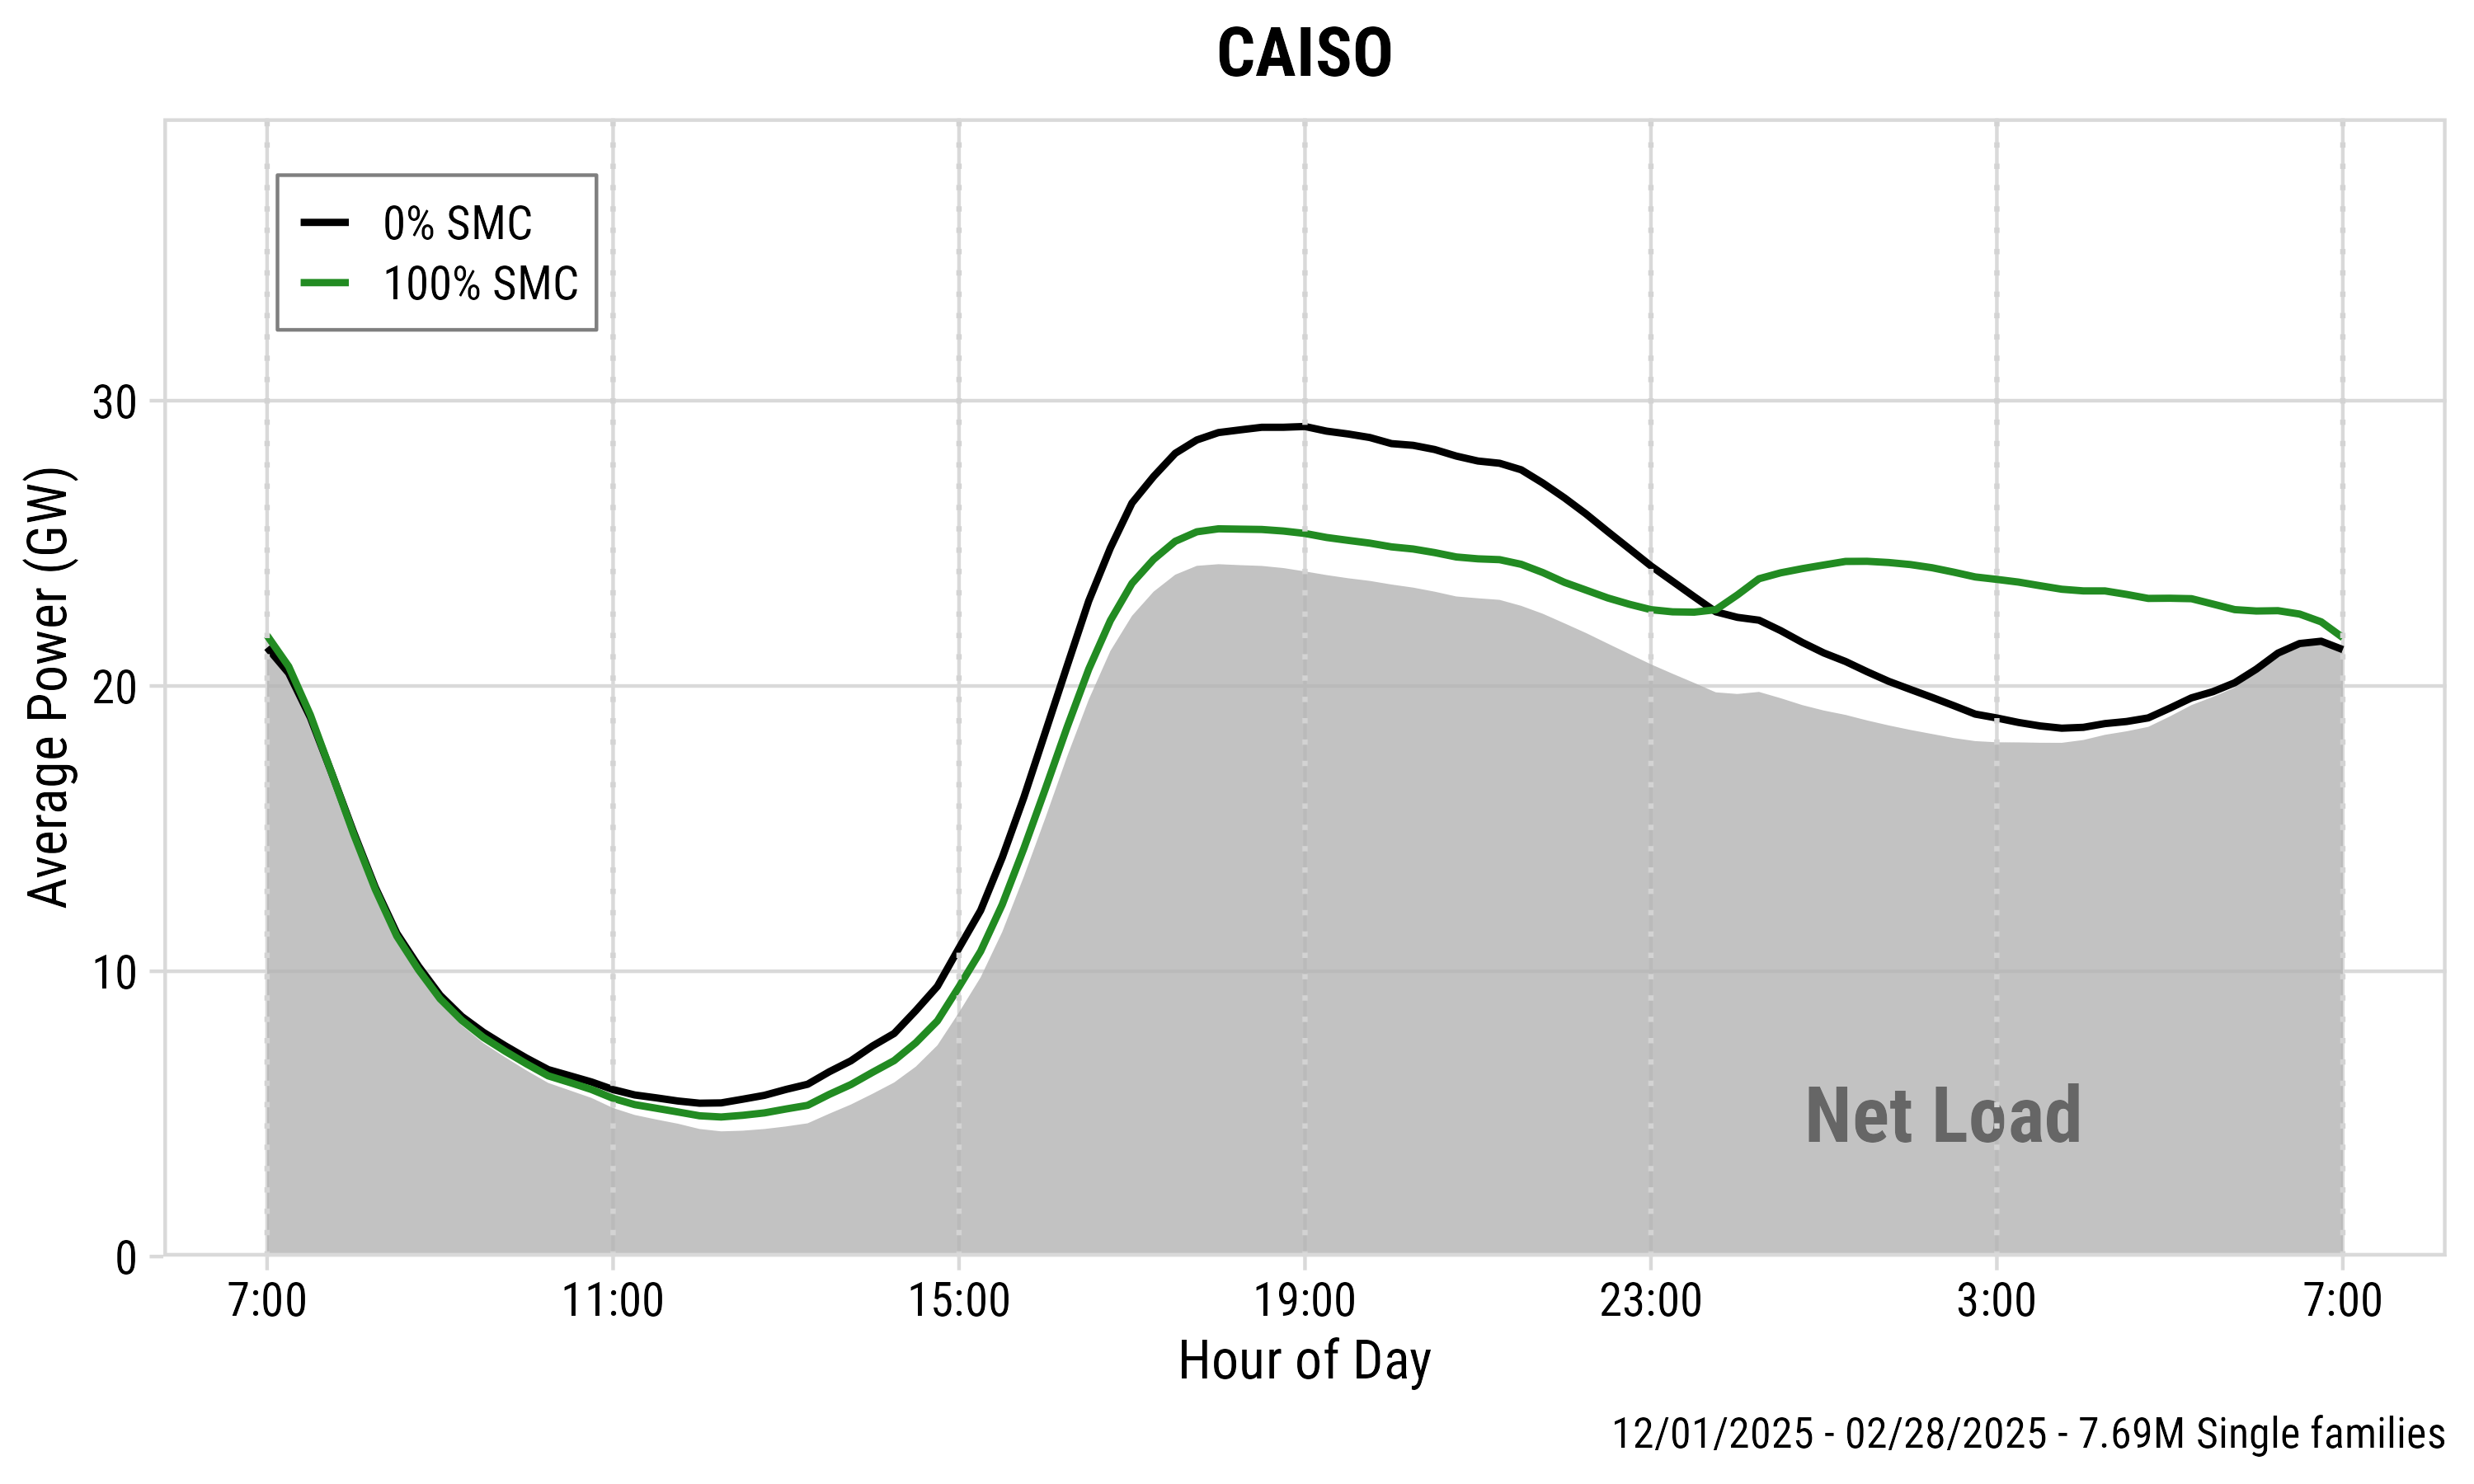
Seasonal Patterns: CAISO
| Spring | Summer | Fall | Winter |
|---|---|---|---|
|
|
|
|
| 3.7 GW (27.5 → 23.8) | 3.7 GW (34.3 → 30.6) | 3.8 GW (32.3 → 28.5) | 3.6 GW (29.1 → 25.5) |
| 13.5% | 10.8% | 11.8% | 12.4% |
| Peak shave for all seasons: 3.6–3.8 GW (10.8–13.5%) | |||
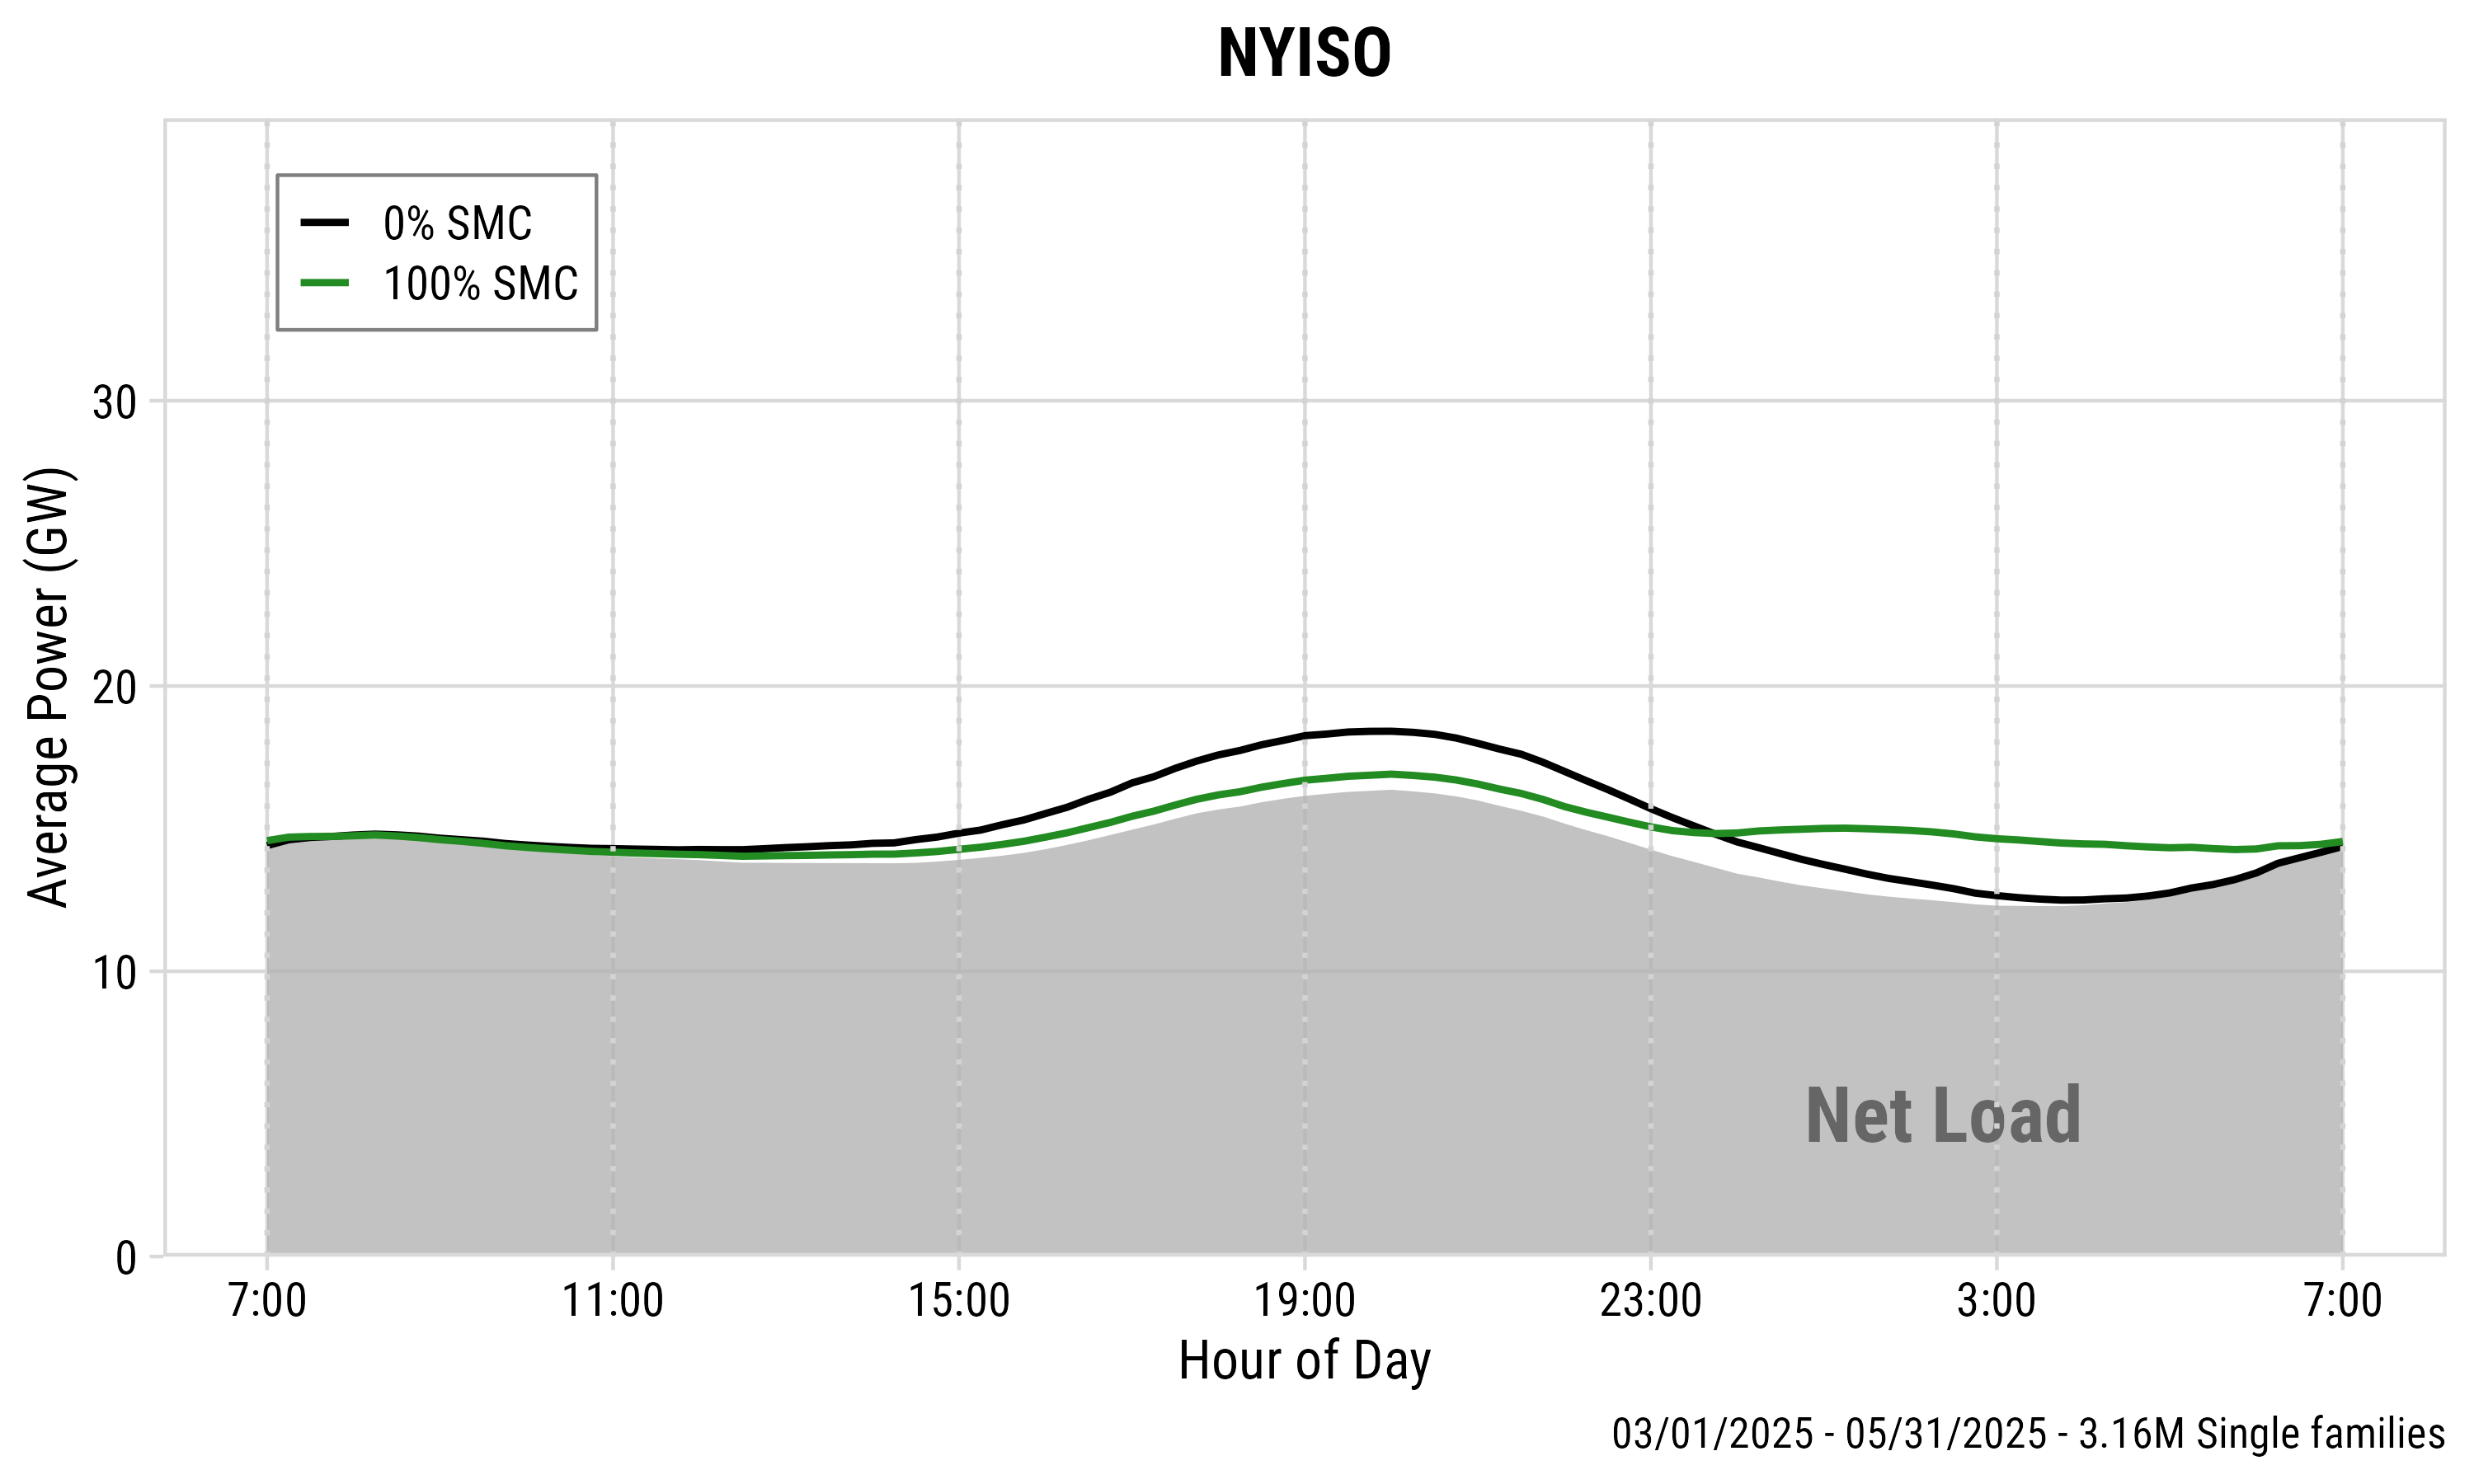
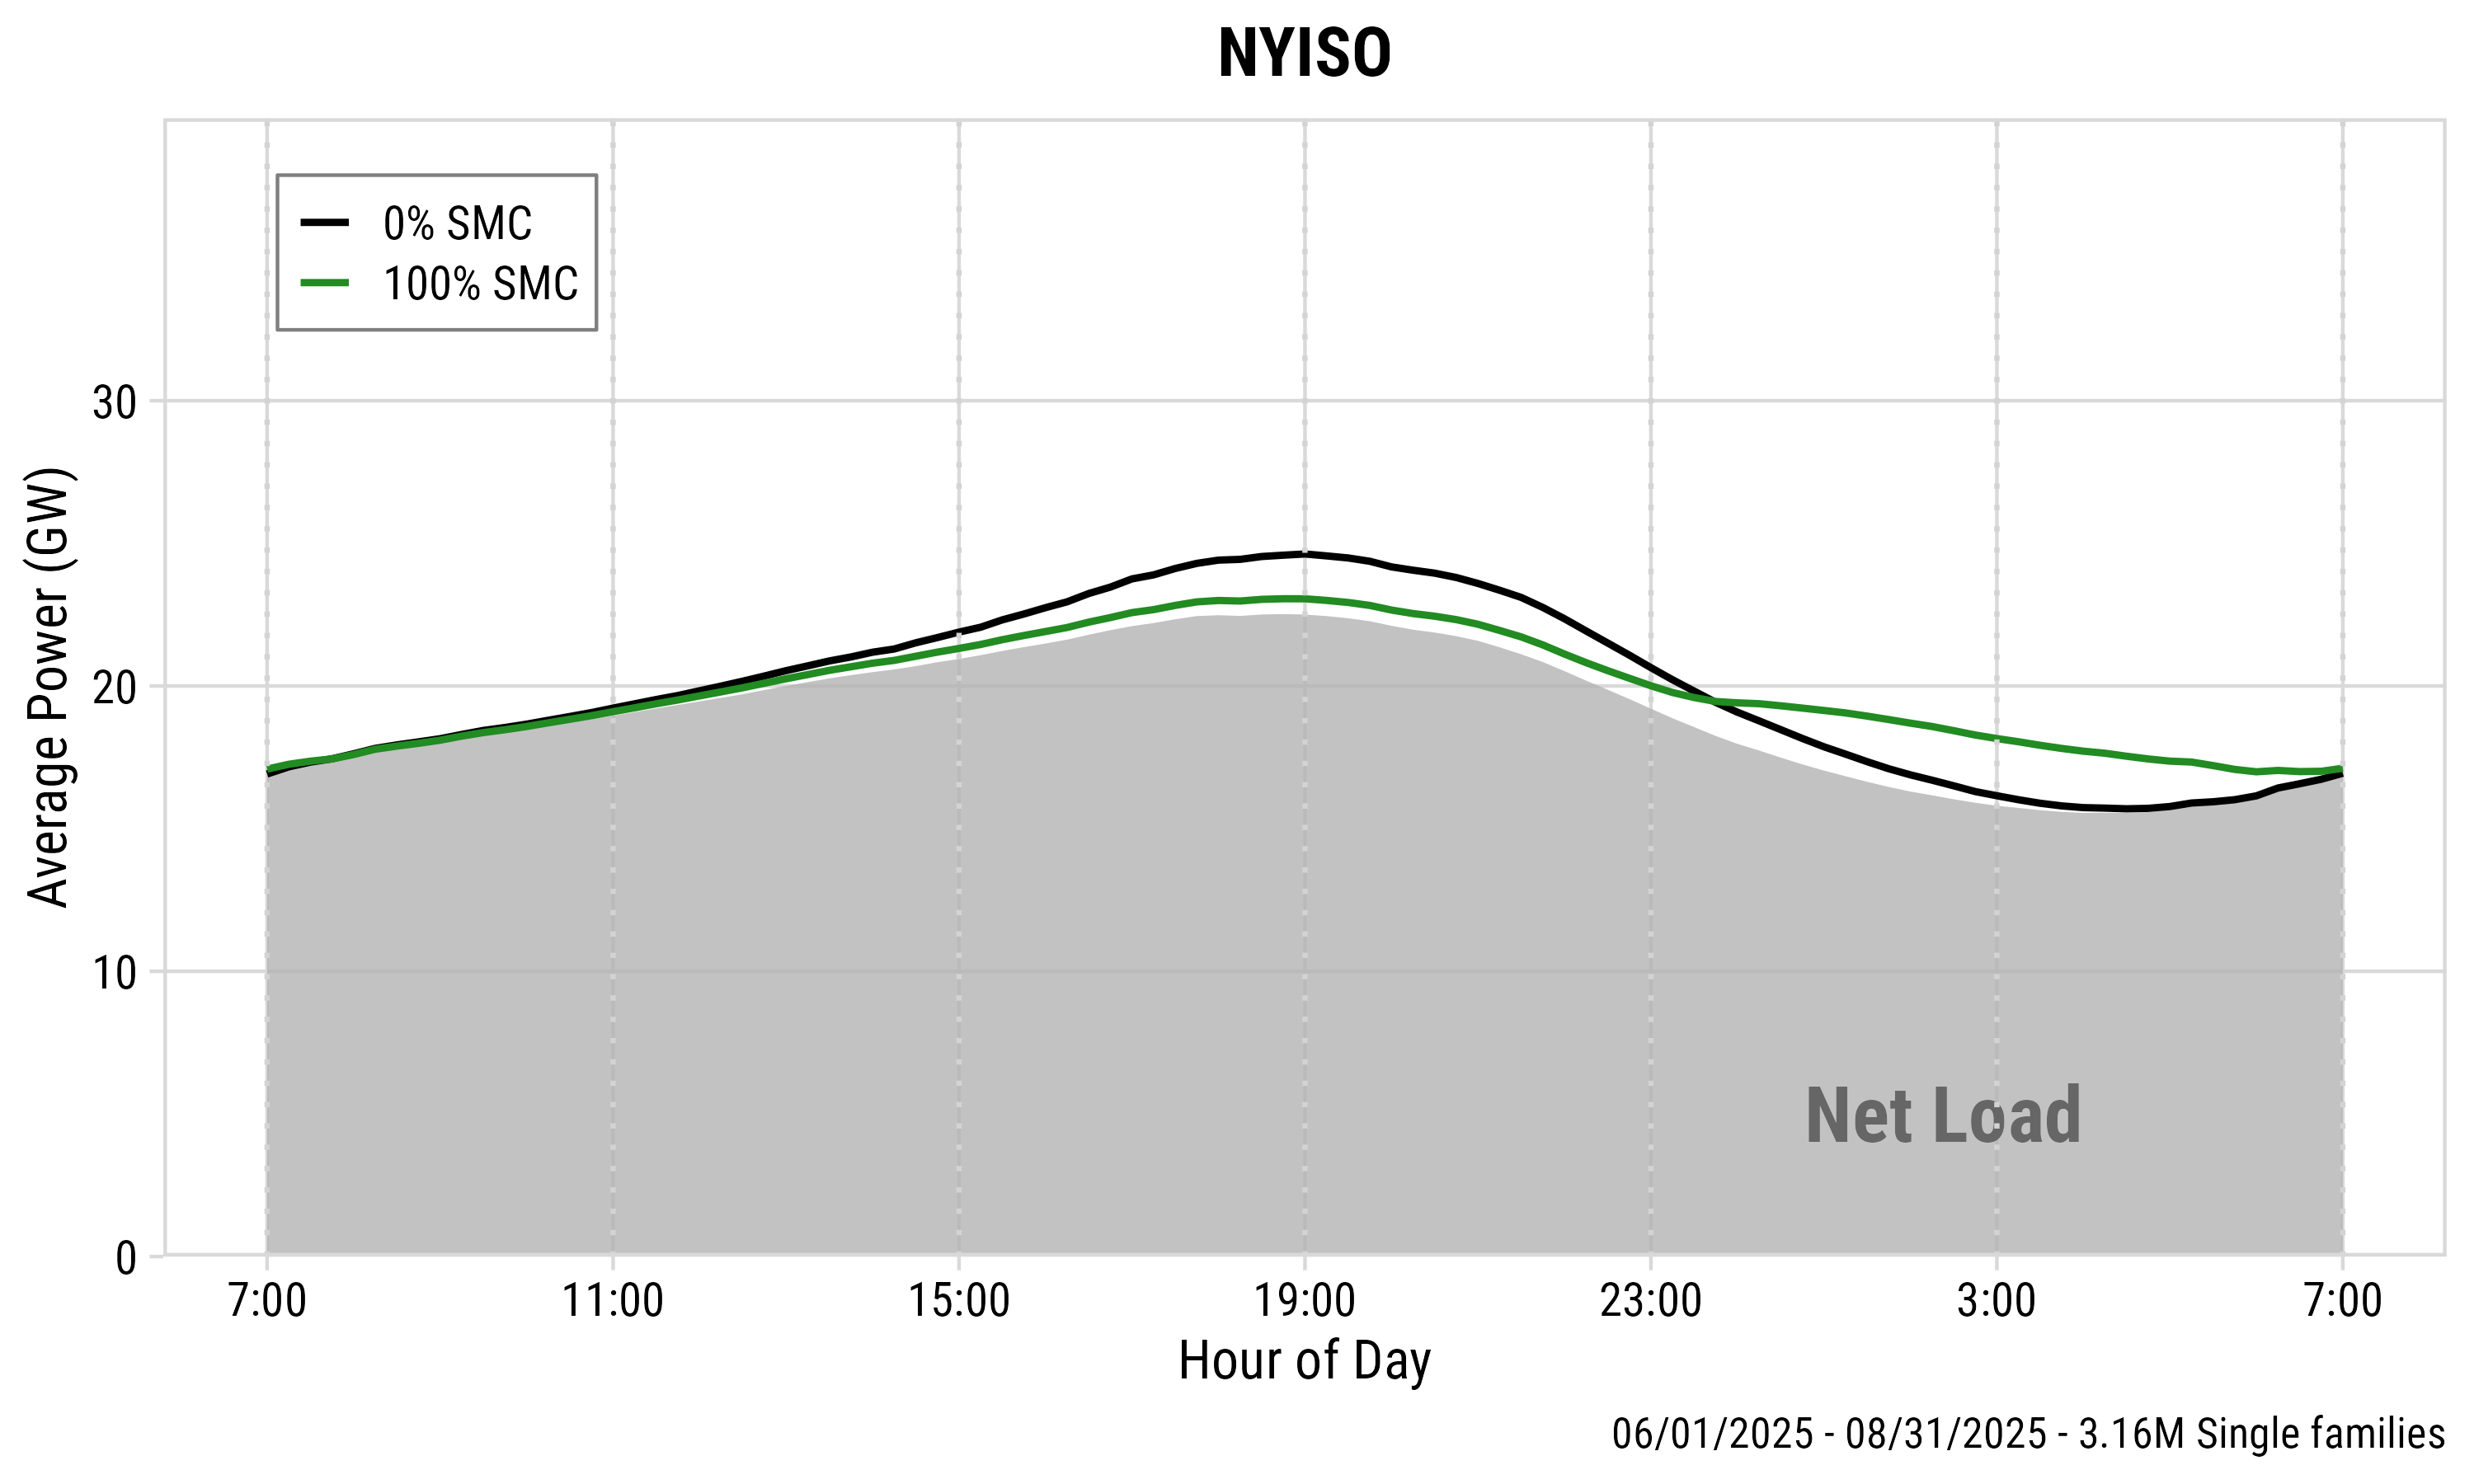
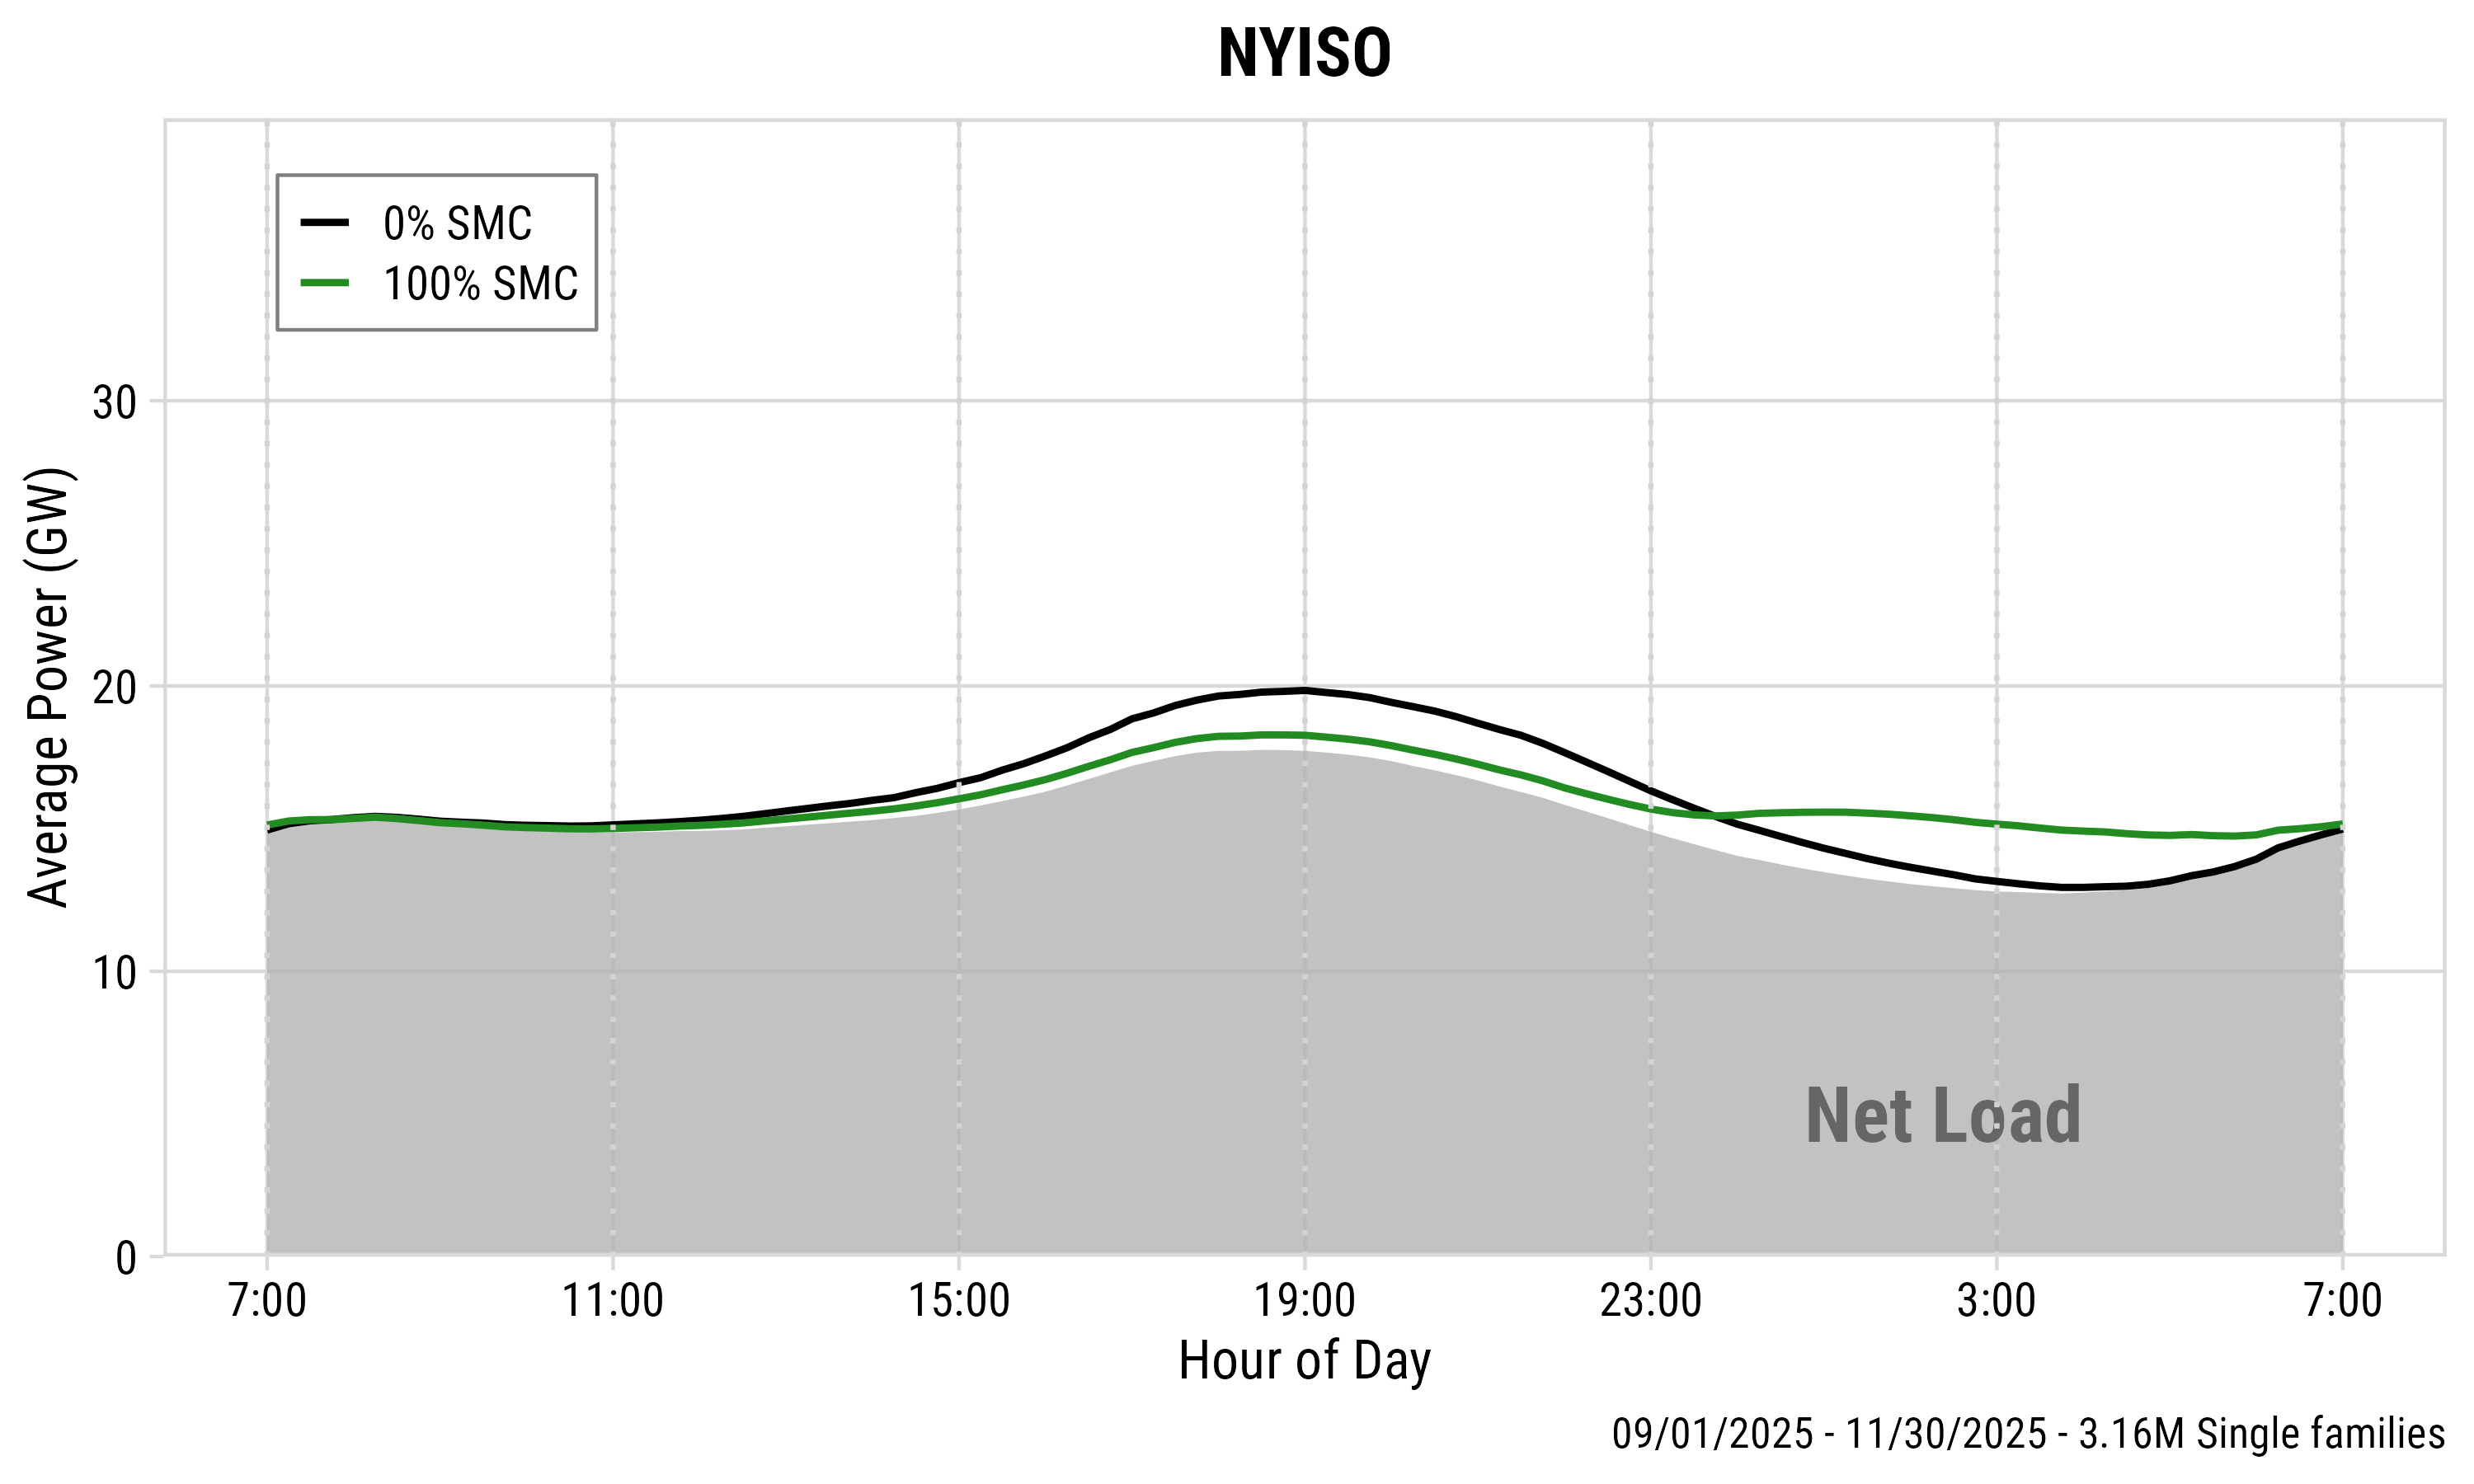
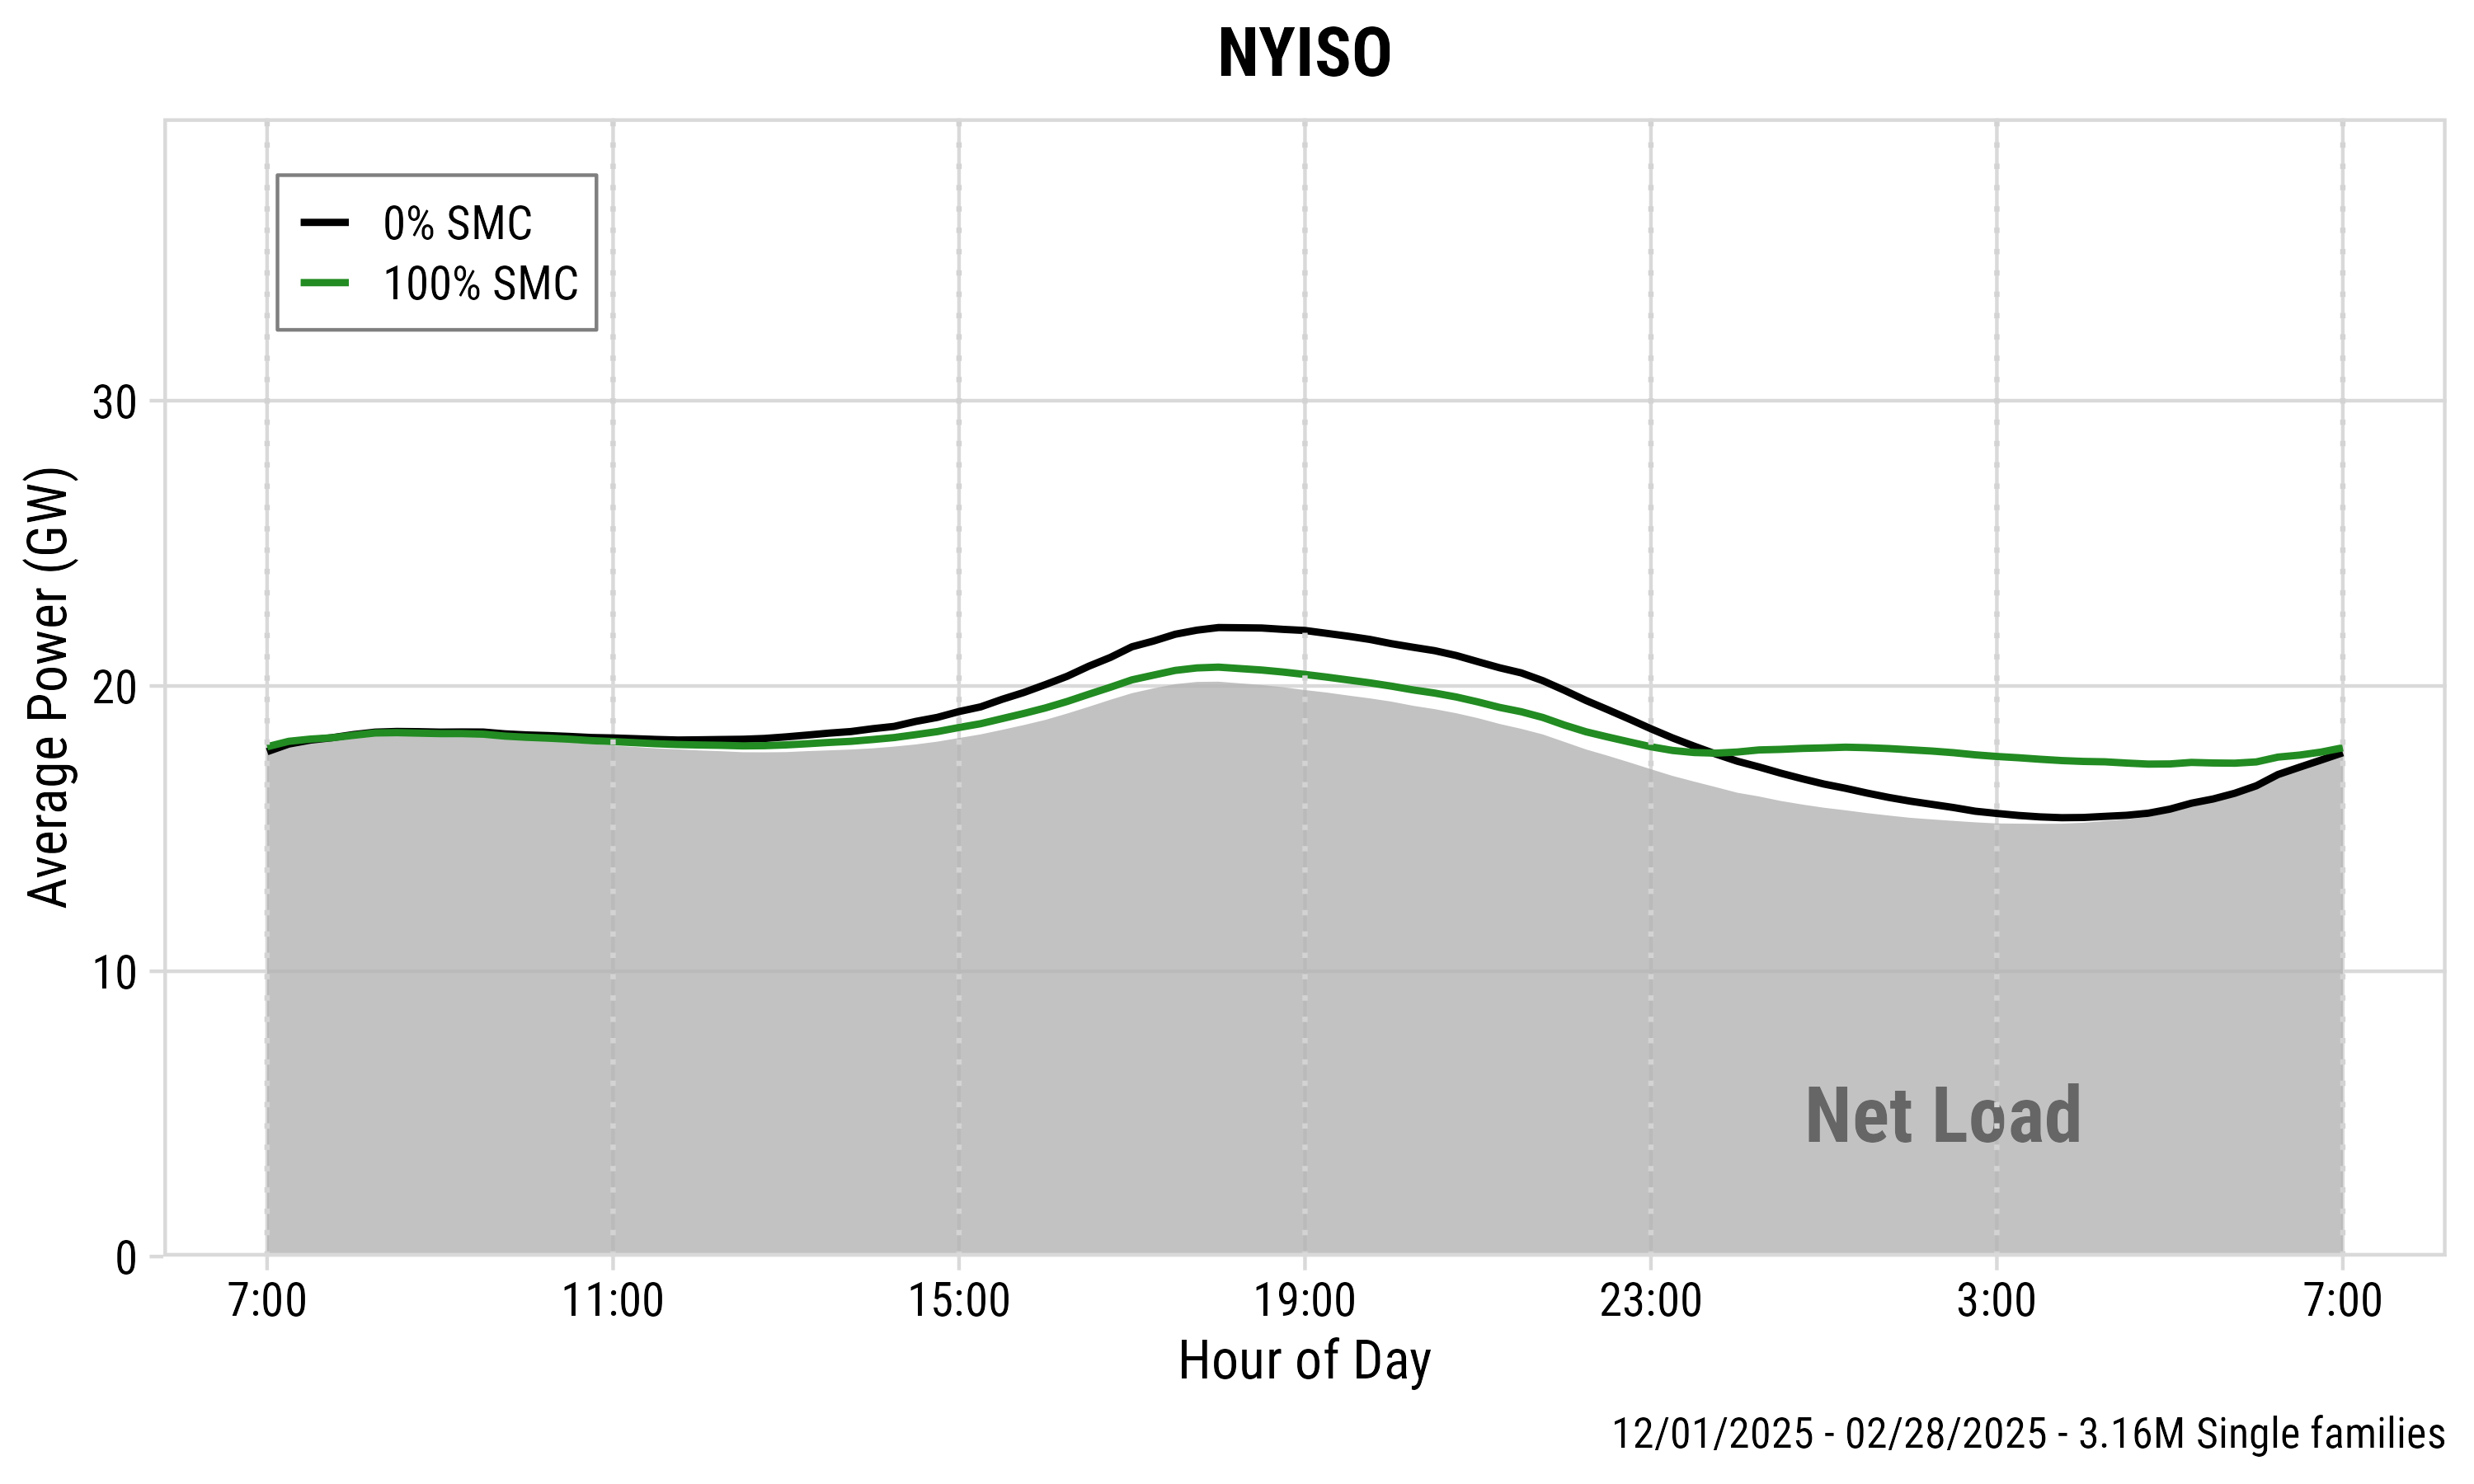
Seasonal Patterns: NYISO
| Spring | Summer | Fall | Winter |
|---|---|---|---|
|
|
|
|
| 1.5 GW (18.4 → 16.9) | 1.6 GW (24.6 → 23.0) | 1.5 GW (19.8 → 18.3) | 1.4 GW (22.1 → 20.7) |
| 8.2% | 6.5% | 7.6% | 6.3% |
| Peak shave for all seasons: 1.4–1.6 GW (6.3–8.2%) | |||
Seasonal cost efficiency is
consistent in CAISO, but varies in NYISO.
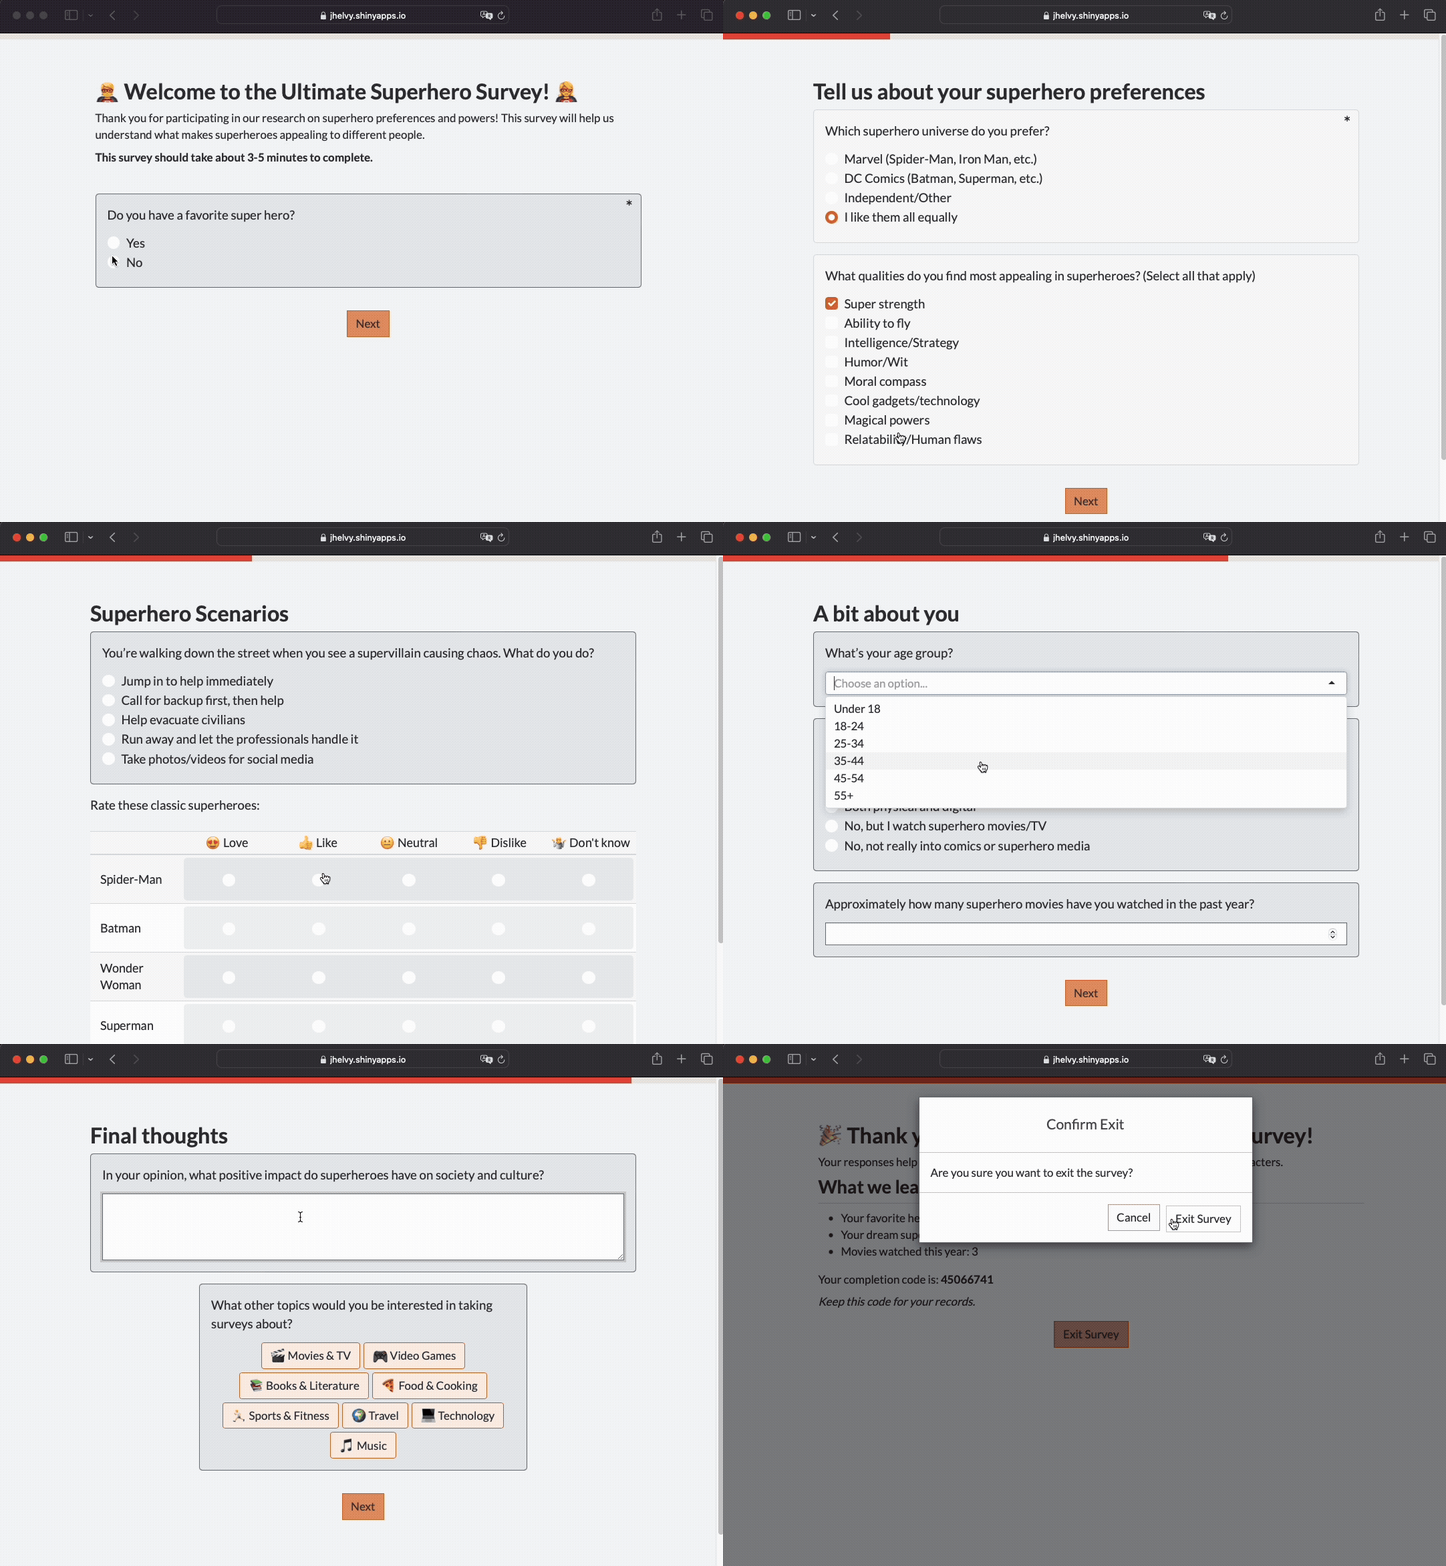
Typical Web Survey
Google Form - GUI Interface
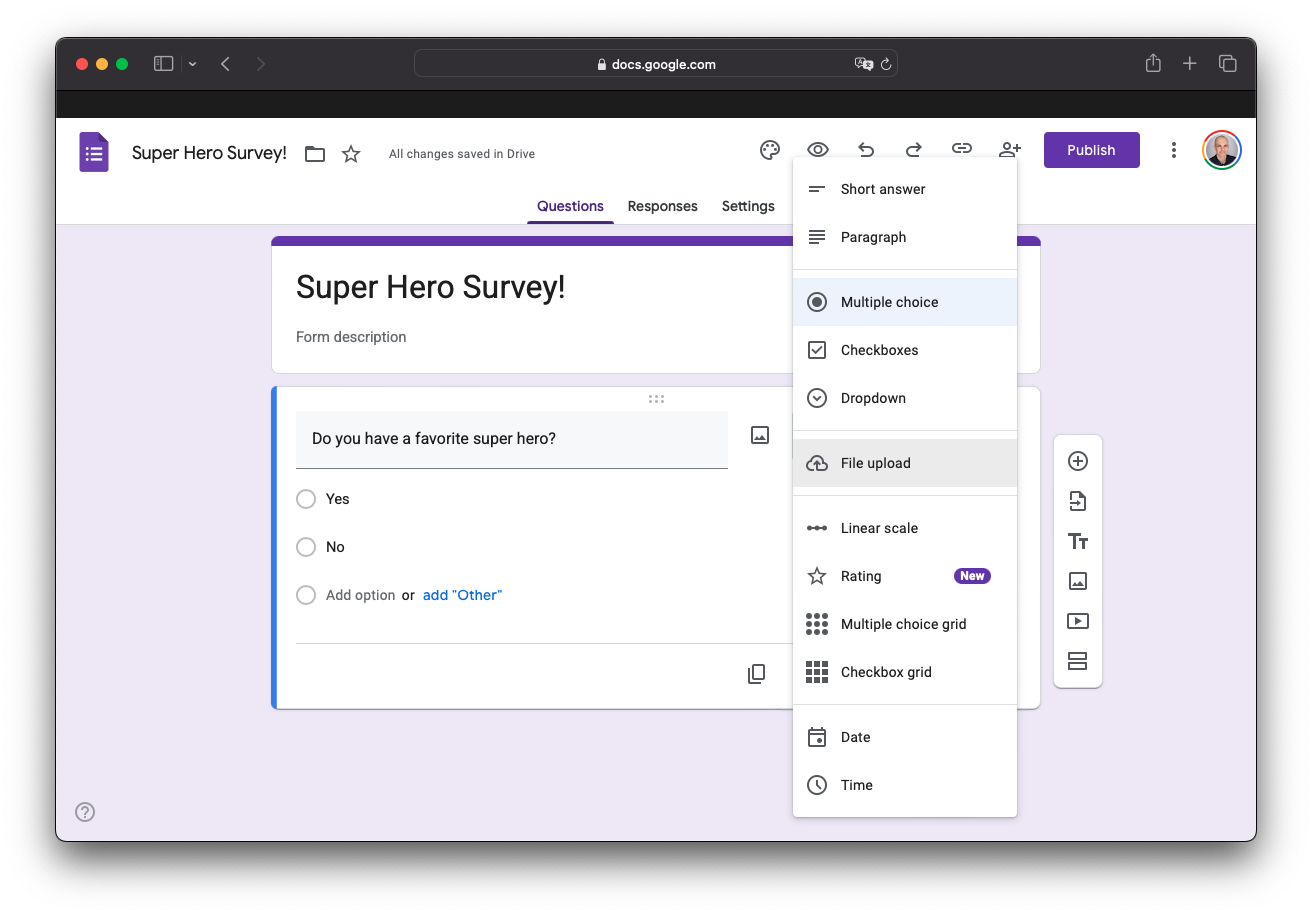
Limitations
❌ Reproducibility
❌ Version control
❌ Limited features
❌ Open source
Qualtrics - Commercial Platform
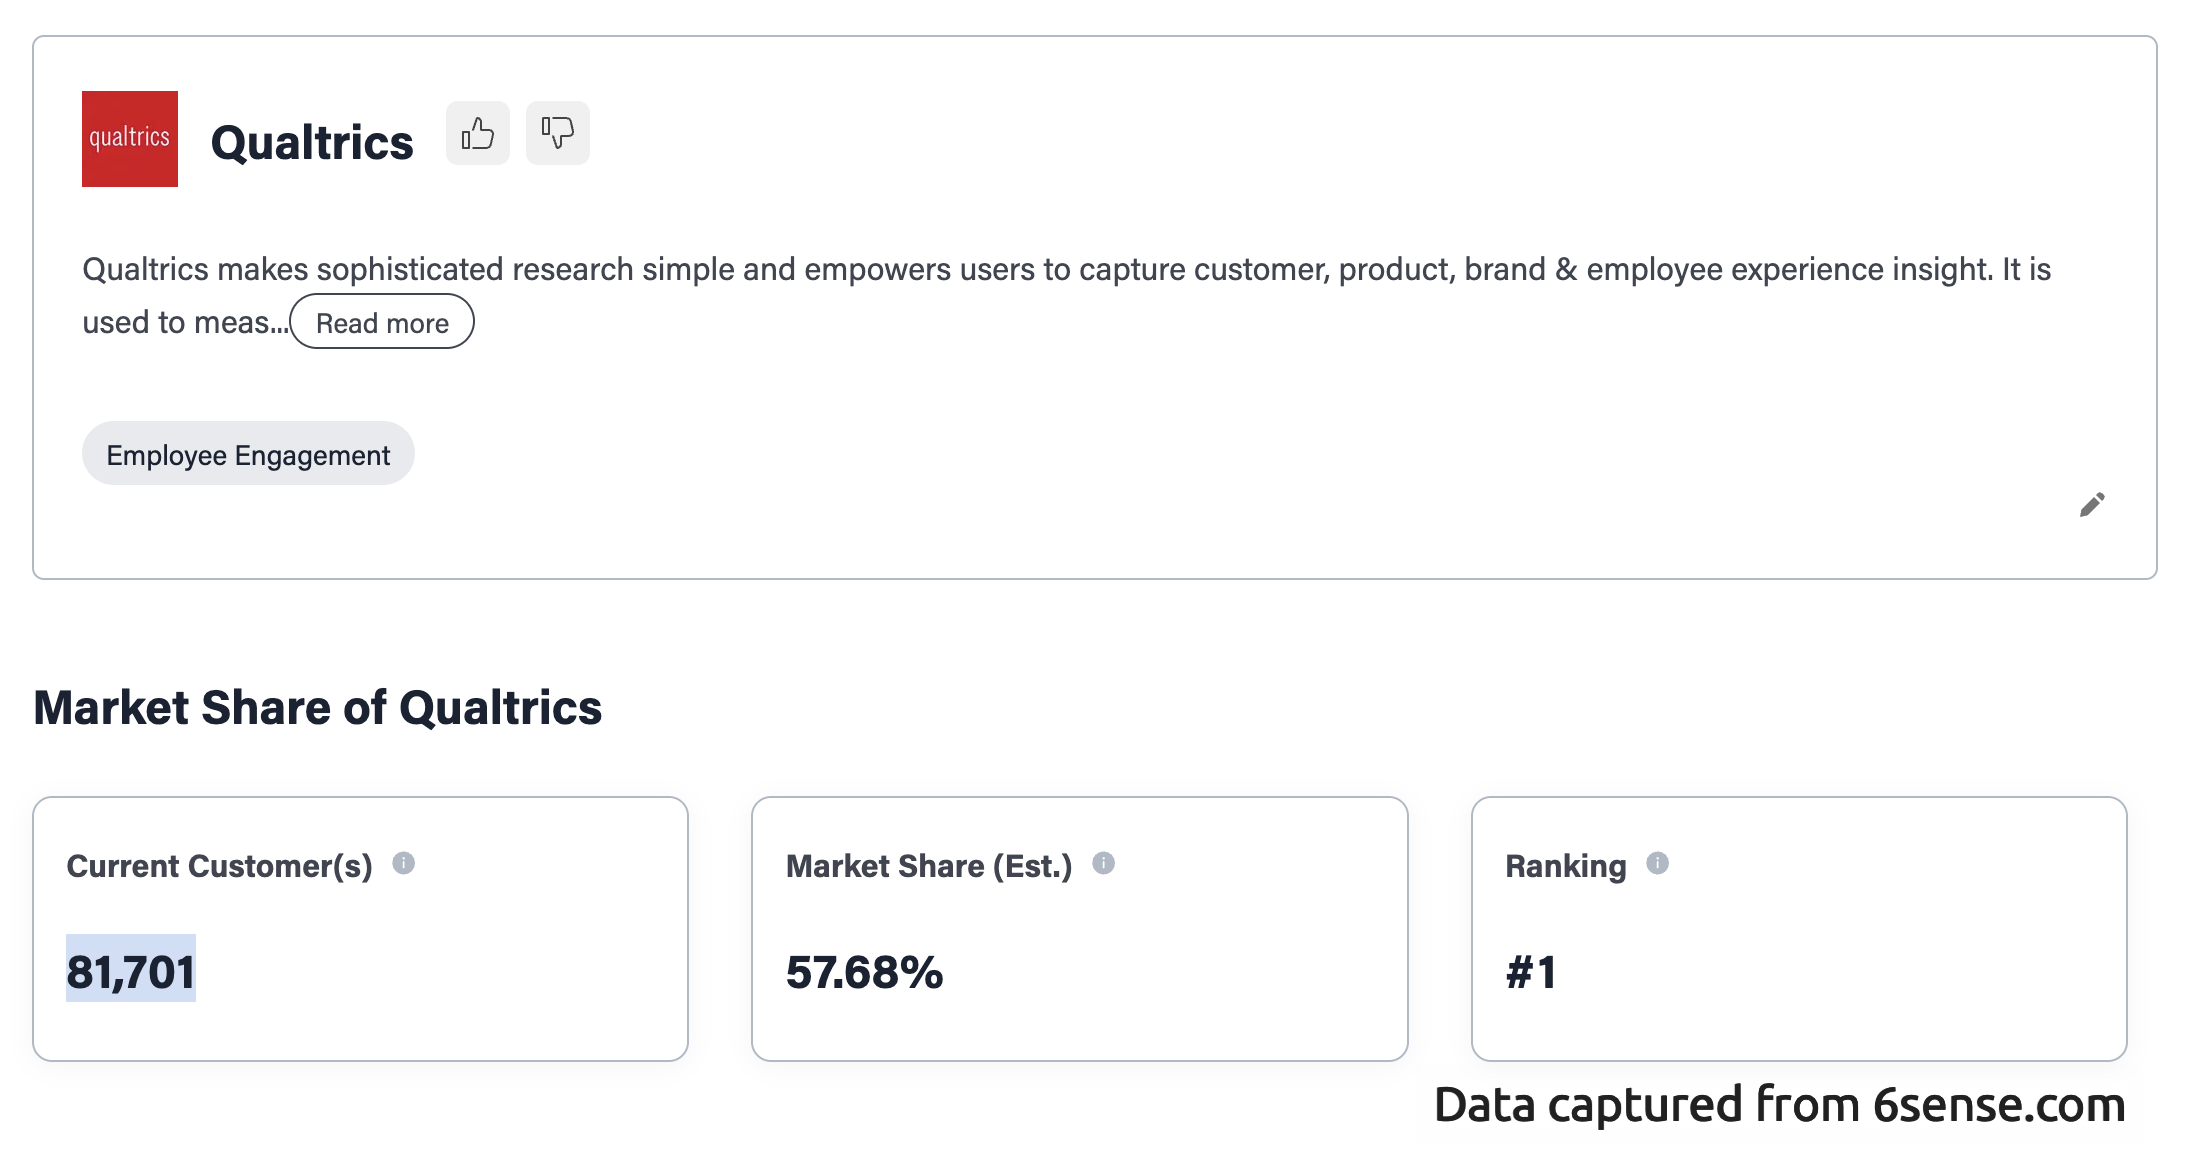
Expensive!
Introducing surveydown!

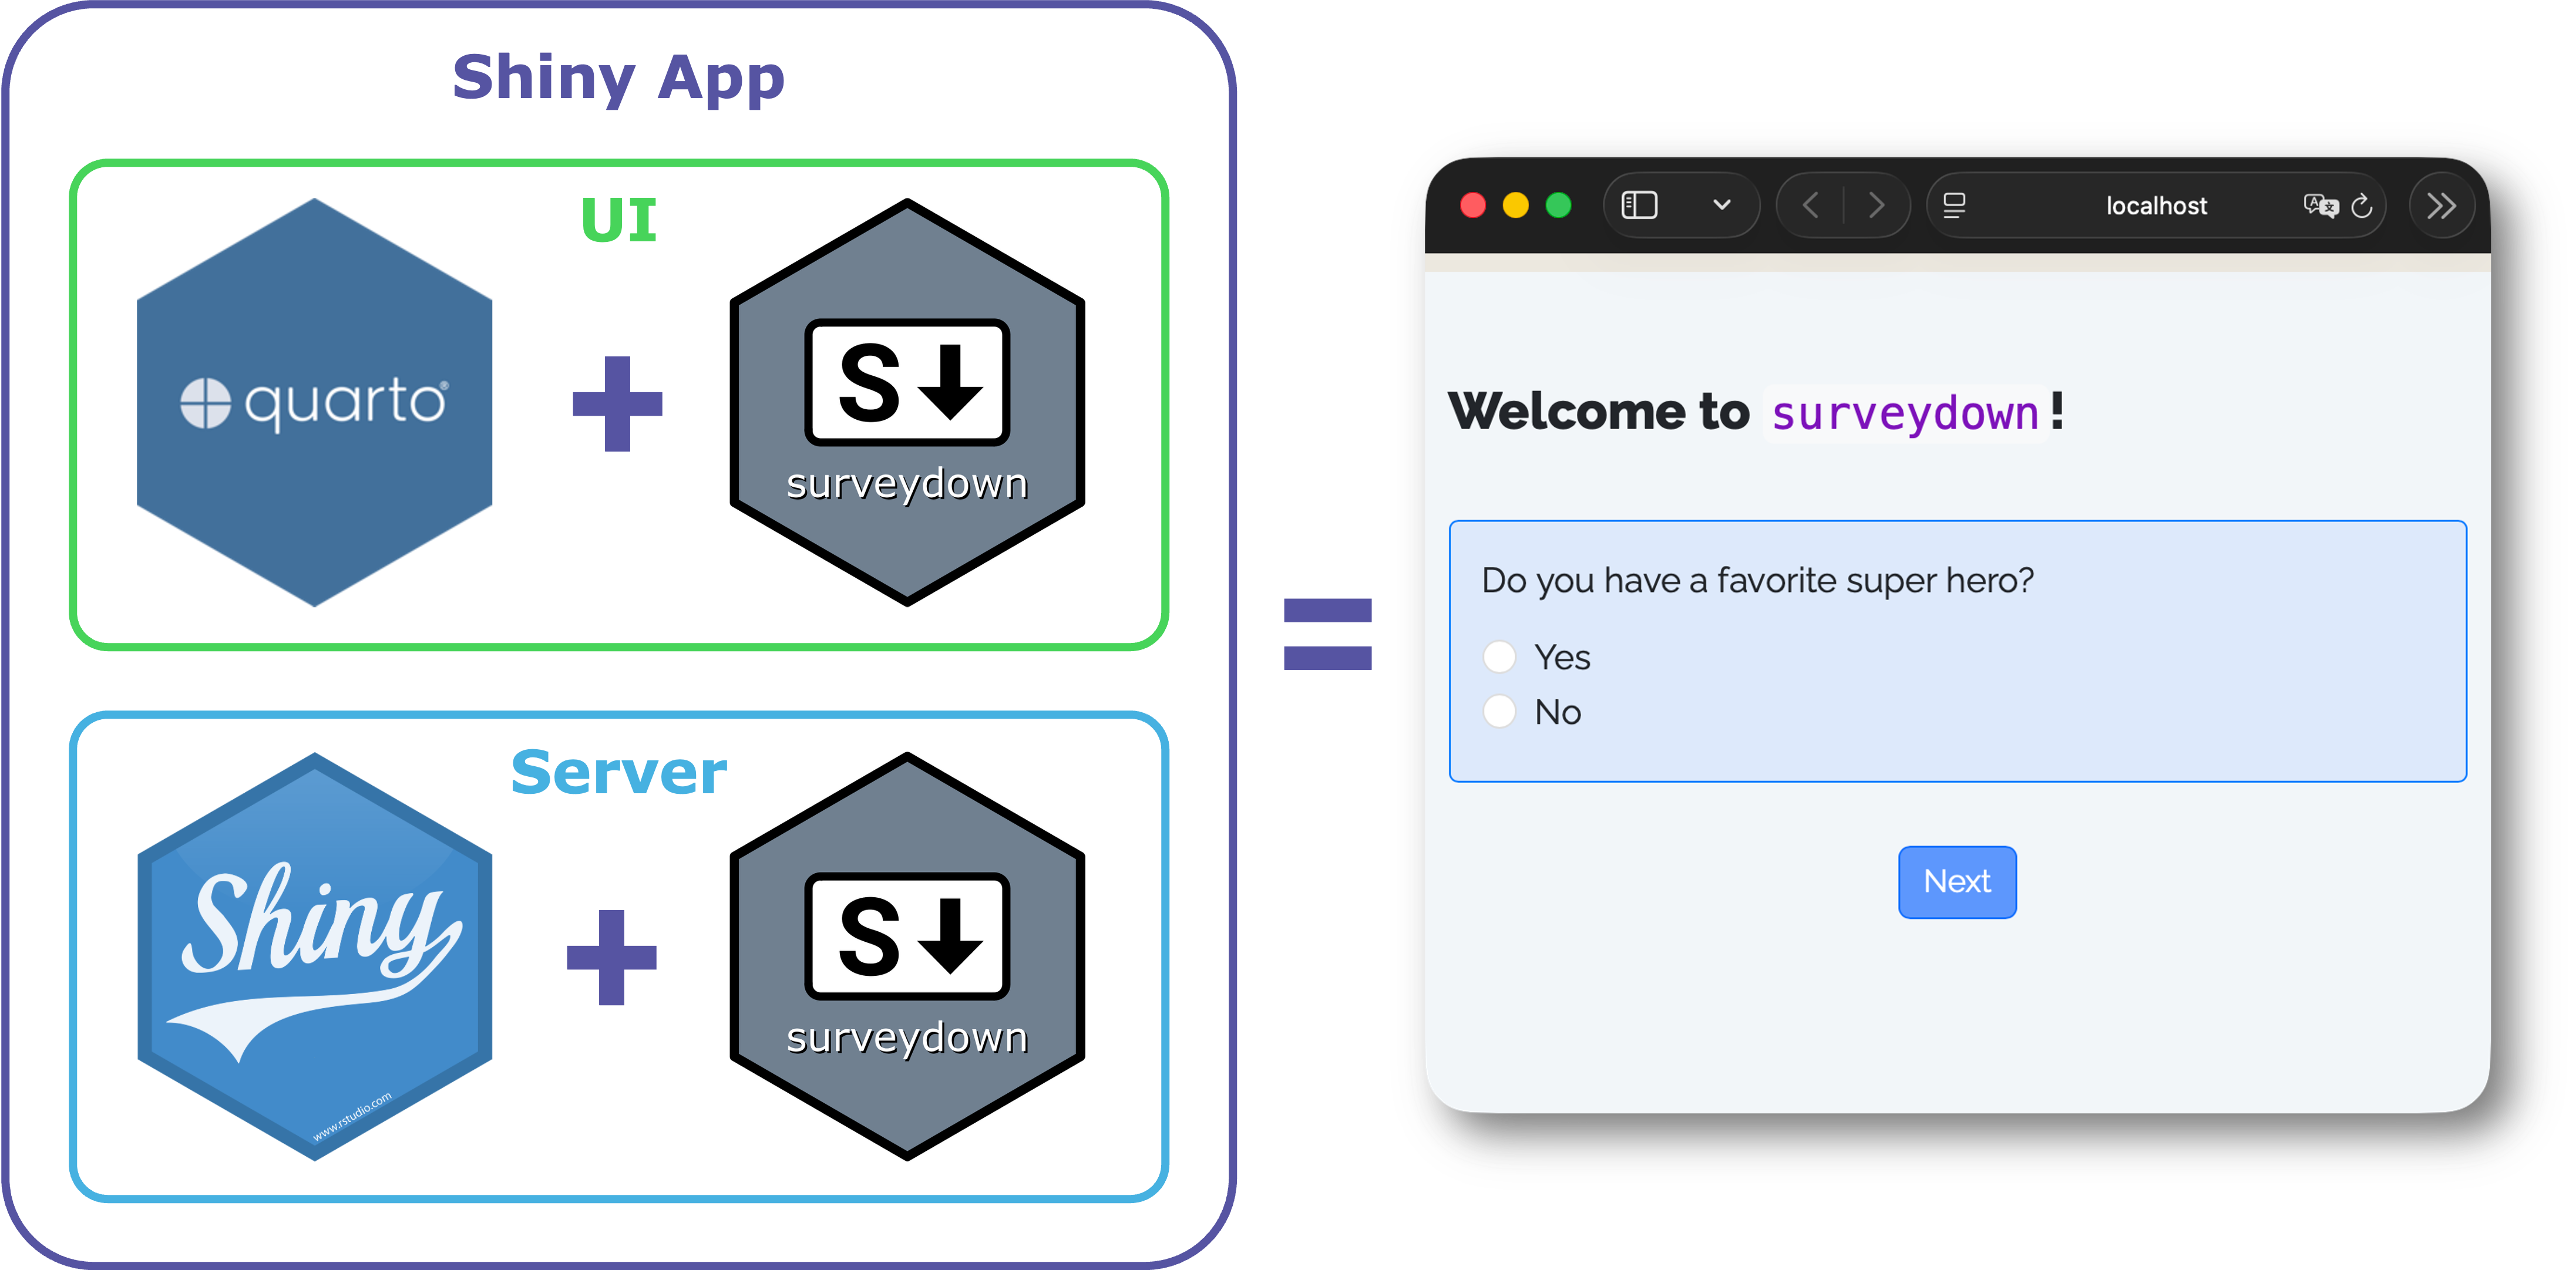
R package that renders Quarto files into surveys
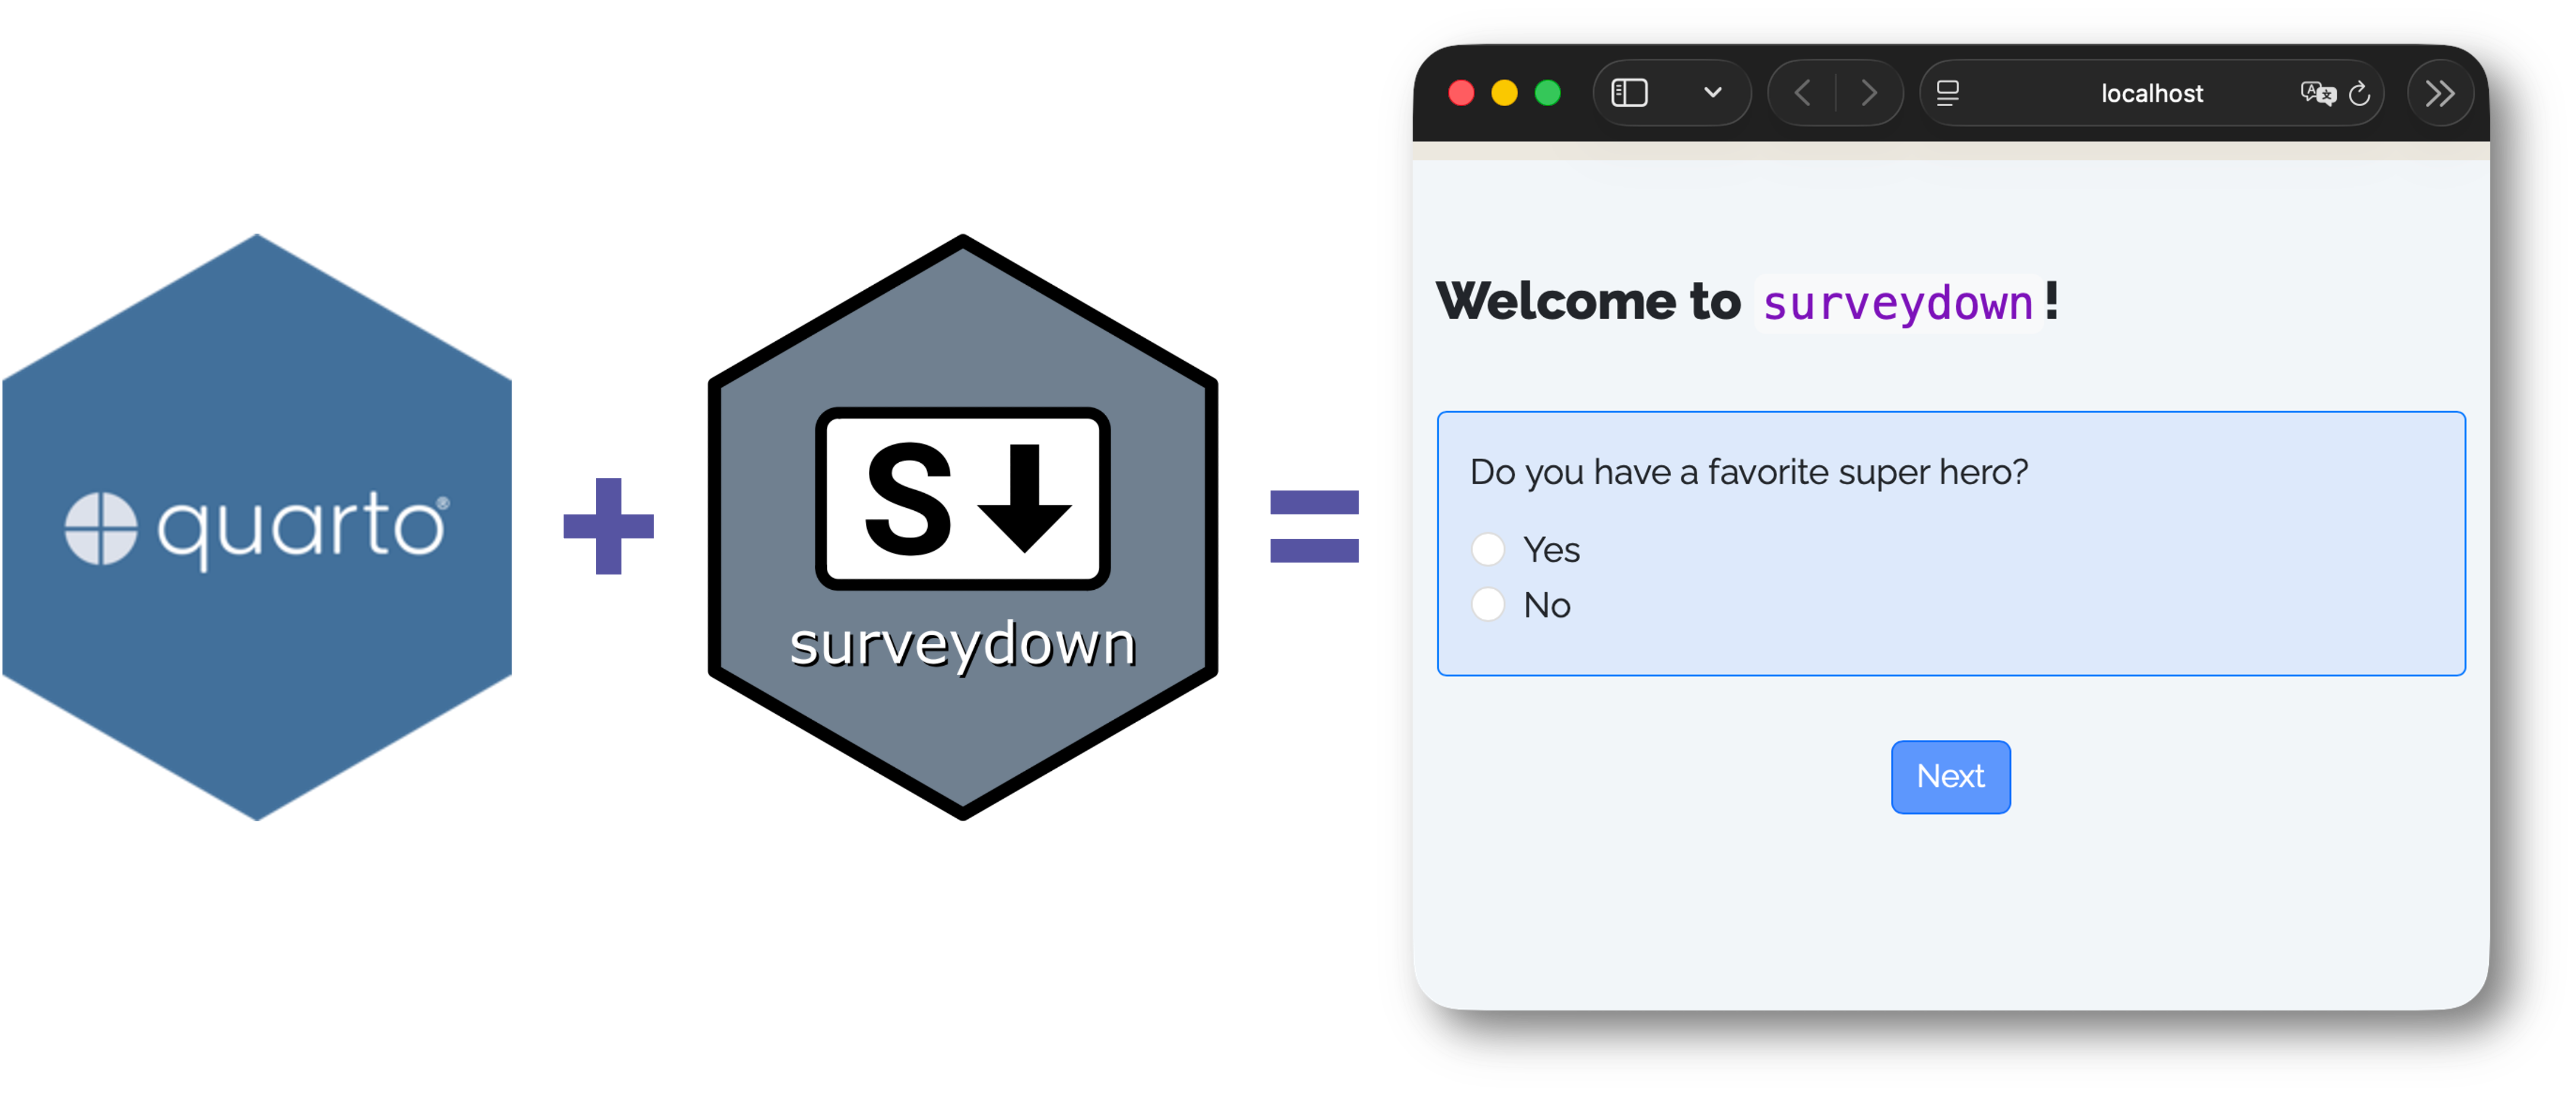
Quarto is a publishing system
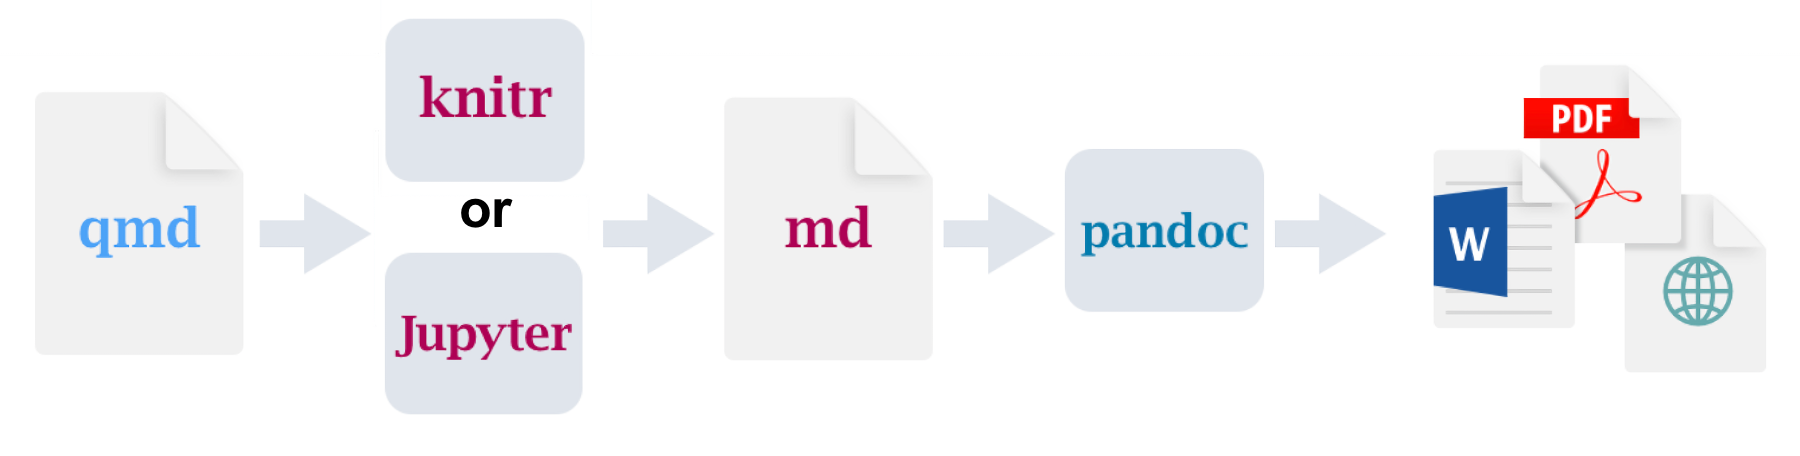
Original qmd file
Markdown + R code chunks
Rendered HTML
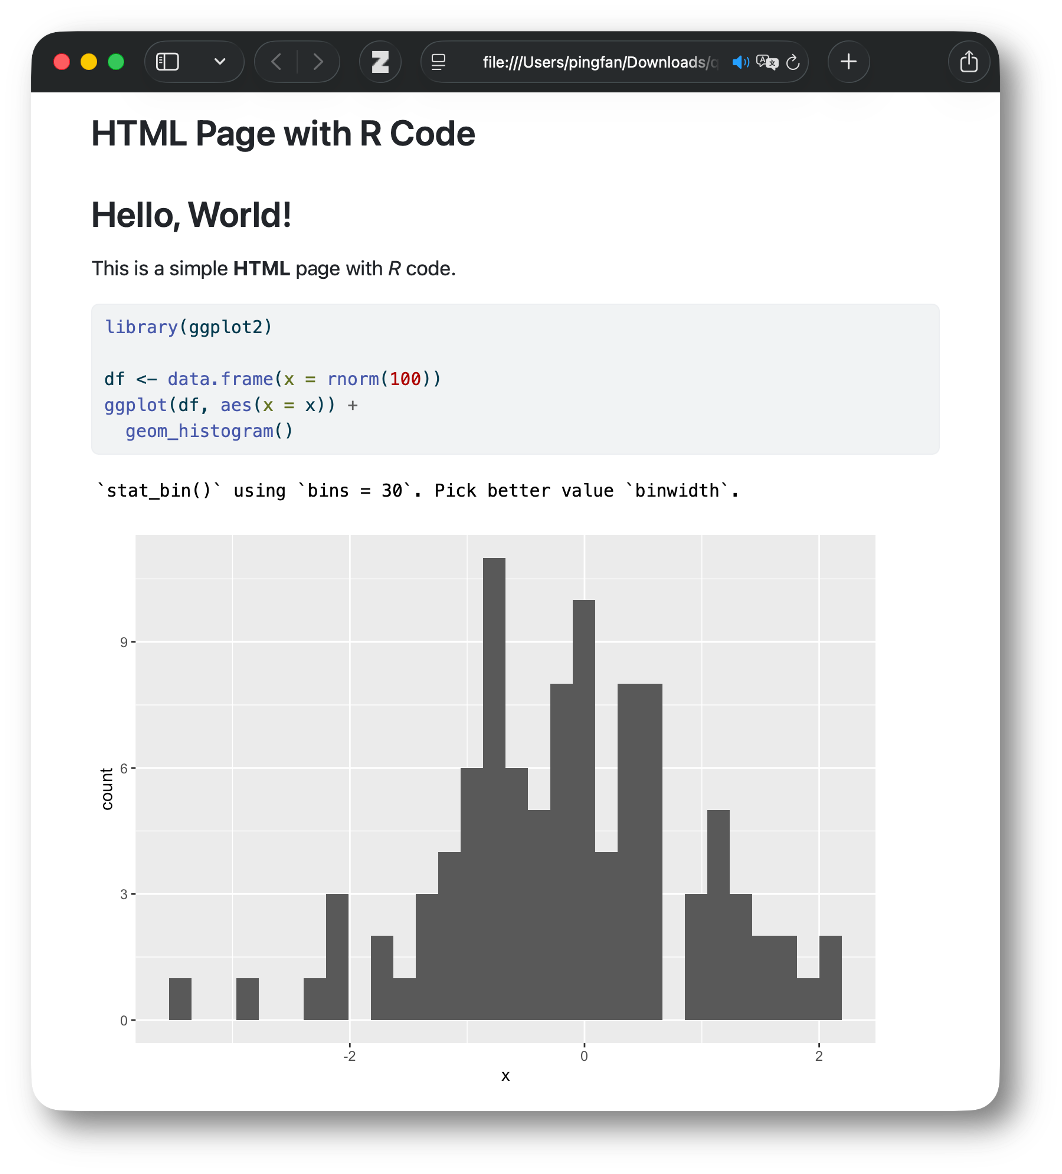
survey.qmd
---
format: html
echo: false
warning: false
---

```{r}
library(surveydown)
```

--- welcome

# Welcome to `surveydown`!

```{r}
sd_question(
  type  = "mc",
  id    = "has_fav_hero",
  label = "Do you have a favorite super hero?",
  option = c(
    "Yes" = "yes",
    "No"  = "no"
  )
)

sd_next()
```

--- some_other_page

Other content...
Rendered Survey
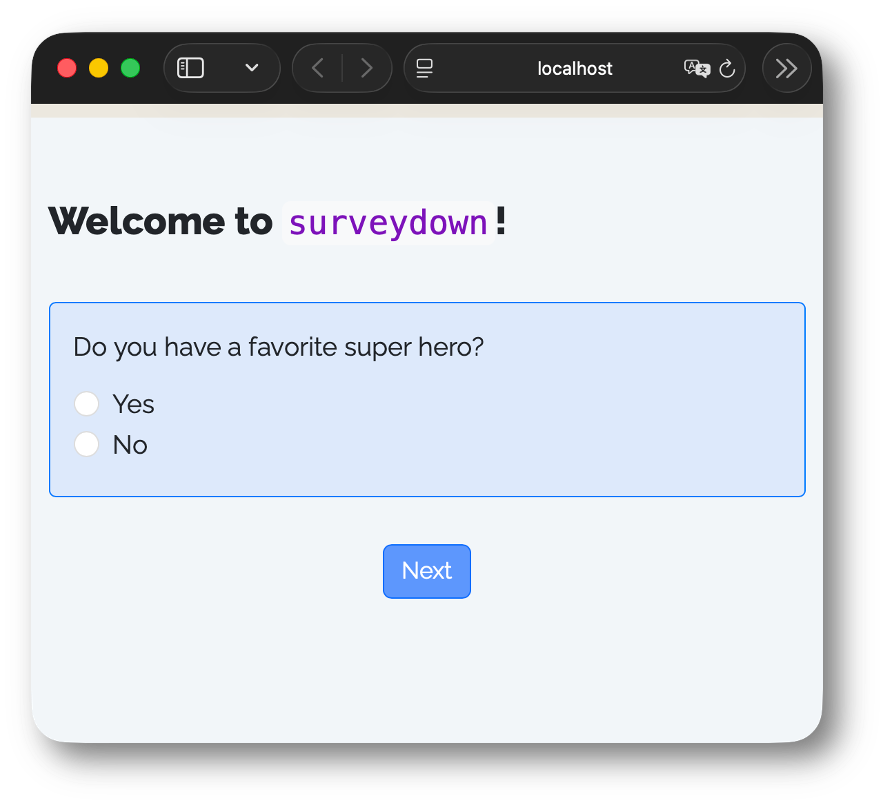
survey.qmd
---
format: html
echo: false
warning: false
---

```{r}
library(surveydown)
```

--- welcome

# Welcome to `surveydown`!

```{r}
sd_question(
  type  = "mc",
  id    = "has_fav_hero",
  label = "Do you have a favorite super hero?",
  option = c(
    "Yes" = "yes",
    "No"  = "no"
  )
)

sd_next()
```

--- some_other_page

Other content...Rendered Survey
survey.qmd
---
format: html
echo: false
warning: false
---

```{r}
library(surveydown)
```

--- welcome

# Welcome to `surveydown`!

```{r}
sd_question(
  type  = "mc",
  id    = "has_fav_hero",
  label = "Do you have a favorite super hero?",
  option = c(
    "Yes" = "yes",
    "No"  = "no"
  )
)

sd_next()
```

--- some_other_page

Other content...Rendered Survey
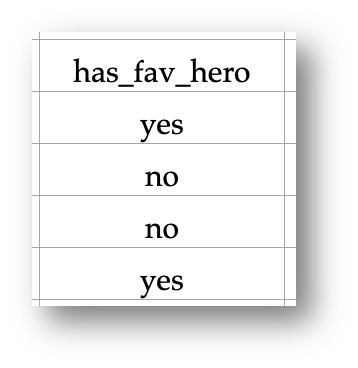
Quarto renders to static html pages.
Shiny turns them interactive.

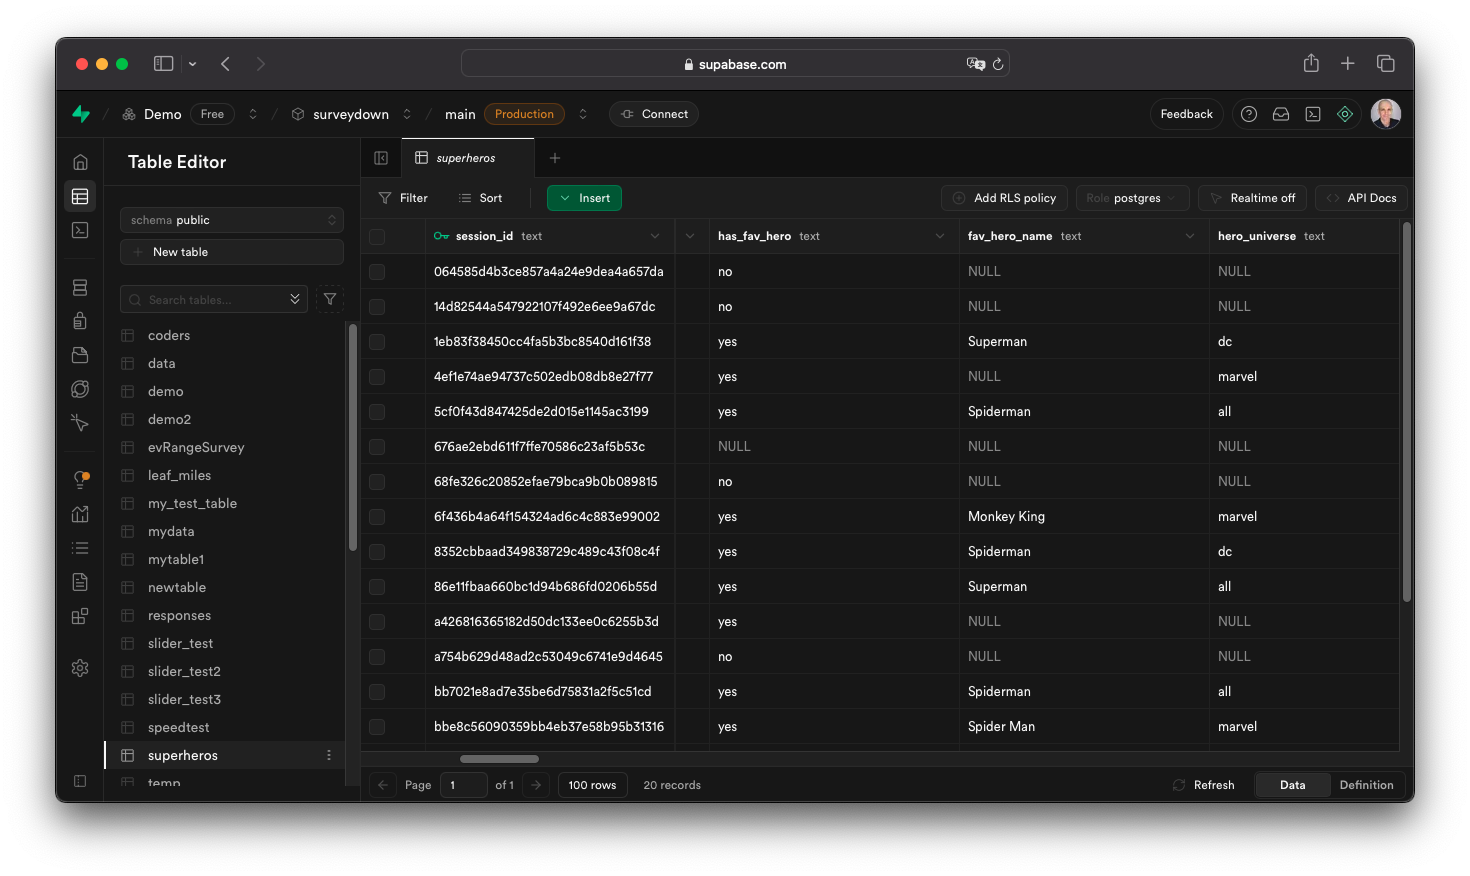
PostgreSQL for response data storage.

supabase.com
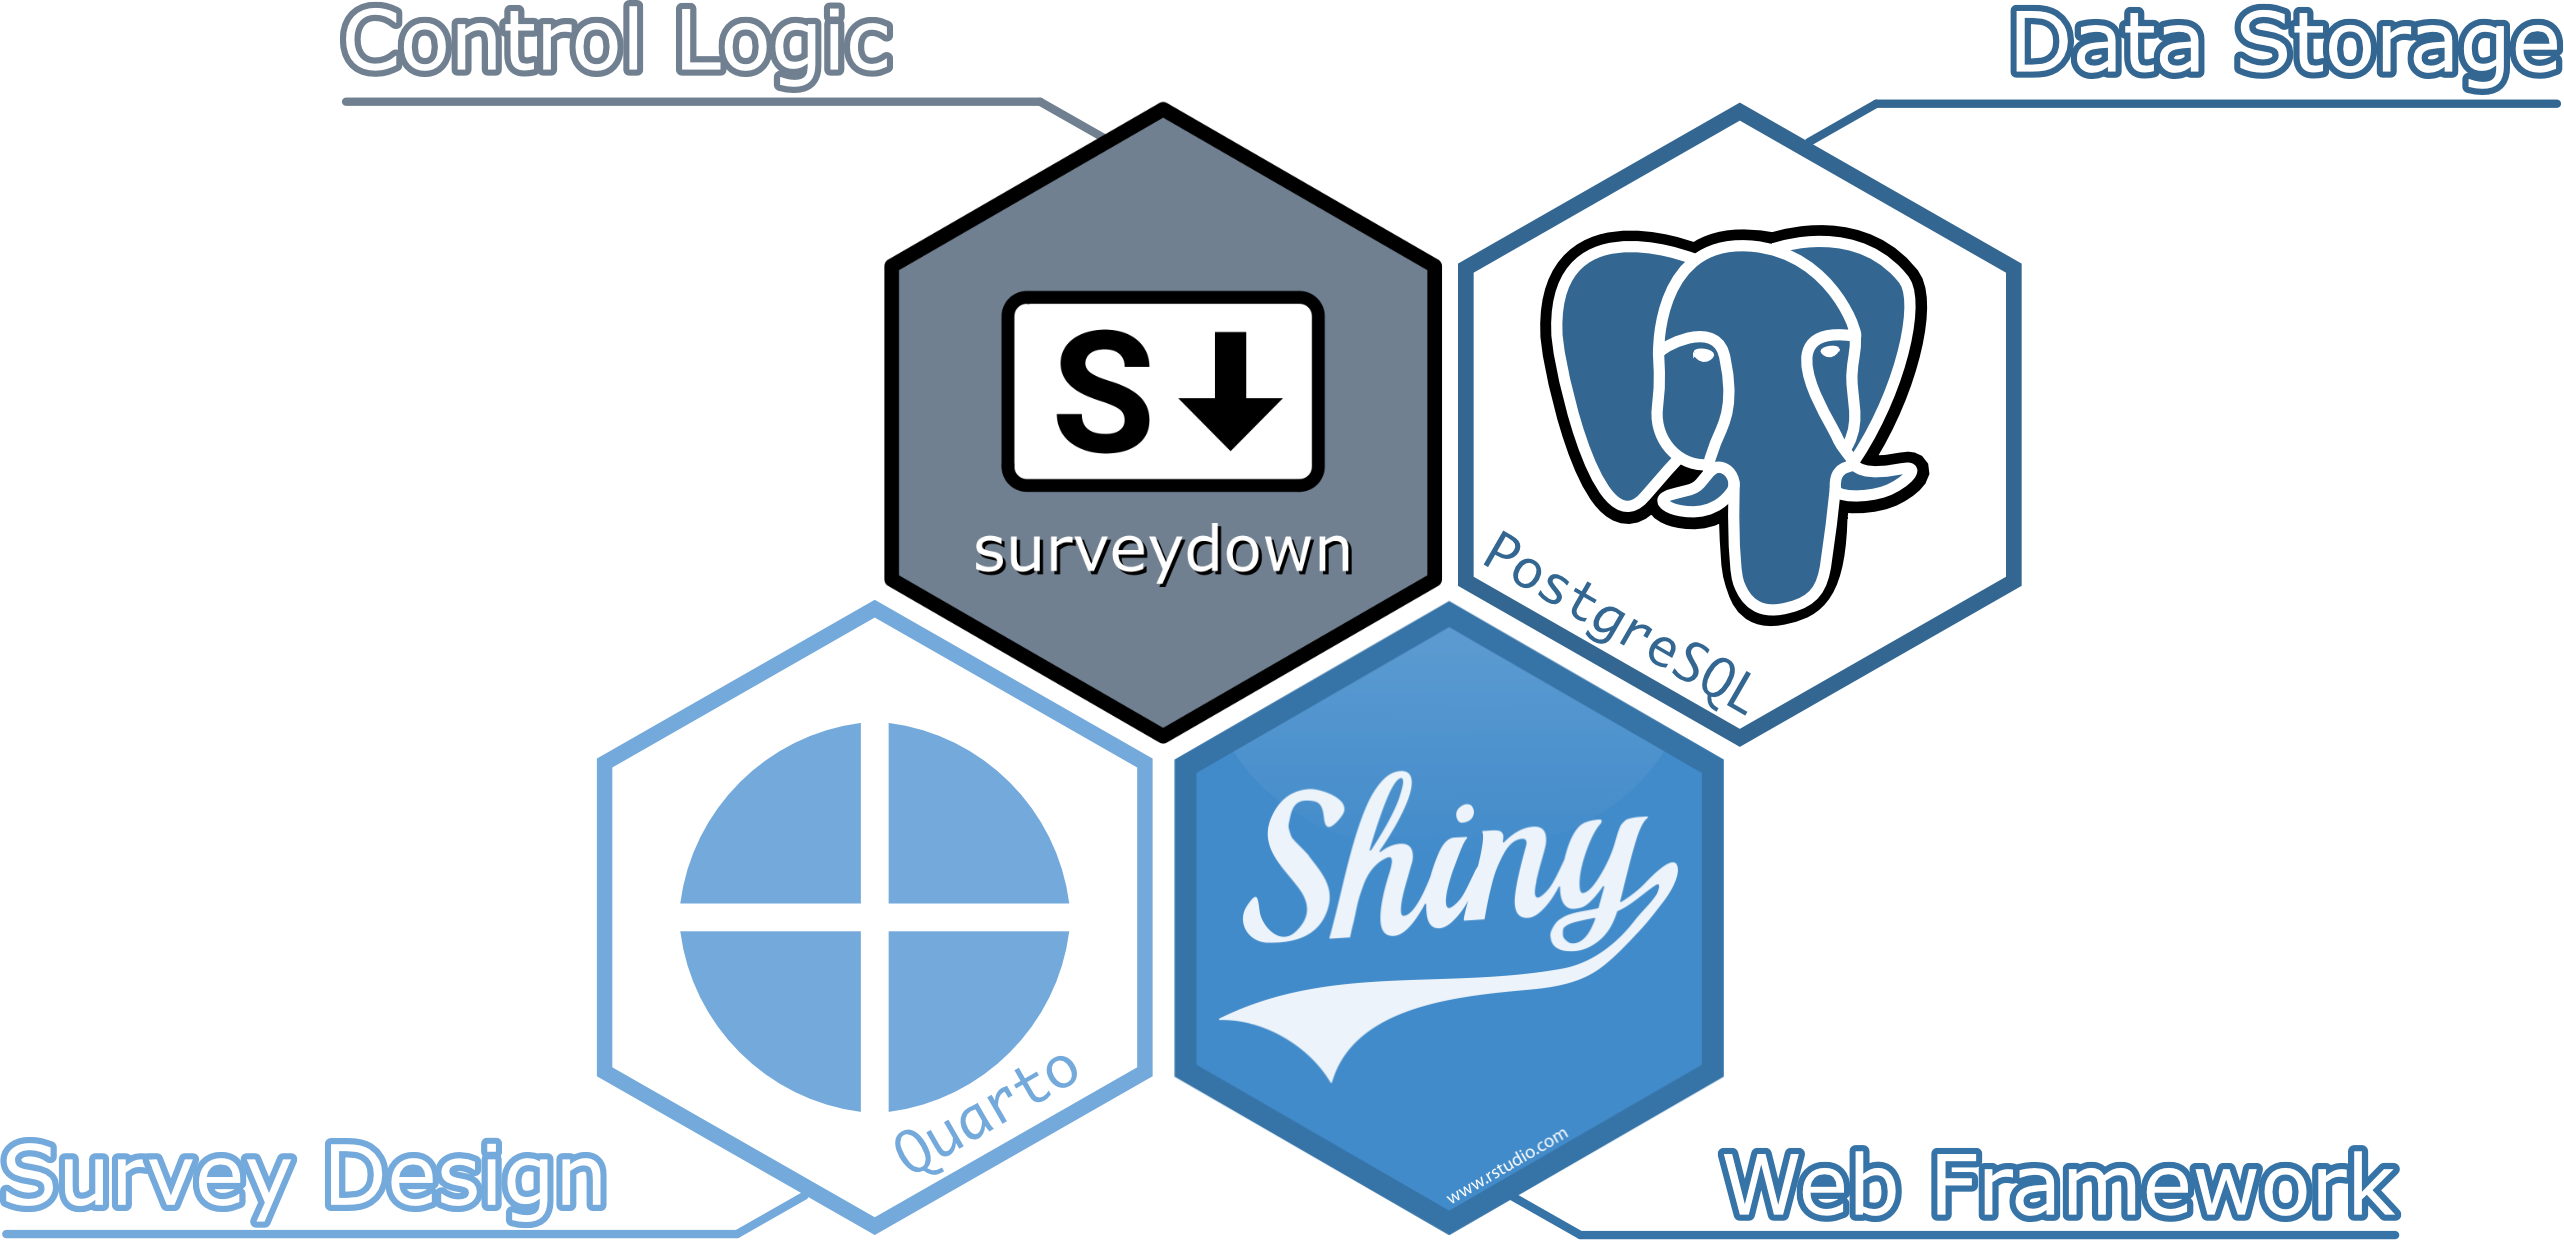
Technologies of surveydown
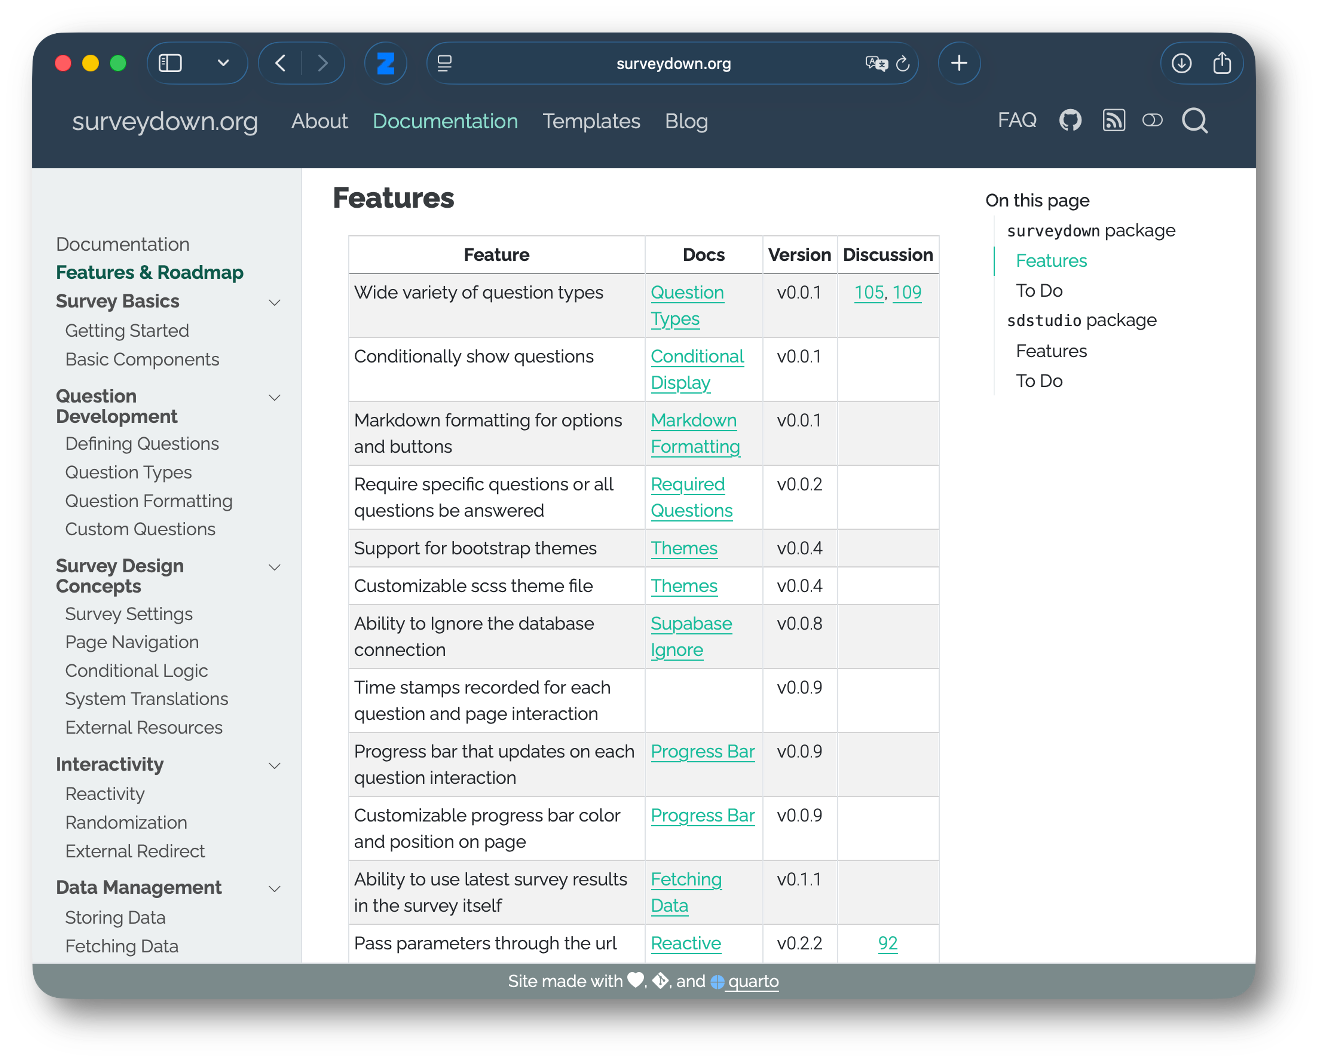
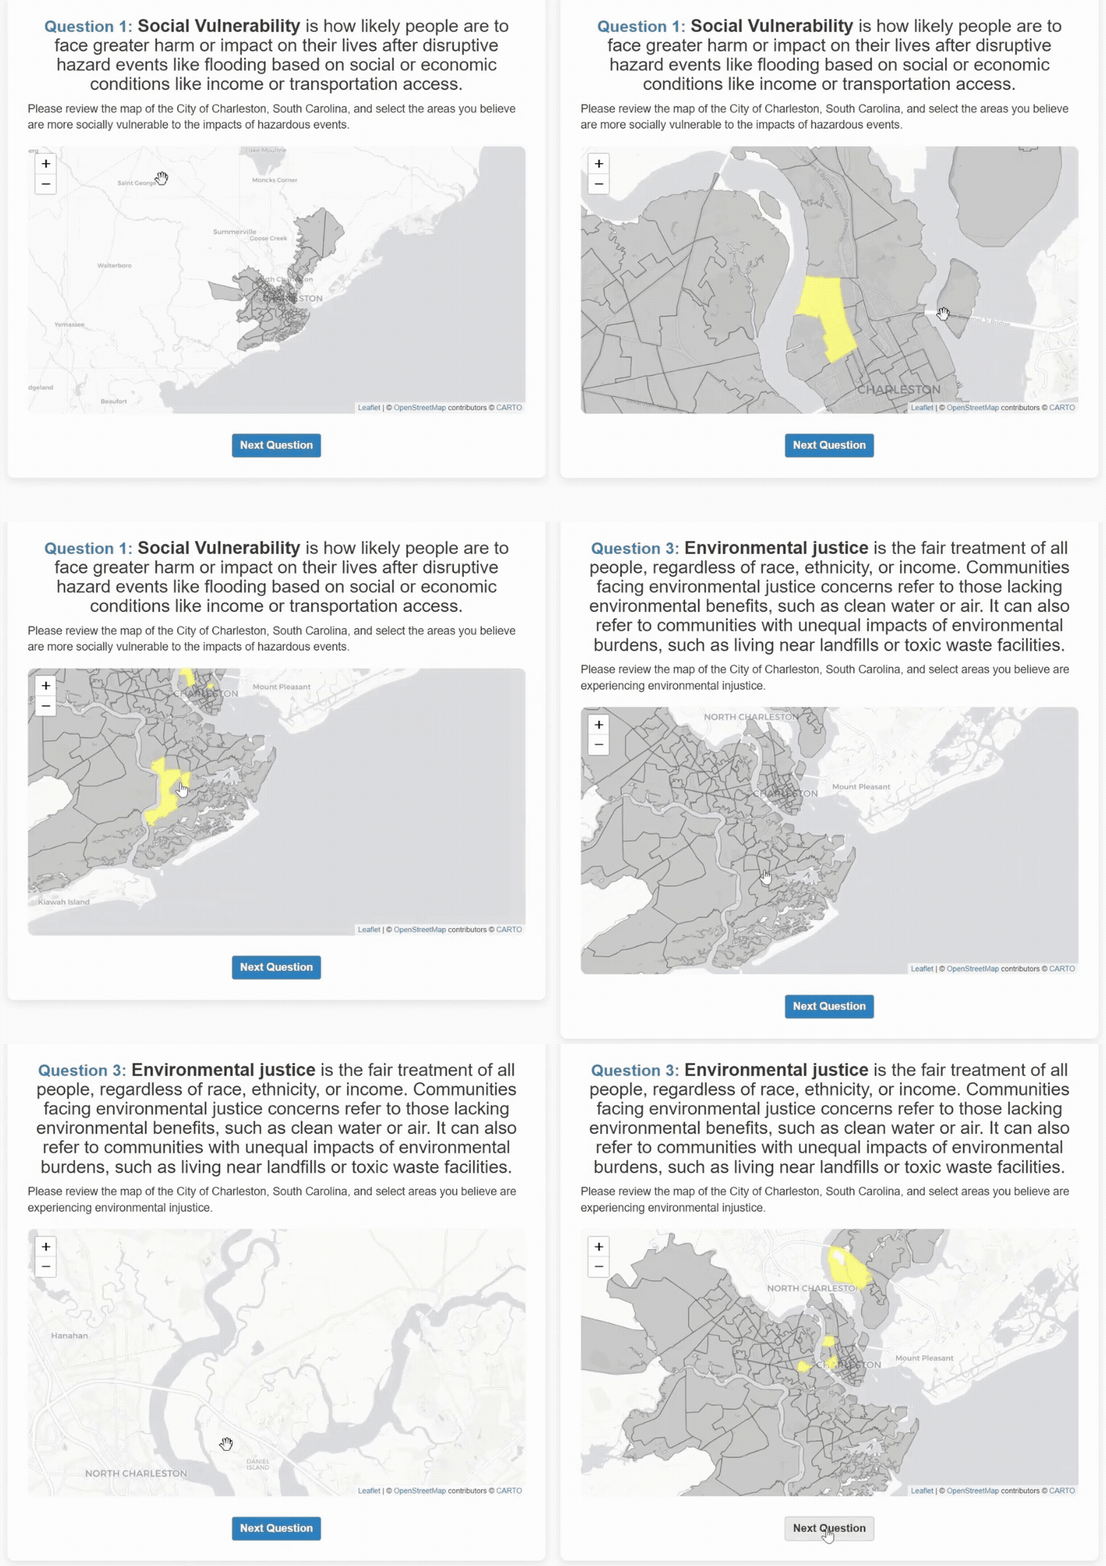
surveydown is feature-packed!
Randomization: Conjoint question
Shiny compatibility: leaflet map
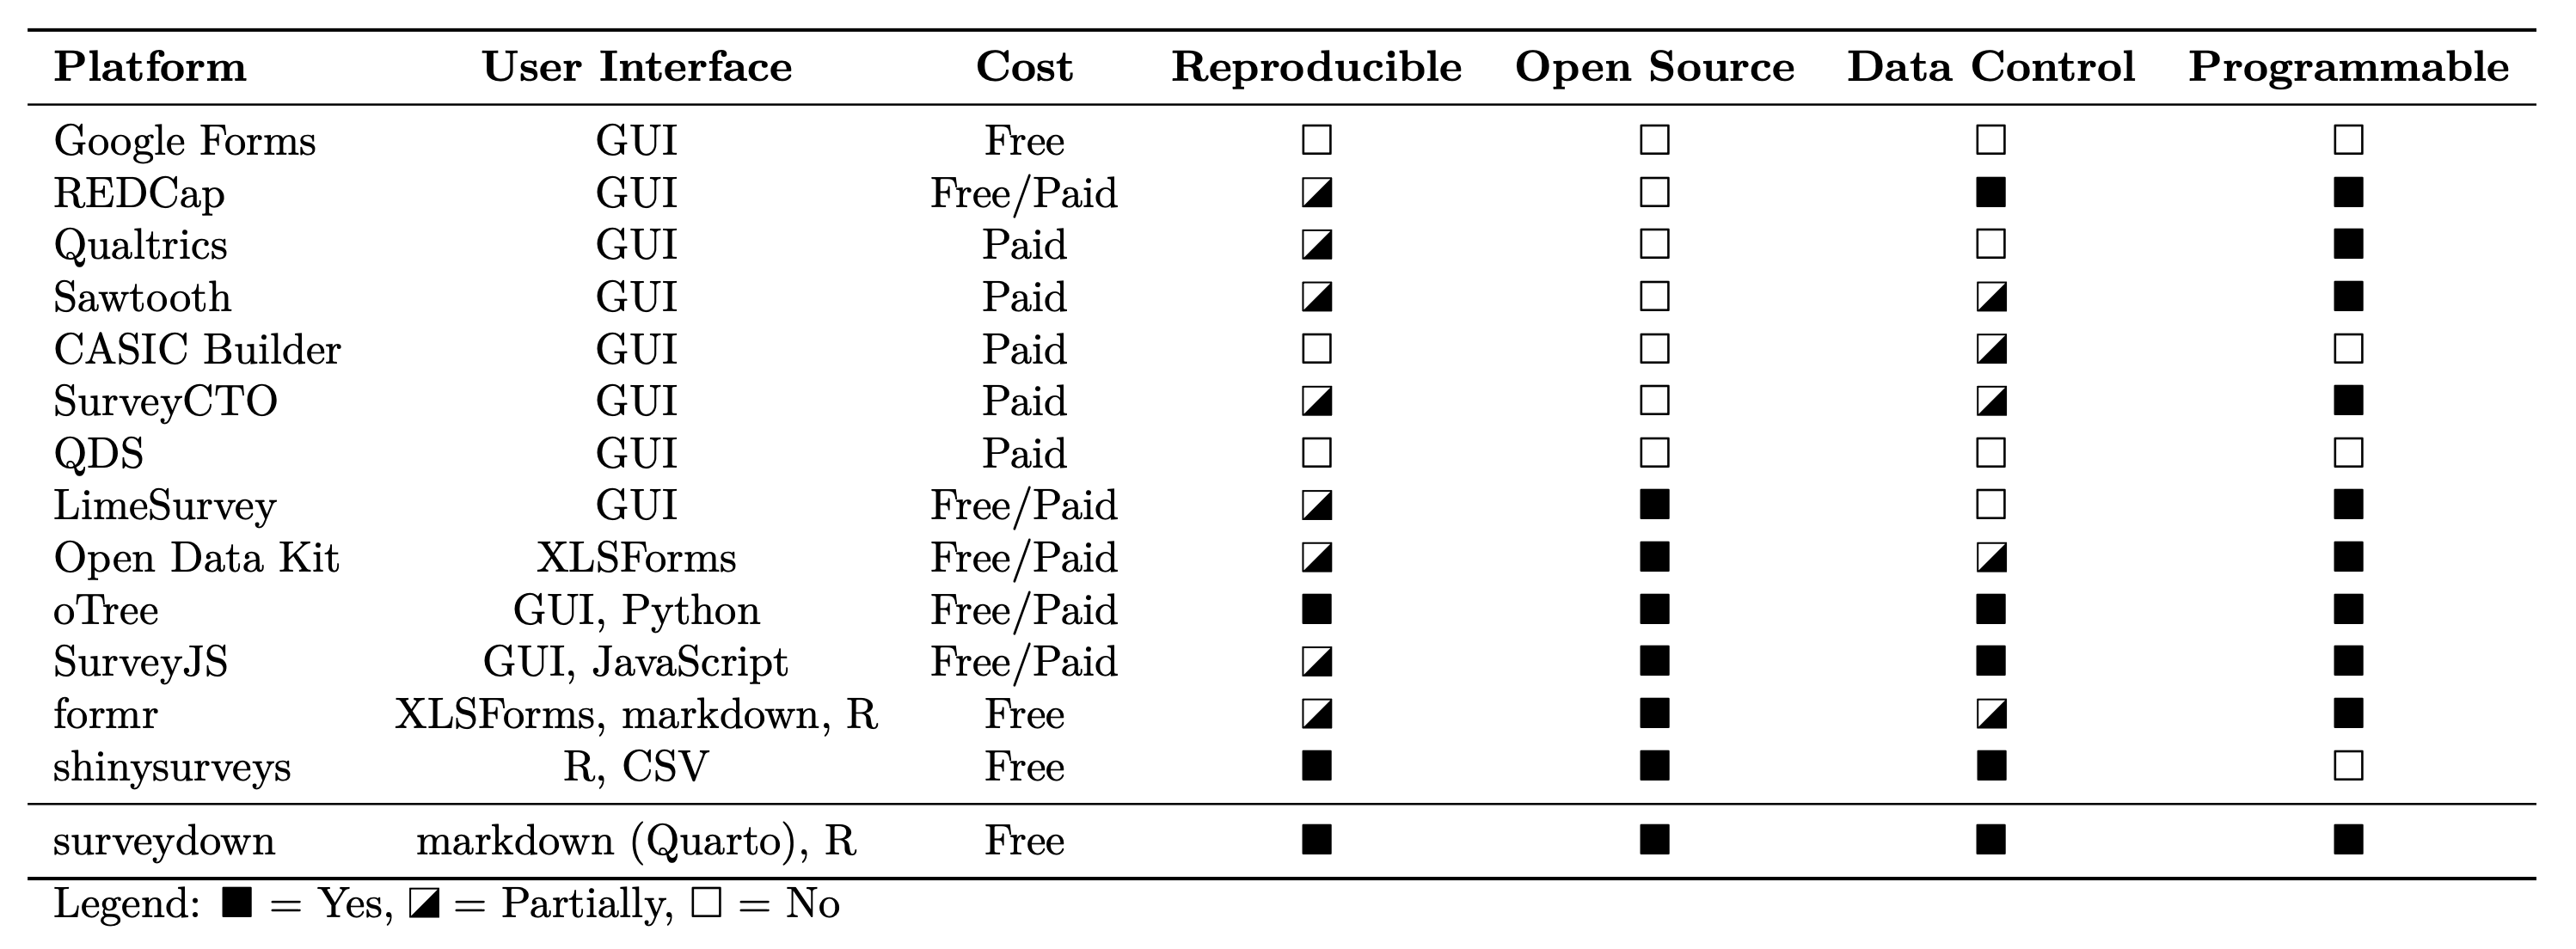
surveydown vs other platforms
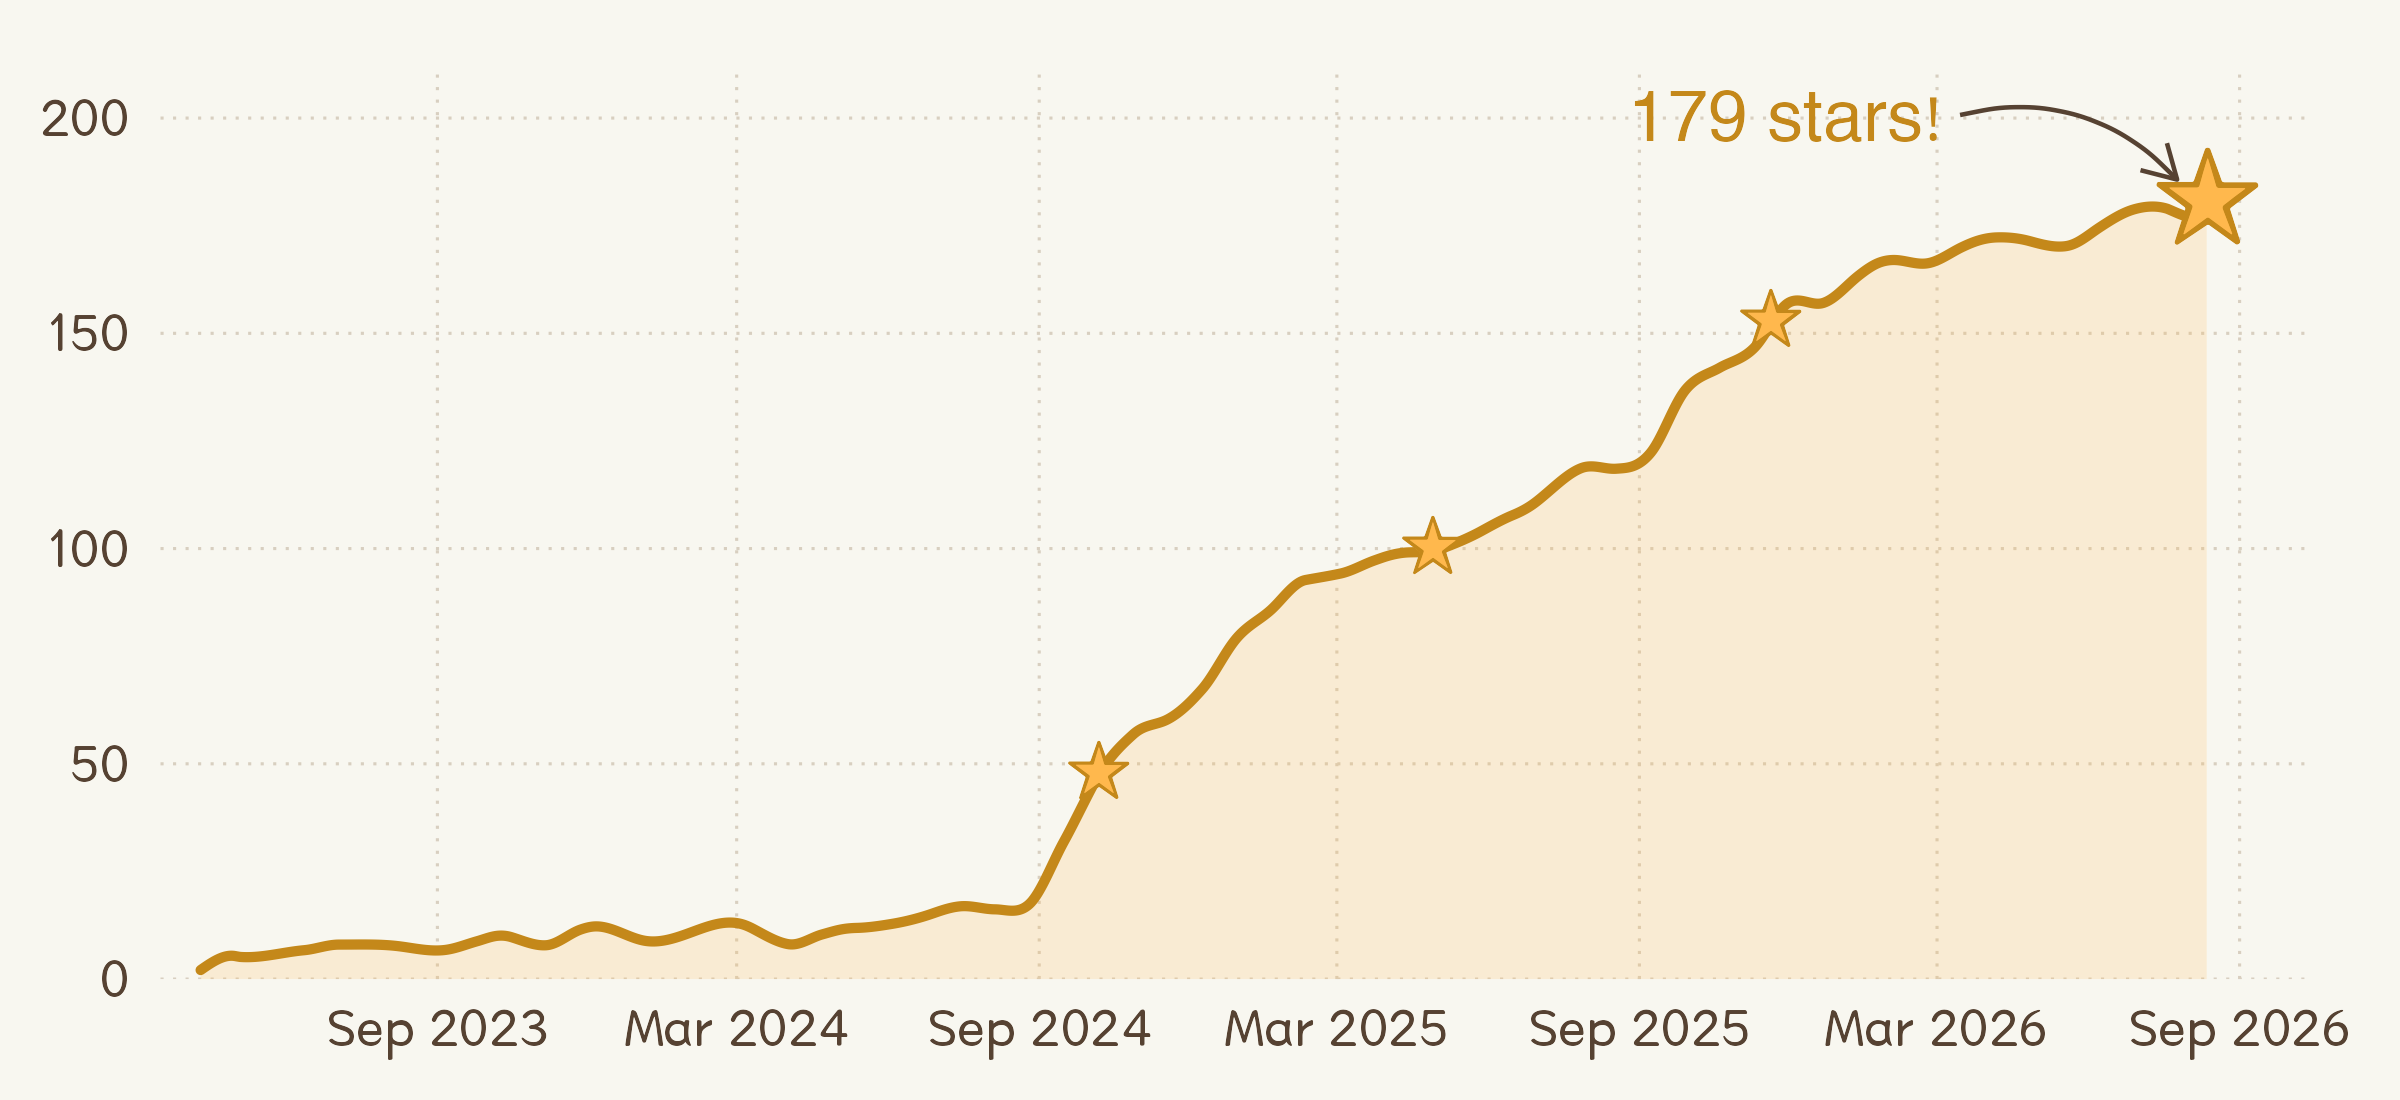
Star Count on GitHub
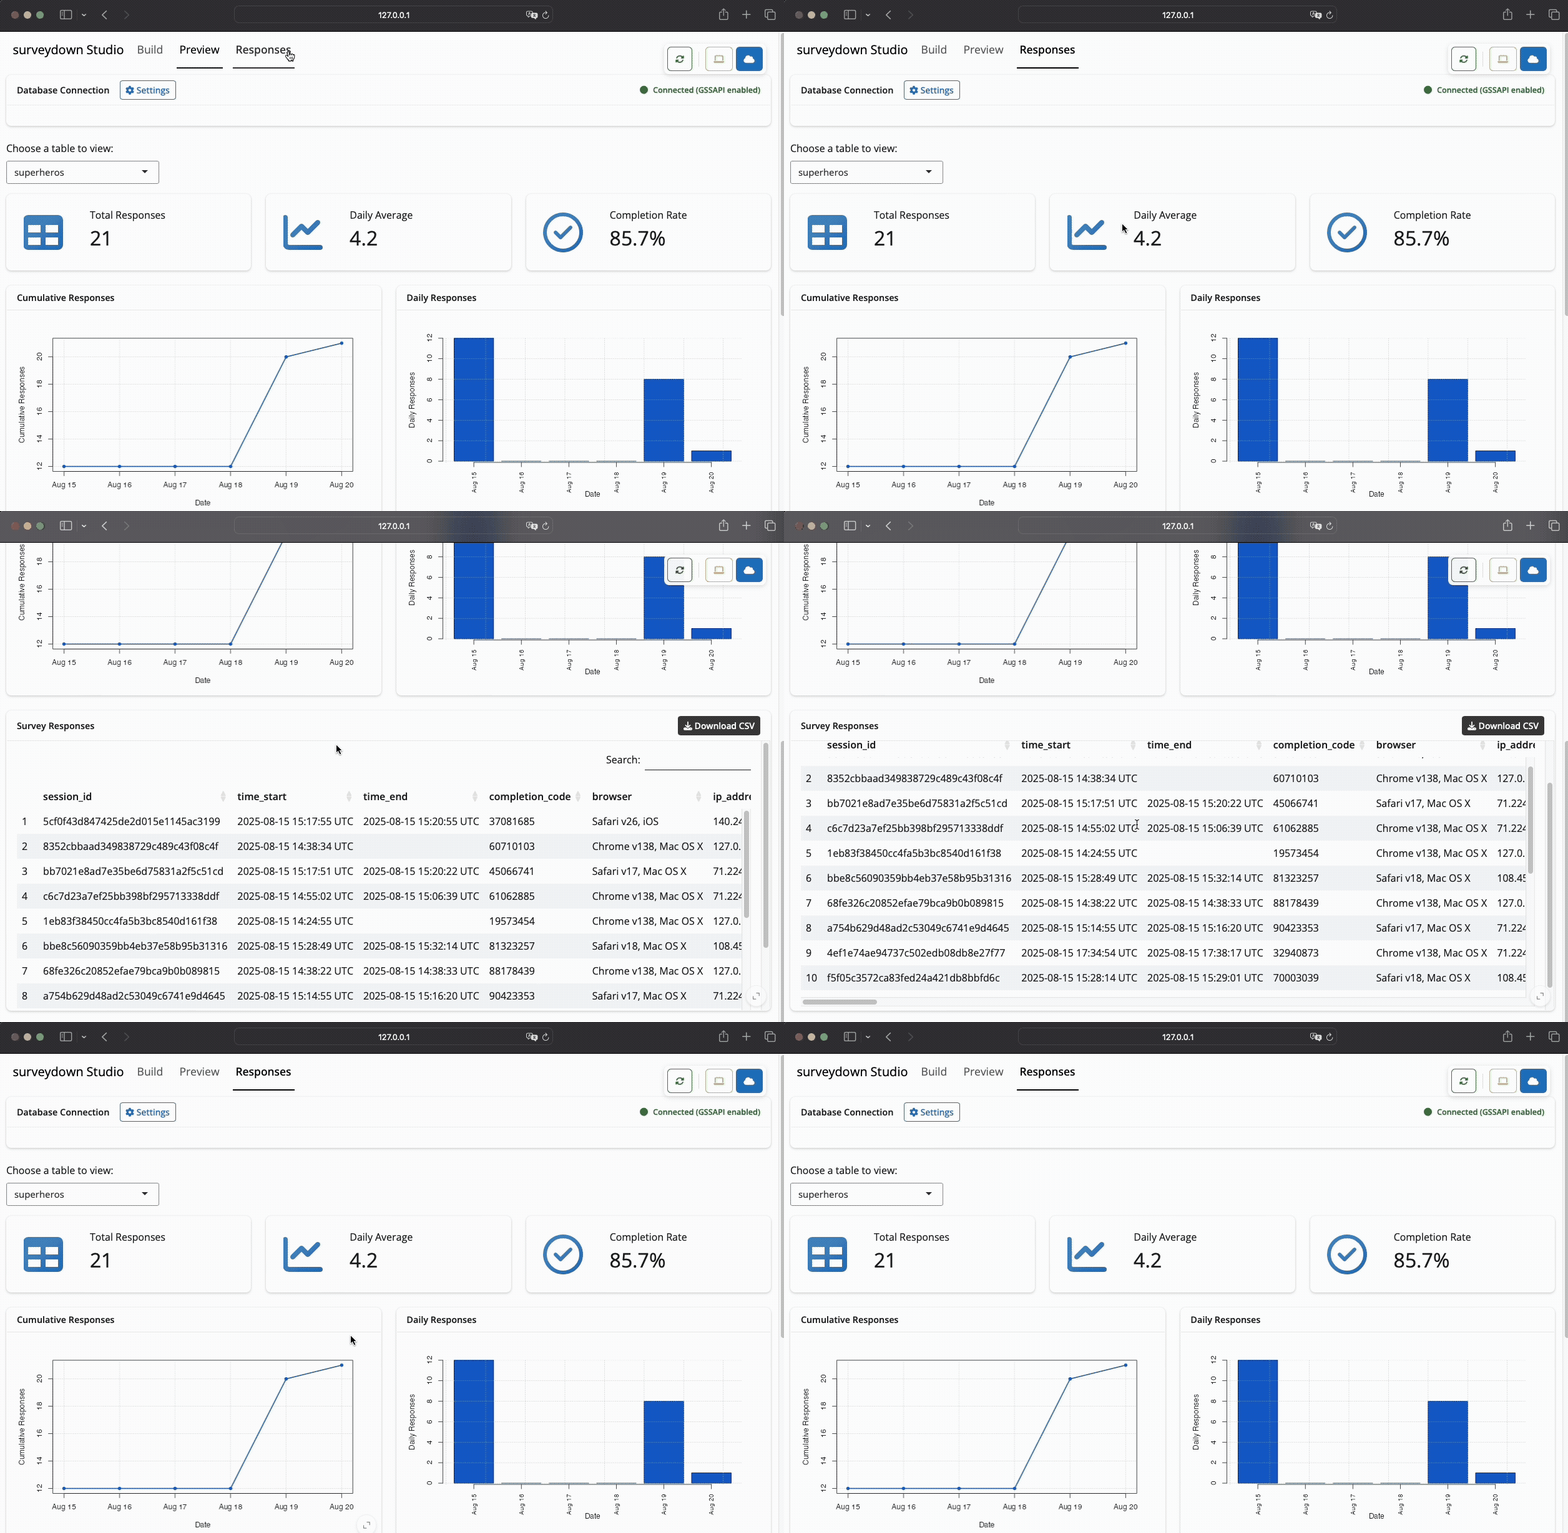
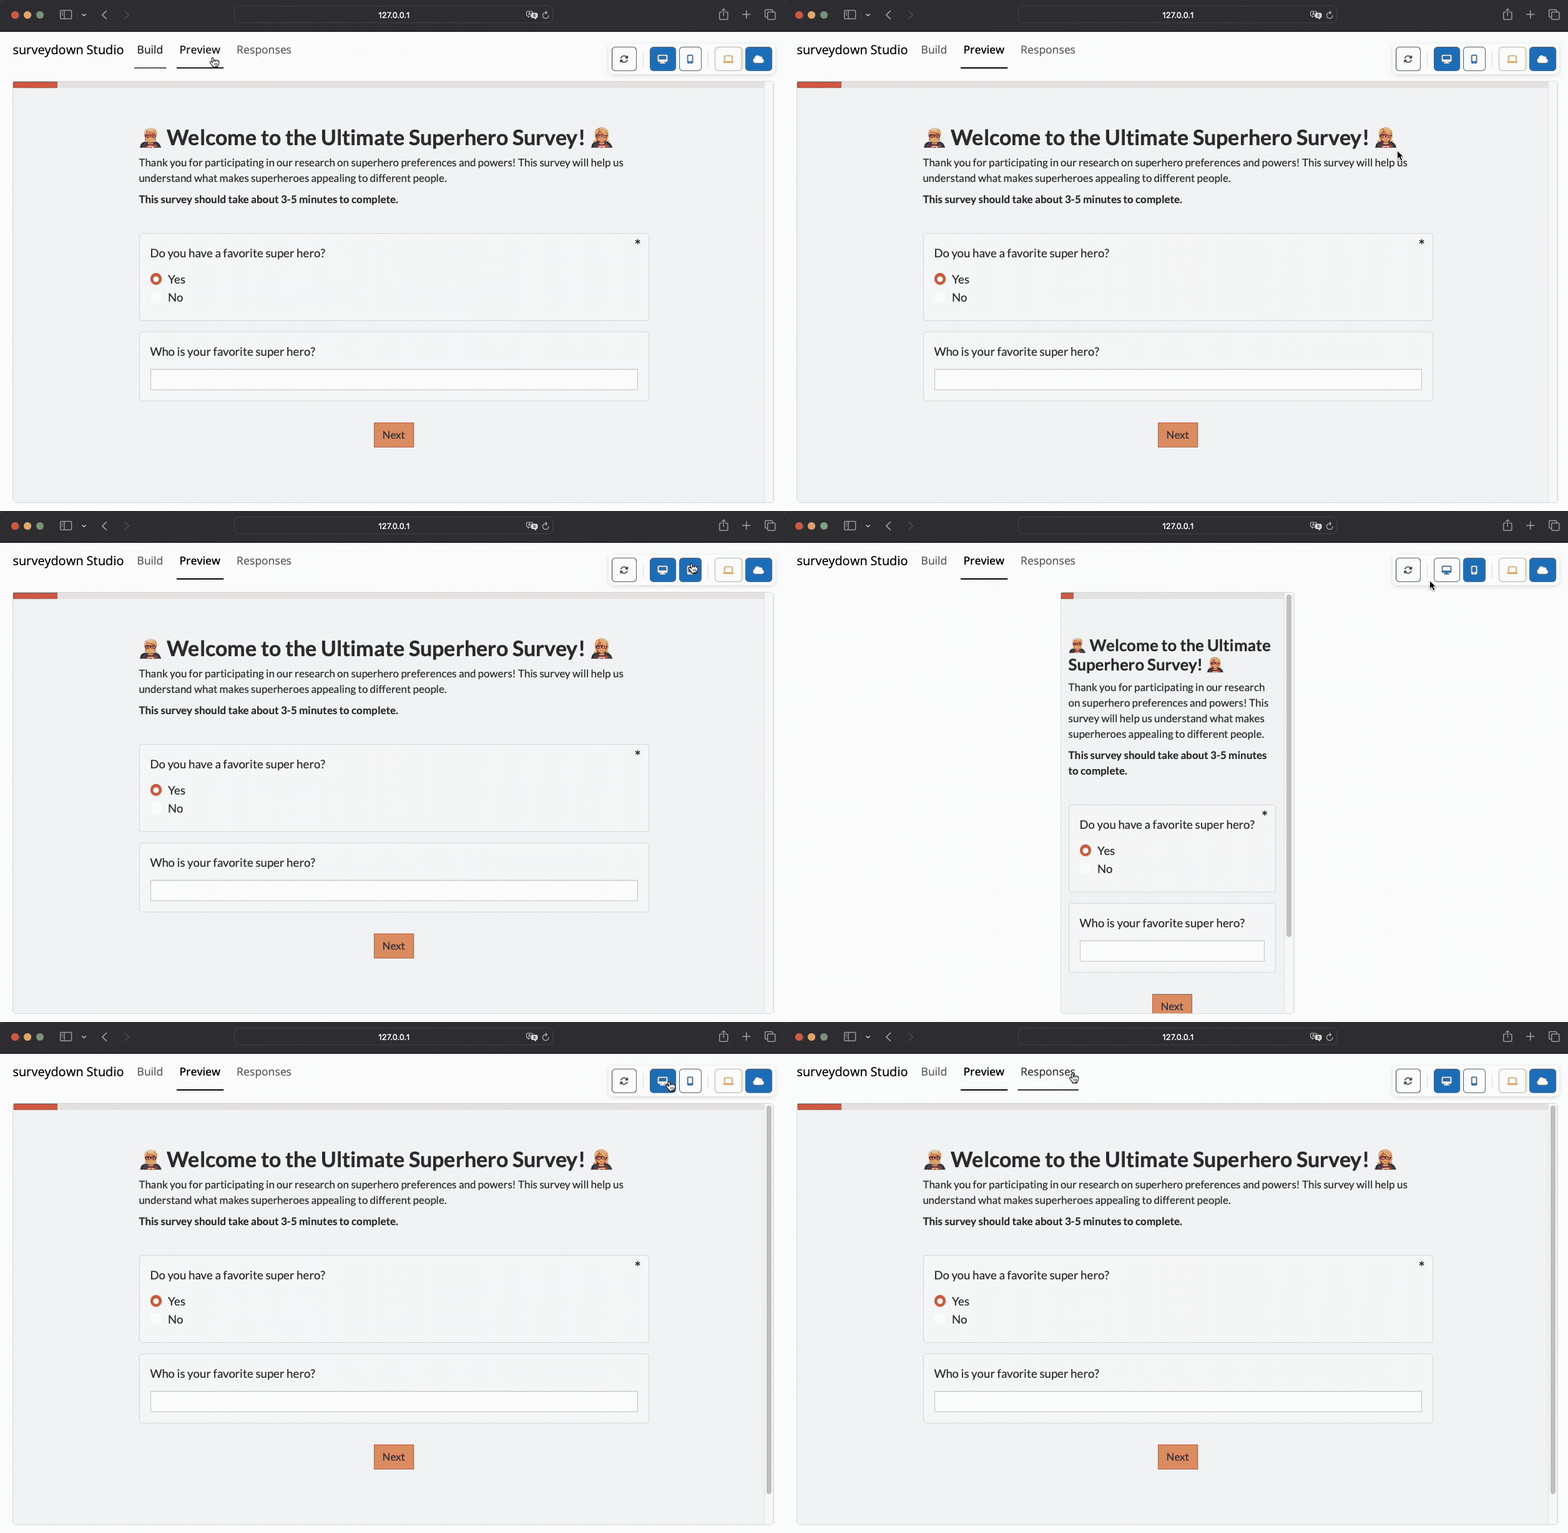
The companion sdstudio package
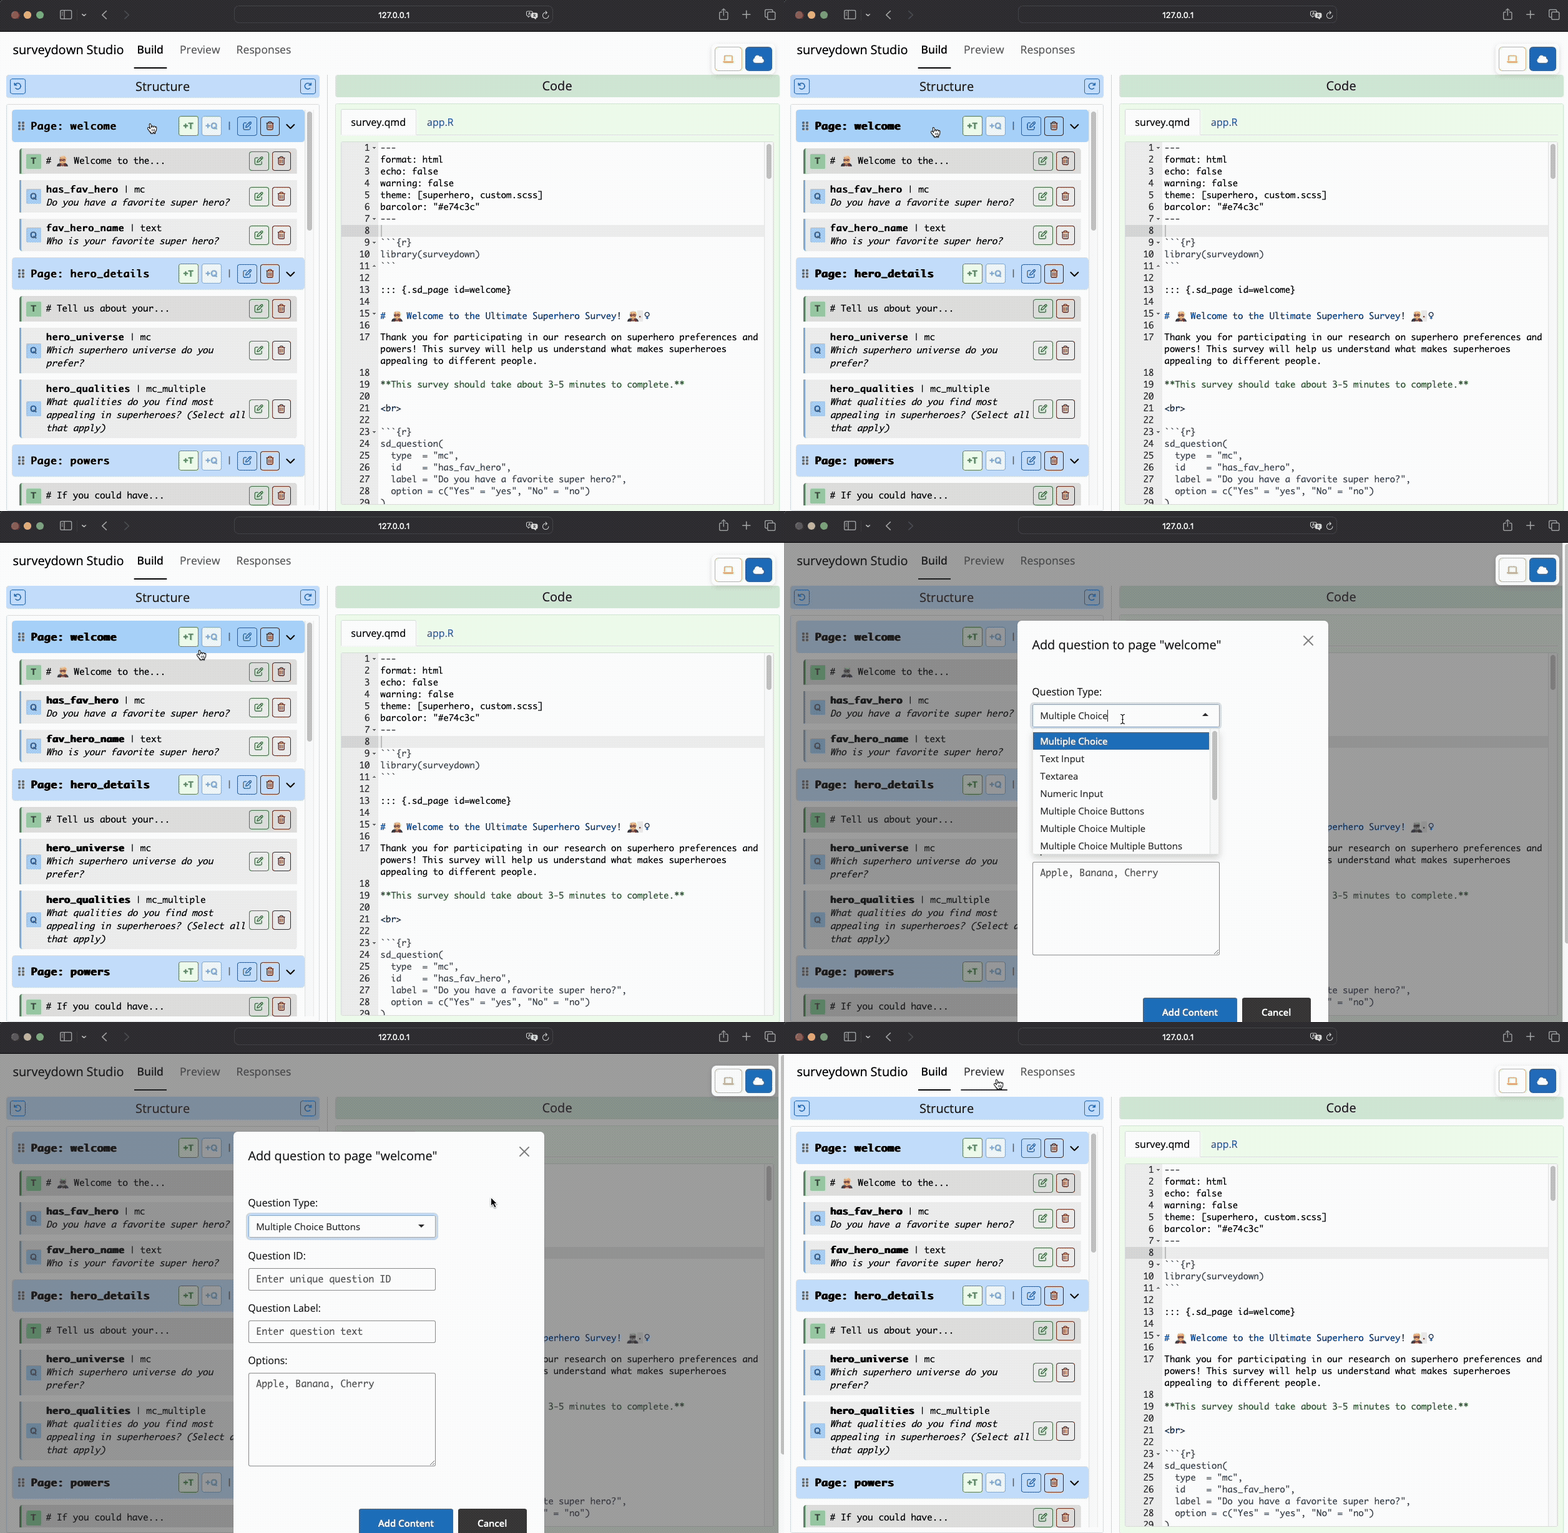
The companion sdstudio package
SMC Scenario Analysis
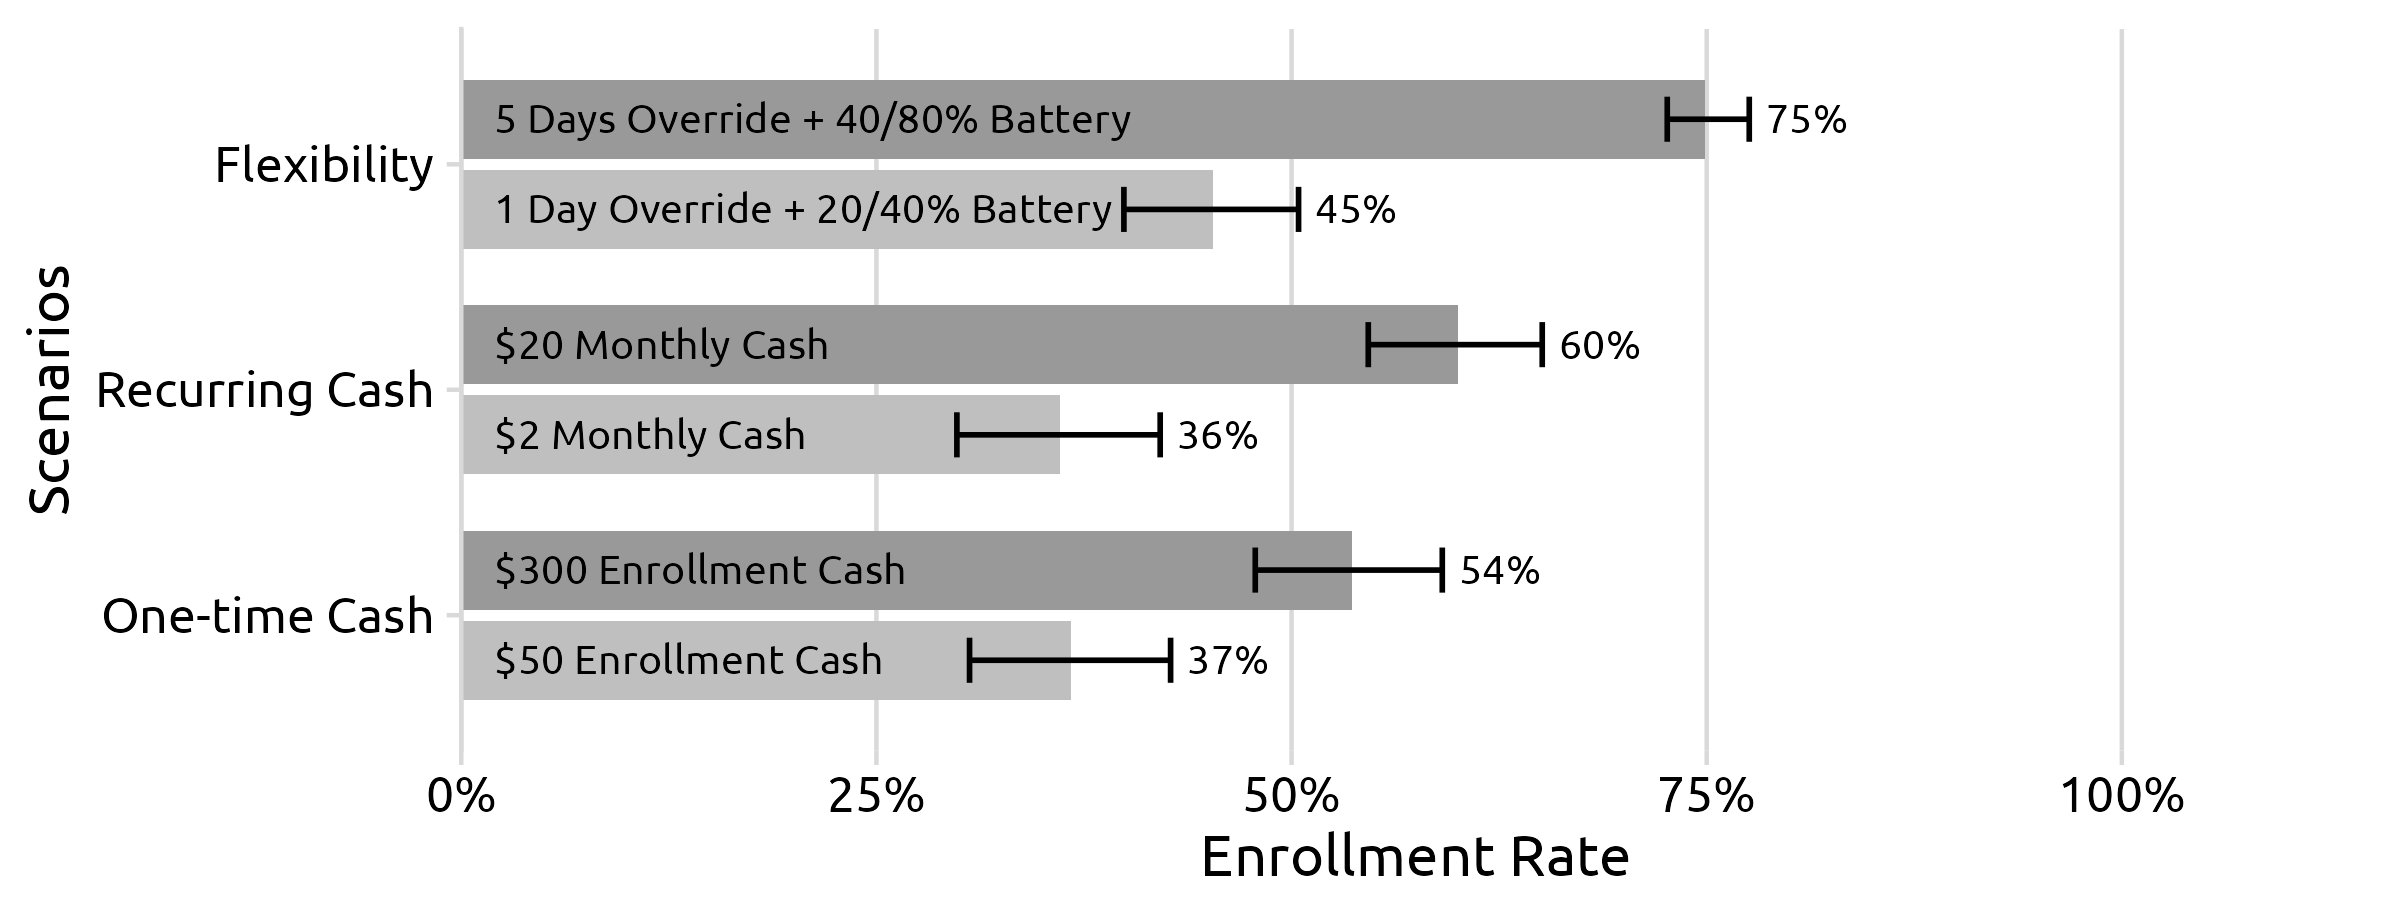
- Flexibility is highly valued.
- Recurring incentives are more important than one-time ones.
- Payment alone is not enough.
V2G Scenario Analysis
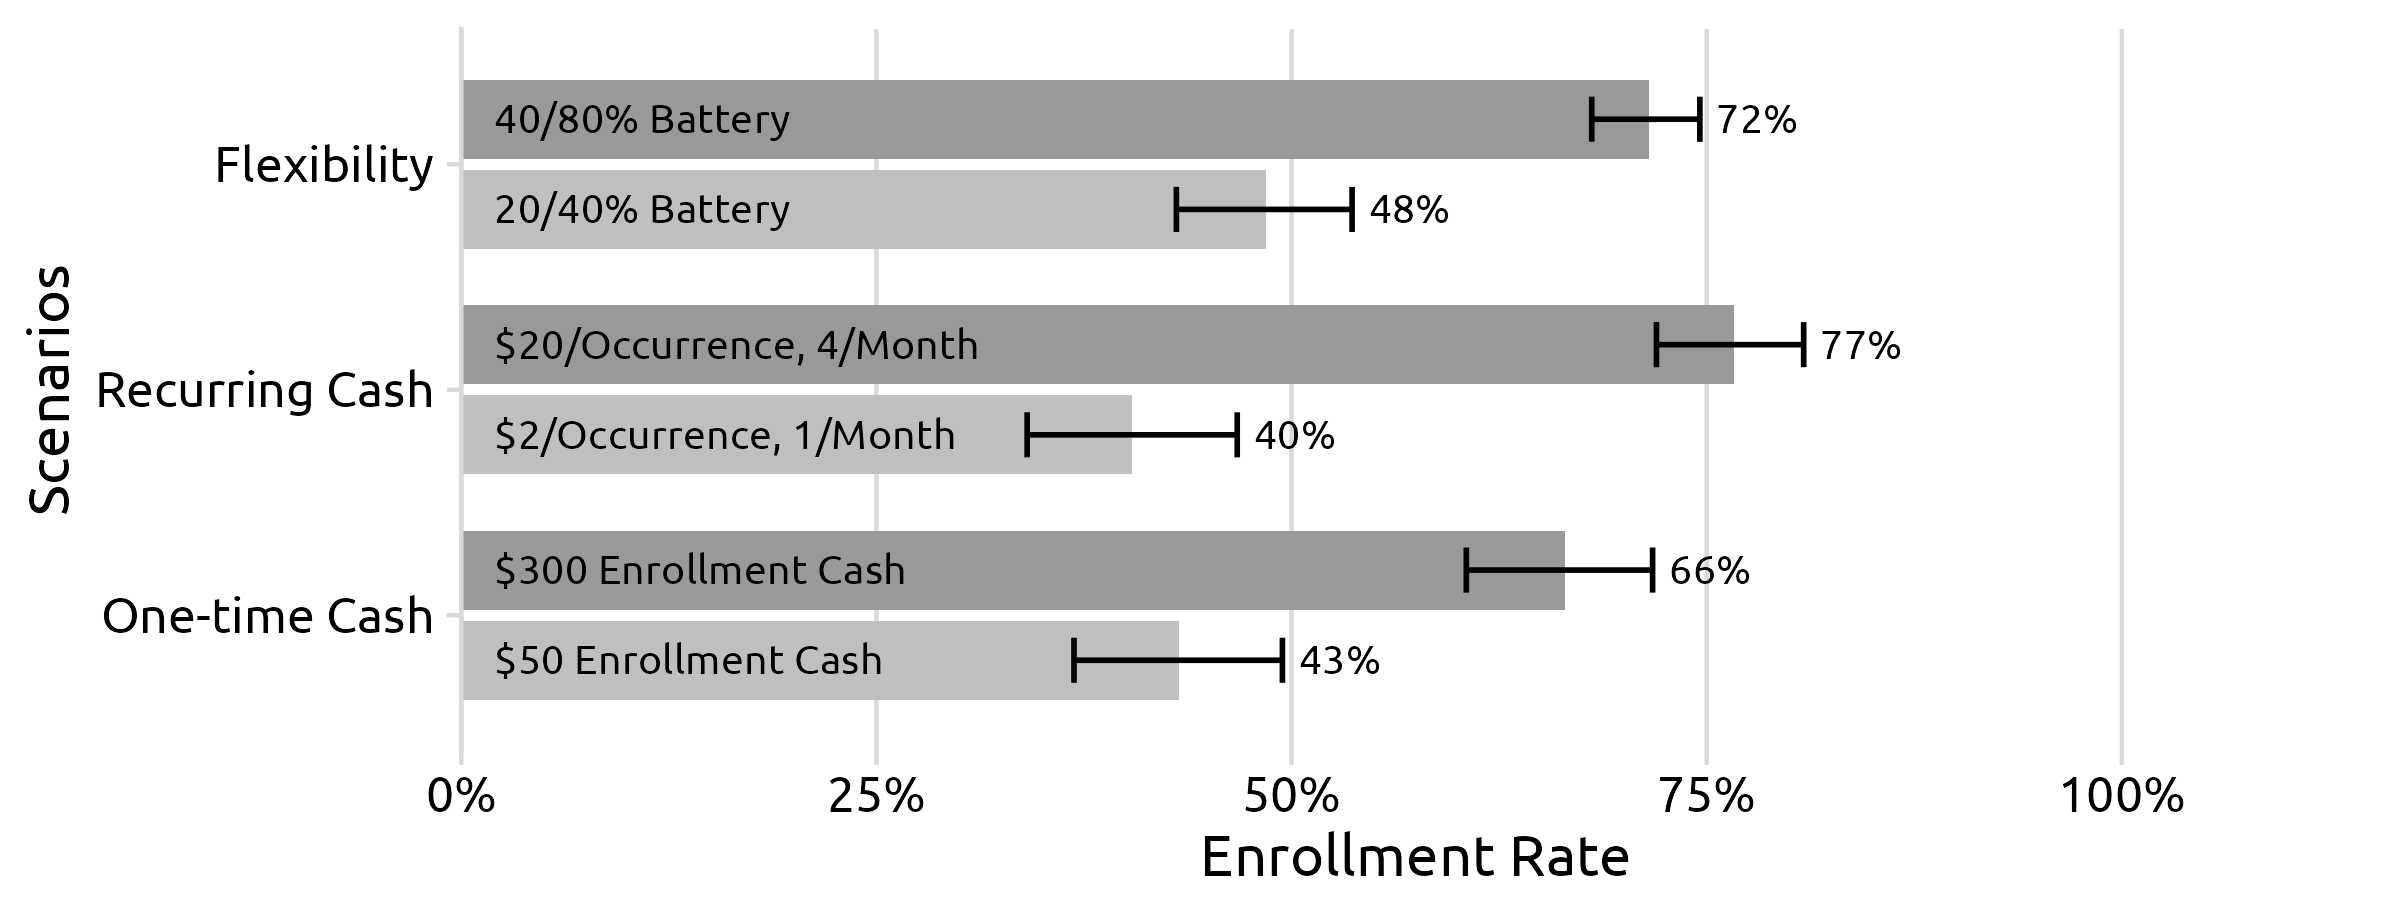
- Still, recurring incentives are more important than one-time ones.
- But flexibility is not as important as in SMC.
- Owners are willing to leverage BEV as a source of income.
Question Type: text

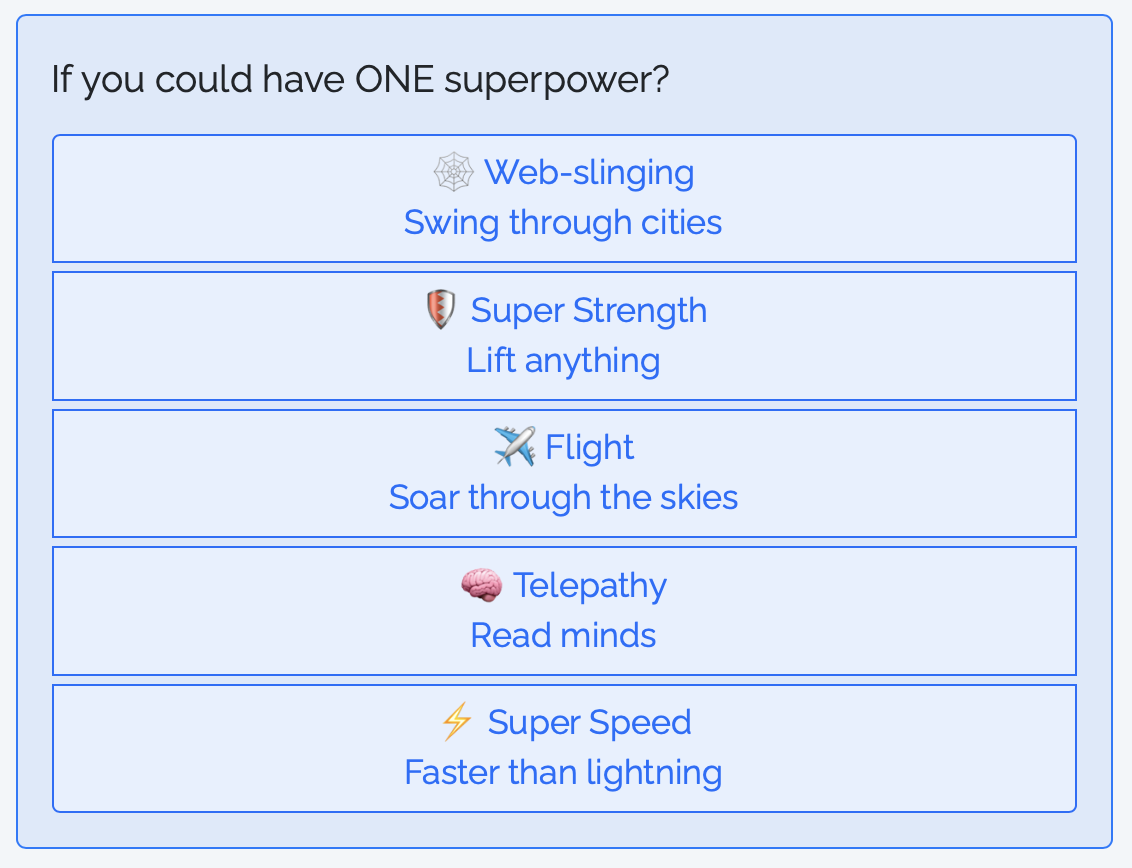
Question Type: mc_buttons
sd_question(
  type  = "mc_buttons",
  id    = "dream_power",
  label = "If you could have ONE superpower, which would you choose?",
  option = c(
    "🕸️ Web-slinging"   = "webslinging",
    "🛡️ Super Strength" = "strength",
    "✈️ Flight"         = "flight",
    "🧠 Telepathy"      = "telepathy",
    "⚡️ Super Speed"    = "speed"
  ),
  direction = "vertical"
)
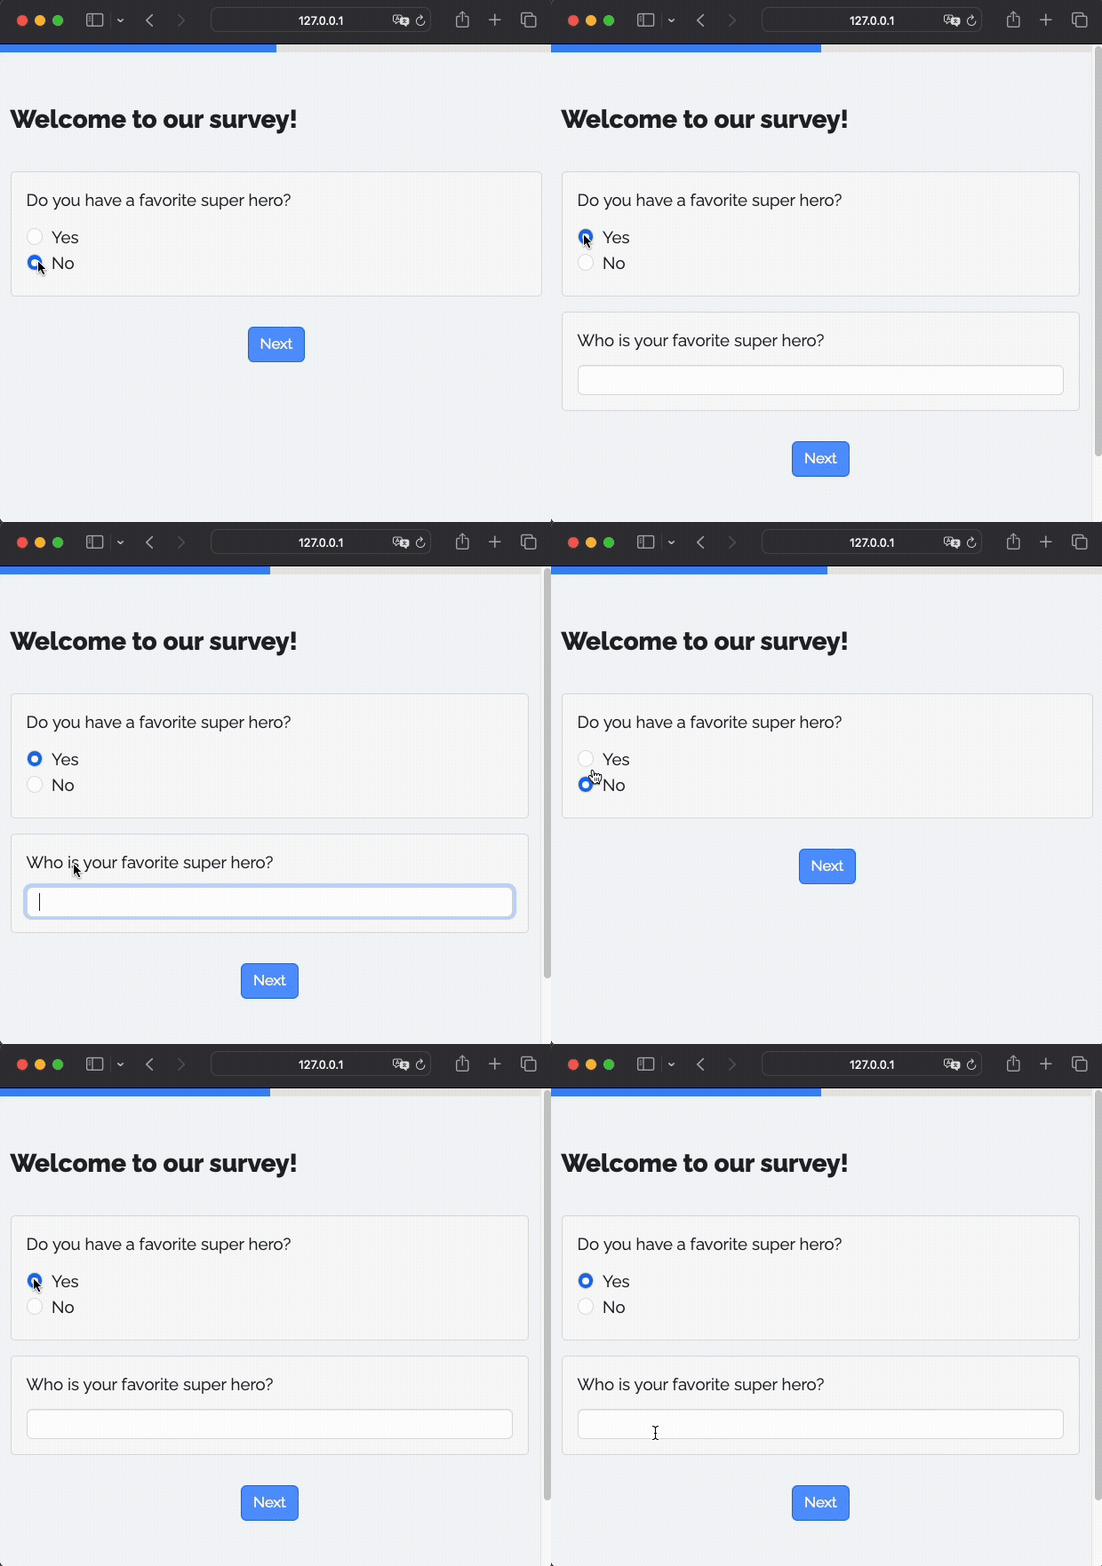
Conditional showing - sd_show_if()
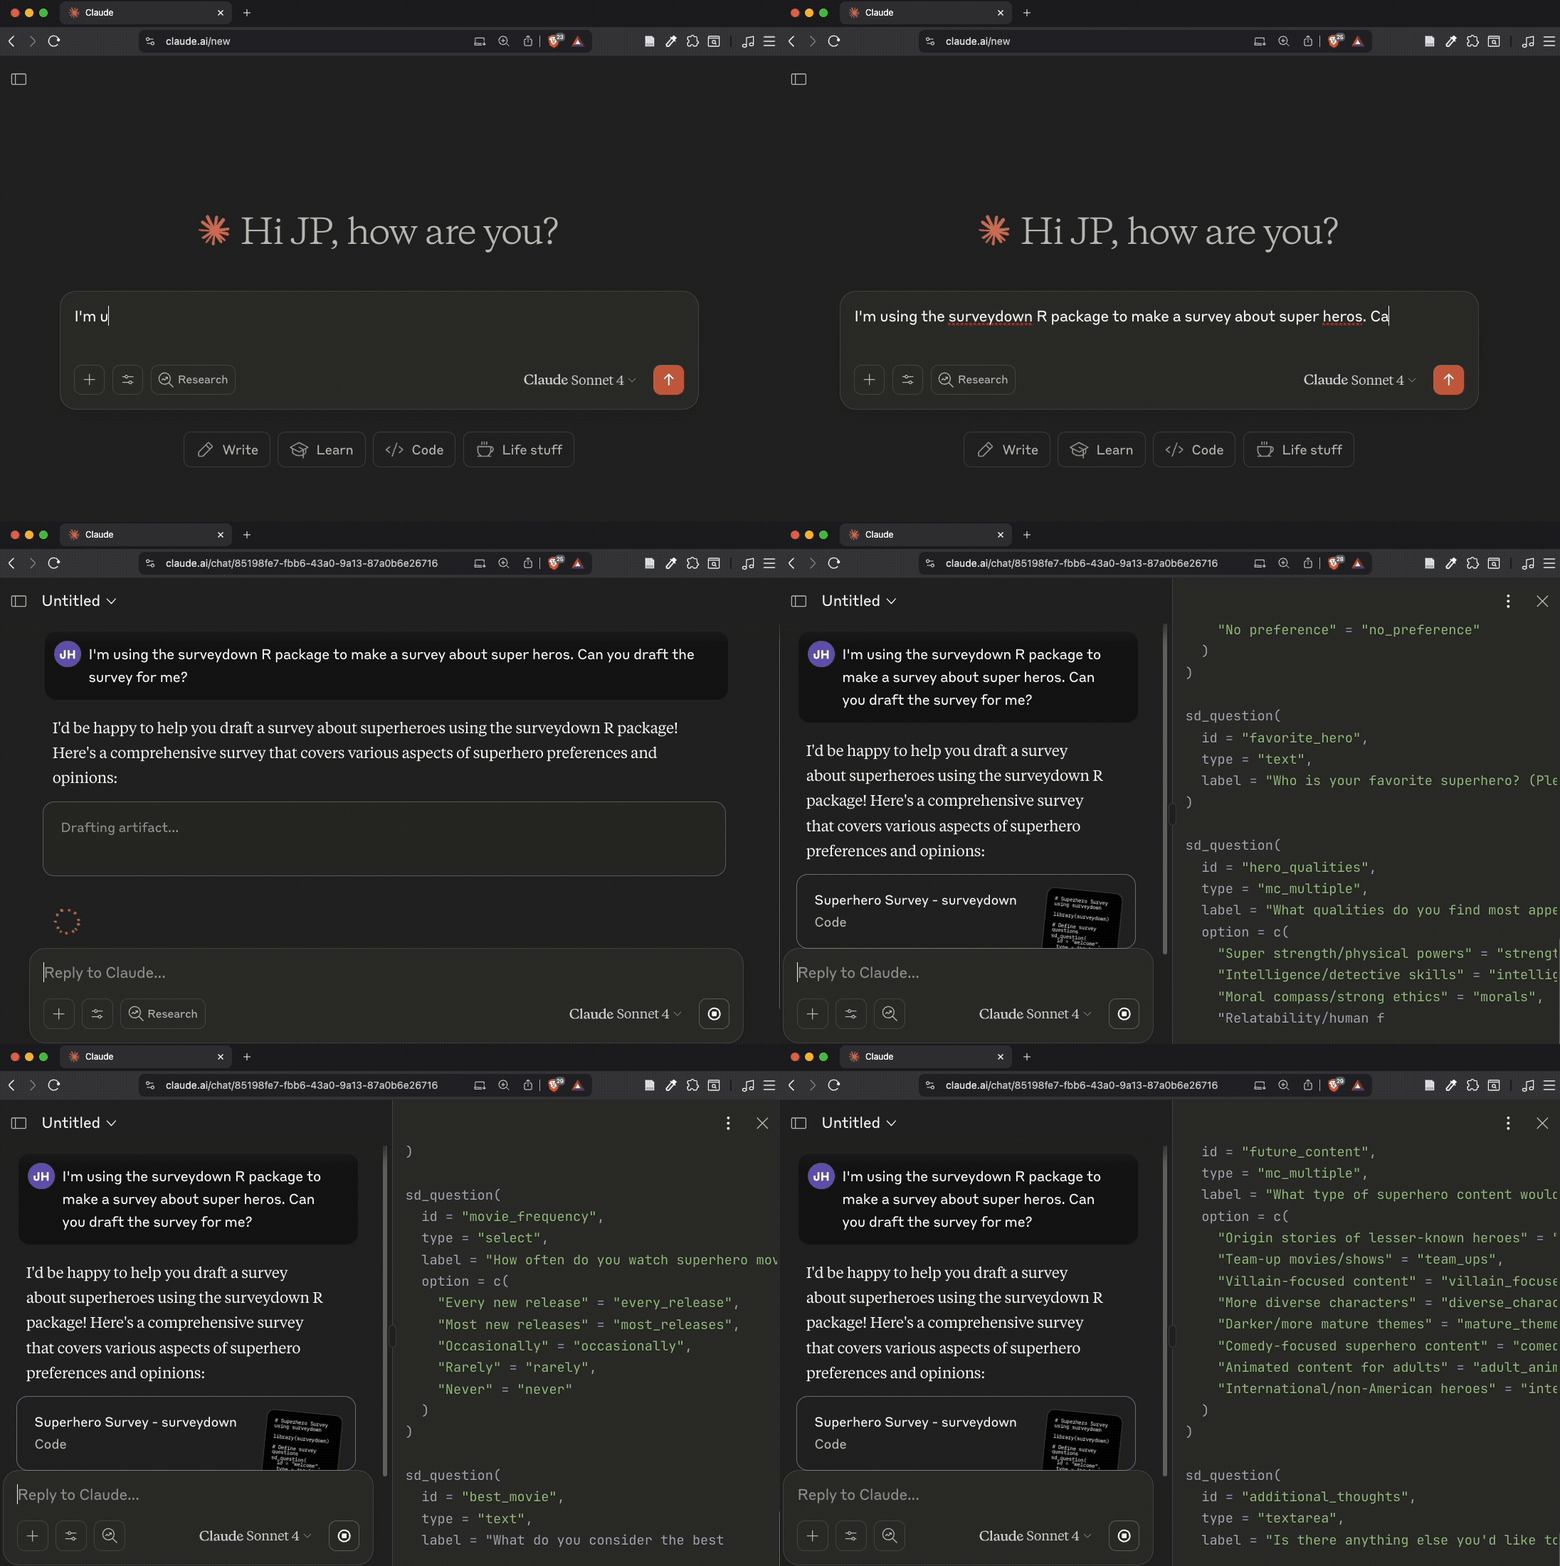
Generate surveys with LLMs!
The companion sdstudio package